
Pandemic mortgage relief headed off delinquencies, but what happens now?
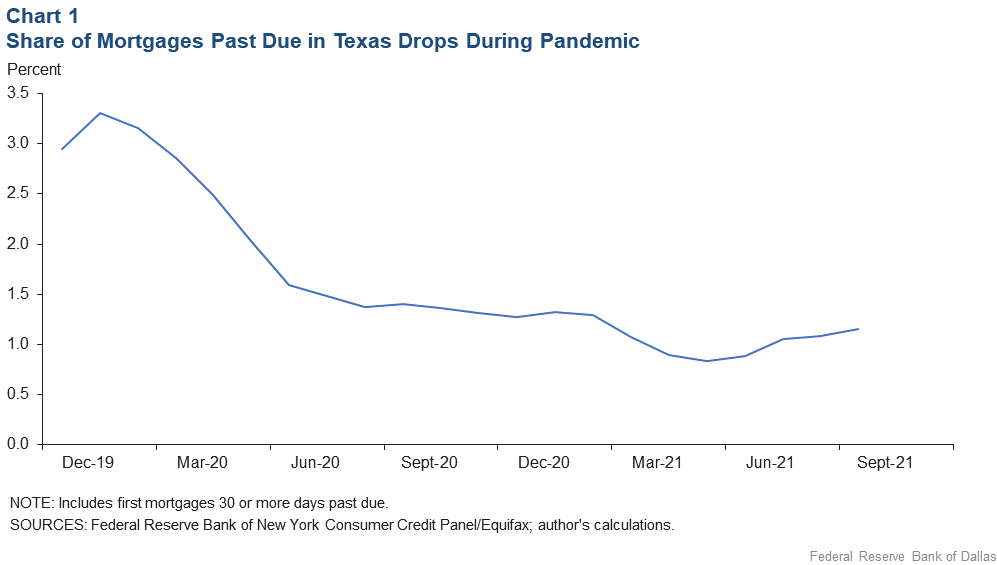
In the early months of the COVID-19 pandemic, when 1.4 million Texans lost their jobs and the state’s unemployment rate more than tripled, one might have expected a concurrent surge in the share of homeowners with delinquent mortgage payments on their credit reports. Yet according to data from Equifax, one of the country’s main credit bureaus, the share of mortgage payments that were at least 30 days past due in Texas did not rise. In fact, from February to June 2020, the share of delinquent mortgages plummeted by half (Chart 1).
Homeowners in Texas and the U.S. can thank the Coronavirus Aid, Relief and Economic Security (CARES) Act’s economic relief measures, in particular mortgage forbearance, for this trend. Aside from billions of dollars set aside for direct stimulus checks and expanded unemployment benefits, the CARES Act also provided for temporary cessation of payments on federally backed mortgages.
The CARES Act offered this forbearance option for homeowners experiencing pandemic-related financial hardship, regardless of whether a borrower was current on mortgage payments before the pandemic. The act initially granted forbearance to borrowers for 180 days, but for many, extensions led to a maximum period of 18 months of relief that is now at, or nearing, an end.[1] An estimated 70 percent of the mortgage market was covered by this provision, which did not require borrowers to provide proof of financial hardship.[2]
The CARES Act explicitly required servicers to report forborne borrowers as “current” to credit bureaus if the borrowers had been current on payments prior to the pandemic.[3] So while mortgage furnishers recorded missed payments, they continued to report the borrowers’ prepandemic status to Equifax. Therefore, reports of delinquencies from credit bureaus may understate financial distress during this period.
Fortunately, we have access not only to the Equifax reports shown in Chart 1, but also to records from the servicers themselves that indicate nonpayment. If we examine the difference in delinquencies between the two sources, we can estimate the share of forborne borrowers over time. We evaluated the extent to which forbearance cloaked the level of mortgage distress during the pandemic and identified ZIP codes across Texas where homeowners suffered the most. The results point to which areas of the state may need the most attention now that federal pandemic aid is over for most.
Chart 2 contrasts Equifax’s Credit Risk Insight Servicing data (CRISM) with Black Knight’s McDash data coming directly from servicers in order to provide a rough estimate of forbearance participation over time. CRISM is an anonymous credit file match from Equifax’s consumer credit database to the McDash loan-level mortgage dataset. Equifax data assets are used as a source, but all calculations, findings and assertions are those of the author.
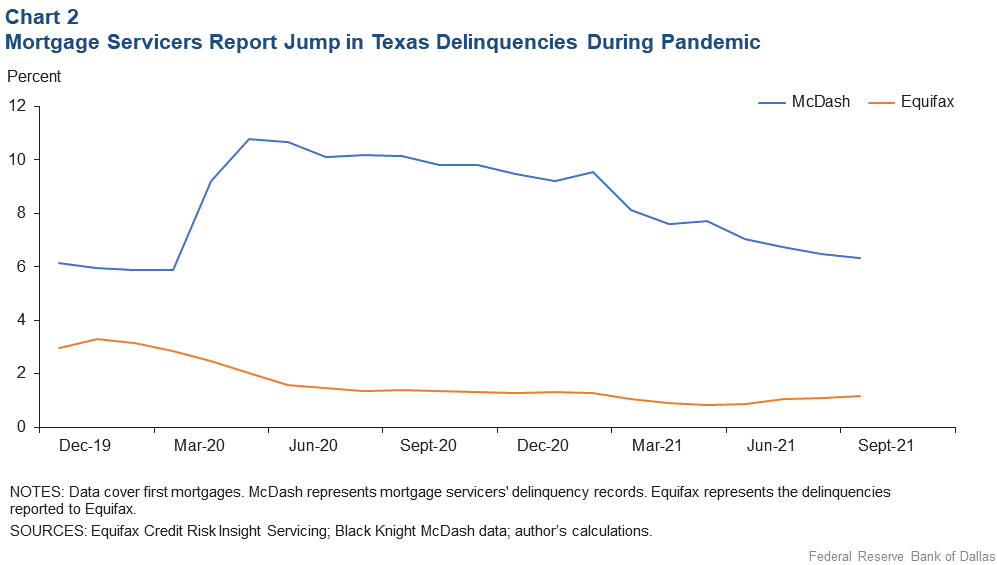
As indicated in Chart 2, the share of mortgages forborne prior to the crisis was small, with a gap between McDash and Equifax data of 3 percentage points in December 2019. This gap, representing the forbearance rate, indeed matches closely with prepandemic numbers reported by the Mortgage Bankers Association. The estimated forbearance rate ballooned to 9 percentage points at its peak in June 2020. In that month, the share of borrowers not making payments was recorded by McDash as 10.7 percent, which suggests that about 85 percent of borrowers shown in McDash data as delinquent were likely in forbearance in June 2020.
Regardless of their reported status, we can estimate that more than 10 percent of homeowners with mortgages in Texas were experiencing payment difficulties in June 2020. This is the highest peak recorded in McDash since the Great Recession, during which 30-day-plus delinquencies peaked at 11.3 percent in January 2010.
We also explored forbearance take-ups by geography. Map 1 depicts mortgage forbearance rates by ZIP code; 1A is the prepandemic period, while 1B shows the shares in June 2020.
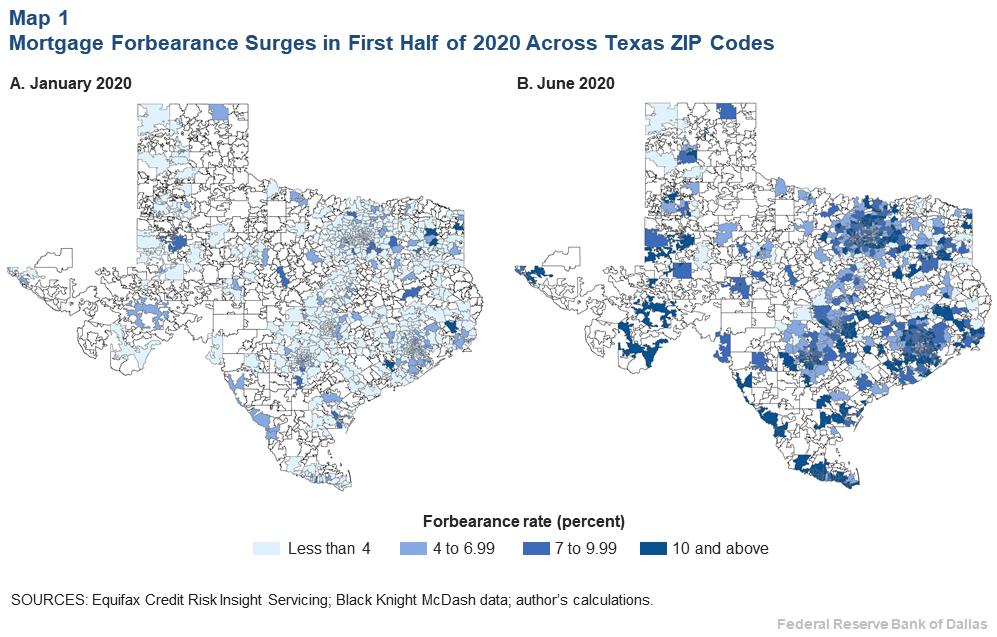
Forbearance rates grew in those five months for 88 percent of ZIP codes in Texas for which we have data.[4] The largest estimated jumps occurred in the Dallas–Fort Worth–Arlington (DFW) and Houston–The Woodlands–Sugar Land (Greater Houston) metropolitan statistical areas (MSAs) as well as the Lower Rio Grande Valley.[5] There were also large increases in San Antonio, Odessa and Tyler. In June 2020, several neighborhoods in Texas had forbearance rates of 20 percent or greater. While a few were scattered in more rural areas, many of those with high forbearance rates were concentrated in the Houston and Dallas metropolitan areas.
Forbearance rate still elevated in August 2021
We would expect that as the economy recovers, more and more households would exit forbearance. Indeed, as shown in Chart 3, the estimated forbearance rate declines over time as fewer households enter and more exit. But in August 2021, the estimated forbearance rate was still about 5 percent, which is larger than the prepandemic rate.
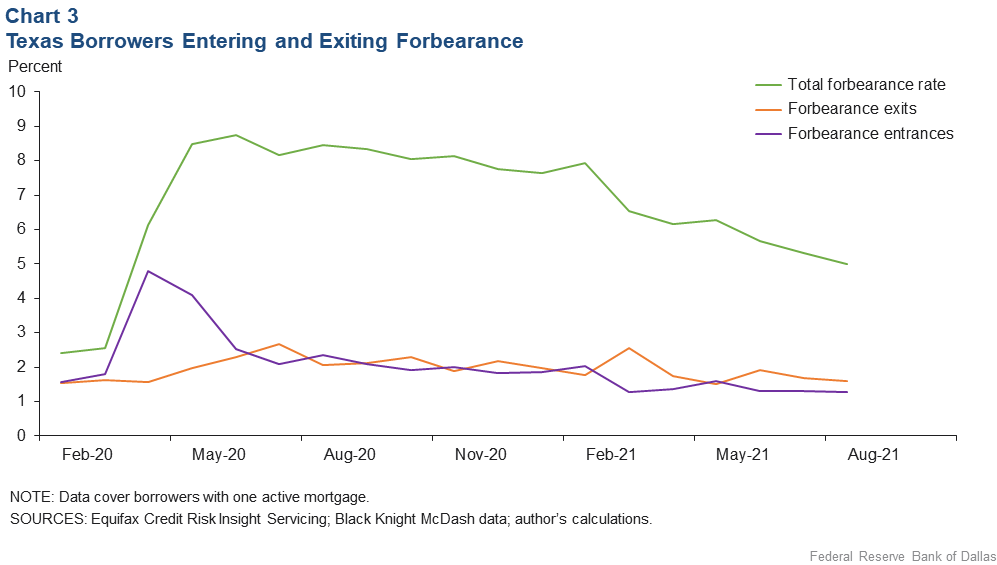
Remaining in forbearance likely indicates a lack of improvement in a household’s financial circumstances despite improving economic conditions at the state and national levels. As such, homeowners in forbearance in August 2021—whether new entrants or those who remained over many months—would tend to be more economically vulnerable.
Indeed, we did find evidence that those remaining in forbearance in August were more likely to have financial challenges. Texans with lower estimated incomes, higher debt-to-income ratios and lower FICO® Scores were significantly more likely to be in forbearance as of August 2021.[6] Additionally, mortgages in majority-minority neighborhoods were more likely to be forborne.
Across the state, most ZIP codes have reduced their forbearance rates since their peak in June 2020. But the rate of forbearance remains relatively high in some areas, and we find a correlation between the mortgage forbearance rate of a given ZIP code and its mortgage delinquency rate. These two indicators can help us estimate the vulnerability of a particular neighborhood to mortgage delinquency. We defined a vulnerable ZIP code as one that ranks in the top quartile of 1) mortgage forbearance rates in August 2021, and 2) Equifax delinquency rates in August 2021. These vulnerable ZIP codes are disproportionately concentrated in and around Houston, San Antonio, Dallas and the Lower Rio Grande Valley.
Several factors are statistically significant in predicting the likelihood that a given ZIP code is vulnerable. These include:
- Lower average FICO® Score.[7]
- Majority-minority neighborhood.[8]
- Higher share of unemployment insurance claimants in August 2021.[9]
We also tested the of share of low-income households in a ZIP code but found it was not significant when controlling for the other variables.
Maps 2A–D drill down to the MSAs with the largest share of vulnerable ZIP codes.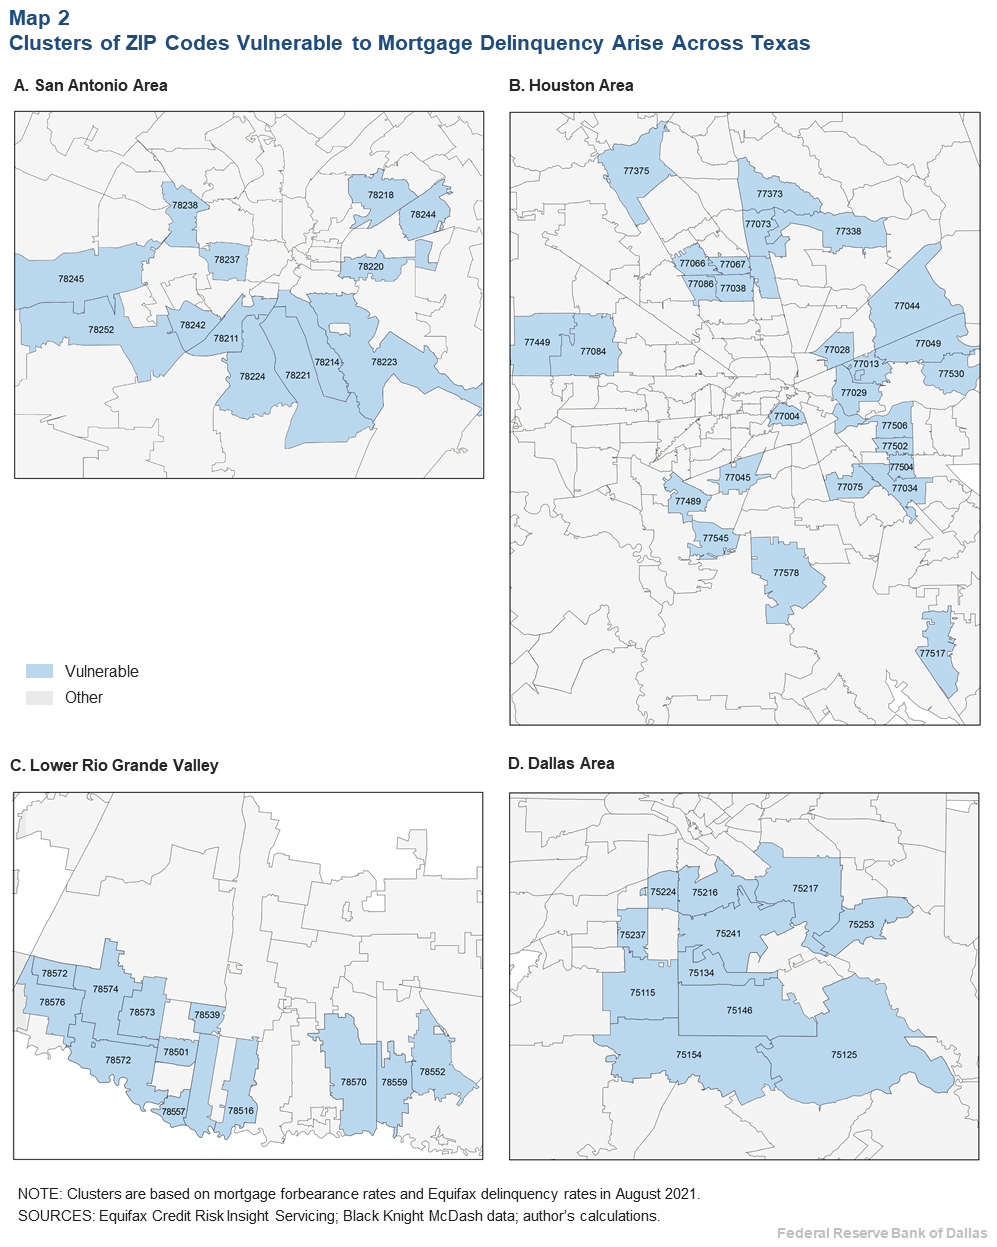
While the average forbearance rate in nonvulnerable ZIP codes is 4.4 percent as of August 2021, the average rate is twice that high at 8.9 percent in ZIP codes in vulnerable areas. Some locations stand out: In McAllen and Brownsville, the average forbearance rate is 10 percent. In the DFW region, two neighborhoods have rates around 15 percent: 75125 in Ferris and 75253 in Dallas. Within the vulnerable ZIP codes, southern Dallas County has three of the top 10 with the highest rates of forbearance.
In vulnerable ZIP codes, an additional 3.4 percent of mortgages not forborne are 30 or more days past due. This compares with an average delinquency rate of 1.8 percent for other ZIP codes. The share of delinquencies is as high as 10 percent in 78214, a ZIP code in southern San Antonio.
Other significant demographic differences exist between vulnerable and less-vulnerable ZIP codes. For example, the average share of people of color in vulnerable ZIP codes is 74 percent, versus 47 percent in less-vulnerable ones. Average FICO® Scores are 30 points lower in those we identified as the most vulnerable (674 versus 705).
Implications
It’s generally agreed that the economic relief package in the CARES Act greatly reduced what otherwise would have been a large increase in material hardship. But months have passed since the expanded unemployment benefits expired and the last stimulus checks were deposited, and forbearance has ended or is swiftly ending for homeowners.
In fact, taking extensions into account, forbearance options ended for most borrowers after Sept. 30, 2021. For homeowners exiting forbearance, there are typically several repayment options depending on the mortgage furnisher. These include loan modification plans and extension of the loan term, or a lump-sum repayment, although lenders are prohibited from mandating lump-sum repayment.
While economic recovery has been underway in Texas, the unemployment rate remains above prepandemic levels. Additionally, new research from the Dallas Fed explains that while unemployment was lower in Texas than the U.S. during the Great Recession, it has been higher during the pandemic since October 2020. Many factors may help to explain this difference, including racial unemployment disparities, particularly for Black workers.
As more mortgages exit forbearance, ZIP codes with larger vulnerability will be at particular risk for financial stress. With higher rates of delinquencies and forbearance, as well as more unemployment insurance claimants, these neighborhoods may be more susceptible to foreclosure in the coming months. It’s unclear what share of exiting borrowers may have trouble staying current after forbearance. It is also unknown if the foreclosure rate will increase given a 2021 Consumer Financial Protection Bureau ruling that limits the ability of servicers to initiate foreclosures until certain conditions are met.
In the meantime, understanding which Texas communities may be pockets of concern will allow policymakers, financial institutions and community-based organizations to target resources and programs toward the most vulnerable. While the COVID-19 pandemic widened disparities—across racial and gender groups and education levels, to name a few—more focused analysis and relief efforts can facilitate a more equitable recovery.
Disclosures
This analysis has several limitations. First, estimating forbearance rates using the differences between Equifax and McDash data is not a perfect measure. Delinquencies may not match for reasons other than forbearance. Secondly, due to data constraints, this analysis is restricted to homeowners with one mortgage. Homeowners with one mortgage, who represent about 85 percent of borrowers in our initial dataset, have an average FICO® Score of 712 at the time of origination, compared with borrowers with more than one mortgage, who have an average score of 728. Homeowners with more than one mortgage also had an average appraisal amount of $51,000 more than those with one mortgage. There was no difference between the two groups in terms of debt-to-income ratios. Still, the sample used in our analysis may be biased based on the exclusion of Texans with multiple mortgages. Finally, every homeowner in forbearance is not necessarily financially struggling. Because no proof of hardship was required, it’s possible some homeowners who had not suffered income losses at the time used their eligibility for the provision as a type of insurance in a climate of economic uncertainty. It’s difficult to assess the degree to which this scenario occurred, but research thus far suggests that this type of moral hazard was not very pervasive. For the purposes of this analysis, we assume that those who elected forbearance were indeed suffering from some kind of economic hardship brought on by COVID-19.
Notes
- The CARES Act first granted forbearance to borrowers for an initial period of 180 days, with an additional 180 days granted upon request. Subsequent extensions were issued, leading to a maximum forbearance period of 18 months for those who requested it by June 30, 2020.
- Although not covered by the CARES Act provision, homeowners with privately held mortgages were also often able to successfully request forbearance with their servicer on a case-by-case basis. In fact, in mid-2020, private mortgages were more likely to be in forbearance than federally backed mortgages. See “Millions of Americans Have Their Mortgages in Forbearance Programs—Here’s Why Those Using Private Lenders May Face Bigger Challenges,” by Megan Leonhardt, CNBC, July 15, 2020.
- If the borrower was delinquent on a mortgage prior to forbearance, the servicer would report the same delinquency status as was reported prior to forbearance.
- We restrict the sample to ZIP codes reporting at least 25 mortgages in a given month.
- The increases in forbearance were disproportionately large, controlling for the overall homeowner population.
- Each of these variables is significant at a 99 percent confidence level. The FICO® Score is the borrower’s credit score at the time of mortgage origination. For income, we use Equifax’s personal income model score. We also looked at the appraisal value of a borrower’s home, but it was not significant when controlling for the other factors.
- Average FICO® Score data are from Equifax Credit Risk Insight Servicing and Black Knight McDash.
- Data are from the 2019 American Community Survey, 5-Year Estimates, Census Bureau.
- The unemployment insurance claimants share data come from the Texas Workforce Commission UI Claimant Dashboard, ZIP code level.
About the author

Emily Ryder Perlmeter is a policy analyst in the Integrated Policy Department at the Federal Reserve Bank of Dallas. She was formerly a senior advisor in the Community Engagement and Development Department.