
Is federal broadband funding going to states that need it most?
Digital connectivity is important for everyone to gain access to productivity and life-improving technologies. As we march into the era of generative artificial intelligence and the acceleration of fintech for businesses and personal banking, digital inclusion (DI) becomes an increasingly important topic for community development and economic inclusion. The Infrastructure Investment and Jobs Act (IIJA), also commonly referred to as the Bipartisan Infrastructure Law (BIL), aims to upgrade and expand infrastructure in the U.S., ensuring every American has access to broadband.
This article compares the IIJA’s DI funding with existing broadband access at the state level. We conclude that states with high broadband gaps received the most funding per capita. Still, there are concerns about factors other than population, such as geographic distance, that may also affect the total cost of broadband infrastructure. A public-private partnership and potentially larger funding might be required to secure the deployment of high-quality internet for all.
Connectivity understanding limited by data challenges
IIJA provides $65 billion for broadband investments through a series of grant programs.
While the IIJA funding is broad-based, the lack of consistent and accurate data on broadband gaps remains a problem. To fund broadband improvement, grant program managers need to understand where connectivity is lacking and why. And while there are a number of datasets that seek to address those questions, each has troubling flaws. This poses problems for the federal programs, as well as the community leaders trying to show the needs in their own areas.
There are three commonly used sources of data, the Federal Communications Commission (FCC), the connectivity data company Ookla and the Census Bureau’s American Community Survey (ACS), each with its advantages and disadvantages. We draw from all three types of data and try to come up with an informative, state-level broadband gap assessment.
The FCC data are provided by the internet service providers. While this dataset is the most comprehensive of the three, it may not reflect the experienced connection speed, rather the providers’ intended level of connectivity for the area. The data are frequently challenged and revised, and the degree of inaccuracy in rural areas is larger than in urban areas. The burden of challenging the FCC map often falls on local residents.
Ookla is a corporation that collects internet speed information using a tool it developed, Speedtest, a widely used free testing app. In contrast to the FCC data, this is a dataset that reports the experience of broadband users. The test data are then processed by Ookla to reflect area averages. Ookla has the advantage of reflecting actual user experience, but all of that user experience comes from voluntary usage, which may bias the data to those with the devices and inclination to use Ookla. For example, the area must have basic internet connection for users to access the test, and tests are also more likely to take place when users are troubleshooting. So, the data could be overlooking zero-coverage areas and over-emphasizing internet issues.
The third dataset comes from the Census Bureau’s American Communities Survey (ACS). It is more consistent and unbiased compared to the other sources, but the survey does not ask about broadband speed, just its presence. So, the results lack meaningful evaluation of the quality of the broadband that the two other datasets cover. The ACS does not survey group quarters, which are non-family-based residences such as student dorms and nursing facilities. The survey also does not measure broadband coverage in workplaces as the other two sources do.
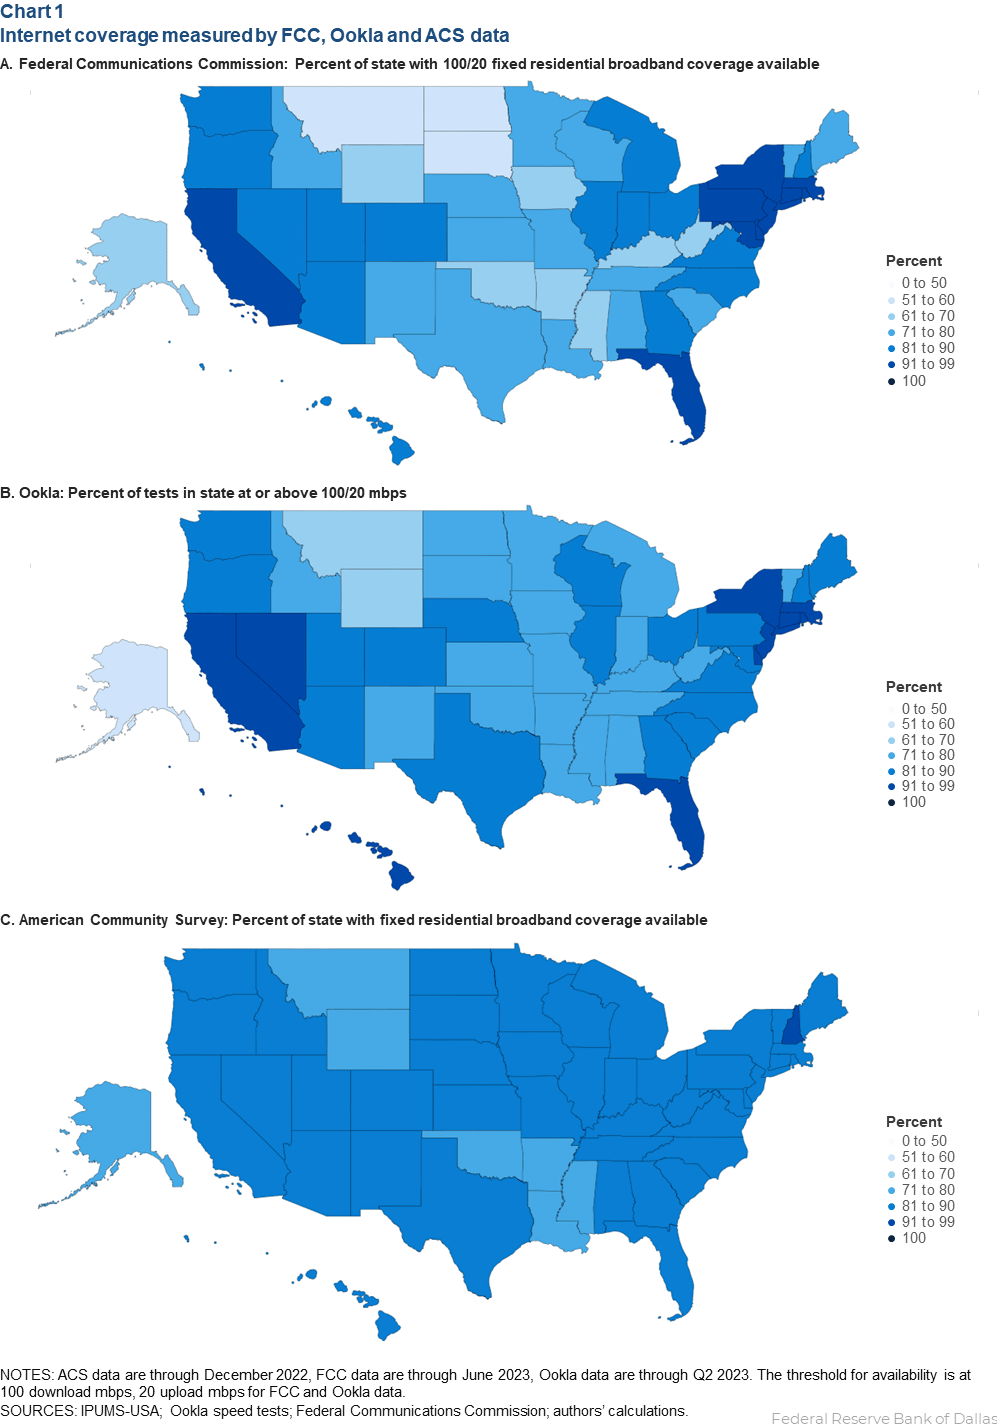
All measures are the percent of state population with access to quality fixed broadband internet. For the FCC and Ookla data, this implies the locations pass the 100/20 megabits per second (mbps) connectivity threshold, while the Census ACS measures the presence of broadband internet in residential homes.
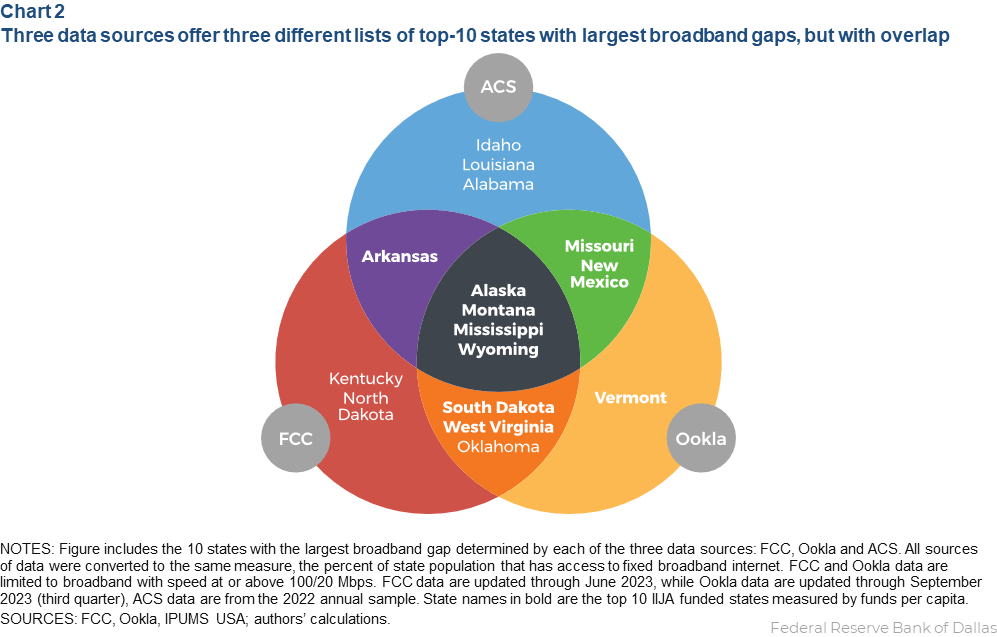
To summarize all three measures into one, we examine the overlap and disparities across the three measures. Comparing the top 10 states with the greatest demand for broadband based on each dataset, only four states are on all three lists: Montana, Mississippi, Alaska and Wyoming. There is also some overlap among states that appear on two of the three lists. This means using any source independently could lead to a different and potentially biased understanding of the connectivity levels across states. And despite some overlap in ranking, the FCC and Ookla measures of 100/20 mbps coverage are negative 10 to positive 20 percentage points apart with an average discrepancy of 5 percentage points per state. With that said, the synthesized state ranking we use in the follow section, which captures the commonalities in all three measures of state broadband gap, is the best measure to the authors’ knowledge.
IIJA funding intensity generally matches demand
Are the states with the highest broadband demand receiving the most funding? Mostly yes, but there are some inconsistencies, too. IIJA offers six grant programs to expand broadband infrastructure, adoption and use. The funds are distributed to states and households through application and allocation processes.
- Broadband Equity, Access and Deployment Program (BEAD)
- Digital Equity Planning, Capacity and Competitive Grants
- Tribal Broadband Connectivity Program
- Rural broadband programs at the Department of Agriculture
- Middle Mile Grant Program
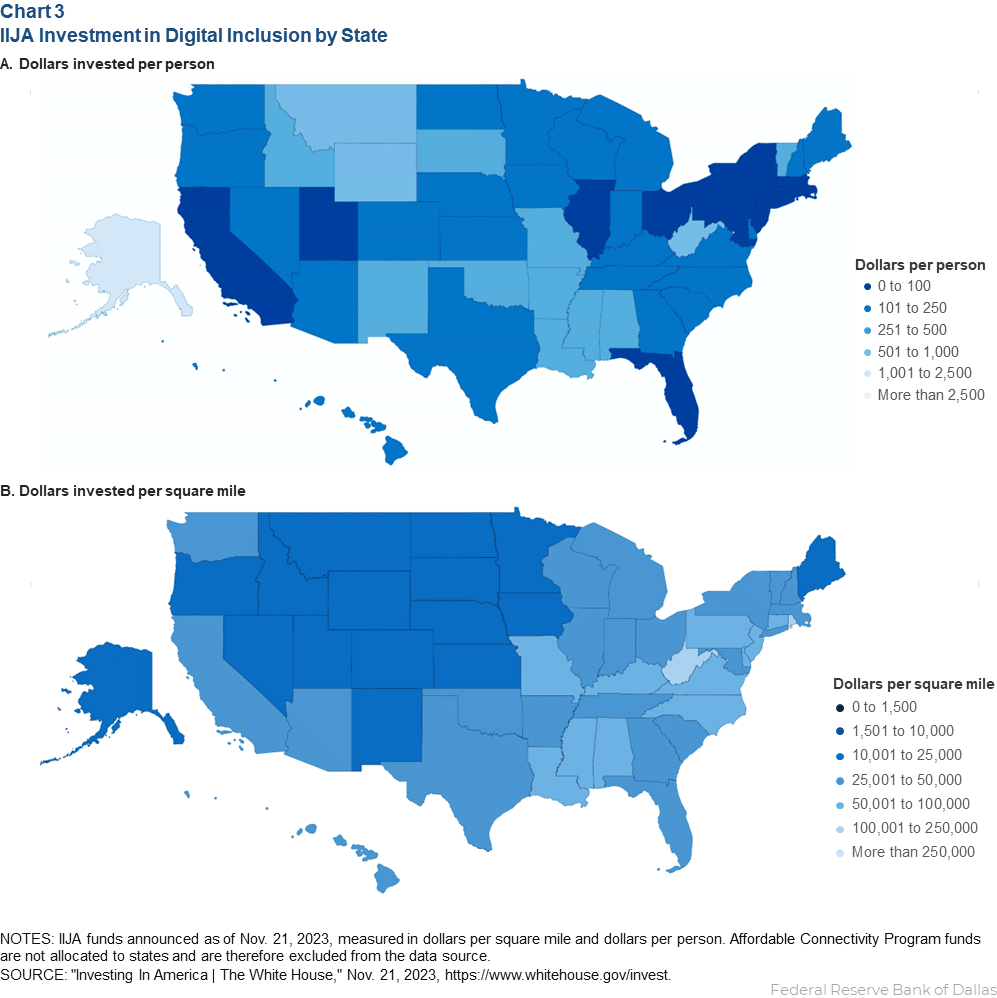
- Affordable Connectivity Program (ACP), the only household-based grant on this list. This program is not a state grant, and we will discuss it further in part two of this series. To compare state internet demand with IIJA funding, Chart 3 plots the total IIJA funds distributed and announced as of Nov. 21, 2023. The original dataset includes a full list of announced funds but does not include undistributed and unannounced funds. We identified all broadband funds in the data, aggregated to the state level.
We illustrated two measures of the funding: total funding per capita and funding per square mile. The total cost of broadband infrastructure is affected by the size of the population, but also by the size of the geographic area that needs coverage. So, we supplement the first measure with the second one.
The top 10 states for per capita IIJA funding are: Alaska, Montana, West Virginia, Wyoming, New Mexico, Mississippi, Vermont, Arkansas, South Dakota and Missouri. The list is a close match to the list of states that our synthesized broadband gap measure showed had the greatest need for broadband connectivity.
Is IIJA funding consistent with connectivity gaps?
Overall, funding is highly aligned with broadband gaps. Combining information in Charts 1 and 3, we highlighted the top funded states in Chart 2. The only state that is on more than one top-demand list but does not make it into the top 10 list for IIJA funding is Oklahoma. But it did not miss by a lot; Oklahoma ranks No. 12 among the top funded states.
That alignment is encouraging, but it doesn’t address a challenge many rural areas struggle to overcome. Funding per capita does not account for the variation of the geographic spread of a state’s population. As shown in Chart 3, the funds per square mile can look very different from the funds per capita. Given the lack of density in rural communities, estimates to connect remote locations range from $50,000 to $300,000 per household. These investments are hardly profitable, and therefore require private-public partnerships.
It is also estimated that the total cost of deploying a high-quality national infrastructure is more than double the amount of the current IIJA funding. A report by Cartesian, a telecommunication consulting firm, calculated that the current IIJA funding might be able to support 100/20 mbps internet deployment, but to address the forward-looking needs of national infrastructure (estimated at 100/100 mbps) costs approximately $106 billion to $179 billion, more than double the federal funding allocated.
Upcoming
Part 2 of this series dives into the details of each grant category in the IIJA program and sheds light on the reasons behind the grant variations across states through the lens of the states in the Eleventh District, New Mexico, Louisiana and Texas.
About the authors

Marycruz De Leon is a manager in Community Development at the Federal Reserve Bank of Dallas.

Kassandra Huhn is an outreach advisor in the El Paso Branch of the Federal Reserve Bank of Dallas.

Prithvi Kalkunte is an economic programmer in the Research Department at the Federal Reserve Bank of Dallas.

Xiaohan Zhang is a senior research economist and Community Engagement and Development research lead at the Federal Reserve Bank of Dallas.