A Perspective on Oil
June 19, 2018
U.S. crude oil production is estimated to have grown from 5.1 million barrels per day in May 2008 to approximately 10.6 million barrels per day in May 2018.[1], [2] As a result of this growth, the U.S. now represents approximately 13 percent of global crude oil production, up from 7 percent 10 years ago. Improvements in shale oil drilling and completion techniques have been a critical element of this growth, with much of the new production occurring in Texas as well as North Dakota, New Mexico, Oklahoma and Colorado.[3] While the U.S. continues to be a substantial crude oil importer, the shale boom has allowed our country to substantially reduce the percentage of petroleum product consumption that is supplied by imports.
Dallas Fed economists focus on energy market dynamics because of their implications for oil prices, which in turn, affect U.S. gross domestic product (GDP), employment and inflation. As we’ve seen in past economic cycles, changes in oil prices particularly impact consumer spending and input costs for businesses, as well as capital investment and job creation in energy-producing regions of the U.S.
Given the importance of oil to the U.S. and global economies, the Dallas Fed has assembled an experienced team of energy economists, created key industry surveys and built relationships with industry executives in order to build a deep understanding of the energy industry and global energy markets. In the fall of 2017, we created an Energy Advisory Council to more systematically build our insights into energy market trends and developments. Through these various channels, we seek to gain insights that are critical to our understanding of the impact of energy market developments on economic conditions and their implications for monetary policy in the U.S.
While this essay focuses primarily on oil, Dallas Fed economists also focus on understanding renewable energy sources. As discussed in recent Dallas Fed publications, Wind Power a Growing Force in Oil Countryand Texas Has ‘All-of-the-Above’ Energy Approach, Texas is the nation’s largest producer of wind-generated electricity.[4] In the years ahead, we expect renewables such as wind and solar power to comprise a larger percentage of the nation’s energy mix. However, even with substantial growth in renewables, it is expected that fossil fuels will comprise approximately 77 percent of global energy use in 2040 (as estimated by the U.S. Energy Information Administration).[5]
Background
Dallas Fed economists believe that global oil supply and demand are now in relative balance. First quarter 2018 estimates indicate that global average oil production was approximately 98.3 million barrels per day and global consumption was approximately 98.4 million barrels per day.[6] These estimates incorporate the December 2016 agreement made by the Organization of the Petroleum Exporting Countries (OPEC) and other oil-producing countries to cut crude oil production by approximately 1.8 million barrels per day.
Recently, OPEC and other oil-producing countries have discussed restoring some of this crude oil production cut. In the short run, such a restoration of production might help offset expected production outages from countries such as Venezuela and Iran. However, in the medium term, Dallas Fed economists continue to believe that, due to expected growth in daily global demand, the trend of global supply/demand is fundamentally toward balance.
Oil supply is substantially comprised of three main segments: crude oil, natural gas liquids and biofuels.[7] It is our view, based on Dallas Fed analysis, surveys and discussions with industry contacts, that U.S. crude oil production will grow by more than 1 million barrels per day in 2018 and exceed approximately 11.2 million barrels per day by year-end. In addition, we expect U.S. production of natural gas liquids of approximately 4.5 million barrels per day and production of biofuels of approximately 1.2 million barrels per day by year-end 2018.[8]
In terms of crude oil production, only Russia, which currently accounts for approximately 11 million barrels per day, produces more than the U.S.[9] By comparison, Saudi Arabia currently produces approximately 10 million barrels of crude oil per day, having cut approximately 0.5 million barrels per day from its crude oil production as a result of the OPEC agreement.
Dallas Fed economists estimate that by year-end 2018, the U.S. will consume approximately 20.6 million barrels per day of oil. Our economists believe that, over the next several years, the U.S. will continue to increase its oil production, while consumption growth is expected to flatten due to energy efficiency gains as well as greater use of natural gas and renewable energy sources to meet energy demand.
Global oil markets face a number of uncertainties and challenges. How these issues unfold will likely have implications for energy prices as well as economic conditions and monetary policy in the U.S.
Key Issues and Challenges
Reduction in Spending on Long-Lived Projects
One potential issue facing the global oil market is the recent decline in capital investment in long-lived exploration and production (E&P) projects. Historically, major oil companies have allocated substantial portions of their capital expenditure budgets to these long-lived investments. These investments have included deepwater and ultra-deepwater offshore wells,[10] Arctic drilling and oil sands production. These projects typically cost hundreds of millions to billions of dollars to complete, take several years to build and have useful lives in excess of 20 years. These projects are important to global energy markets because they fundamentally increase medium- and longer-term global oil supply.
As Chart 1 indicates, since 2014, major oil companies have reduced their capital expenditures relating to long-lived projects. As a consequence of several years of lower investment spending on these projects, the global energy market has increased its dependence on future production growth from shale oil.
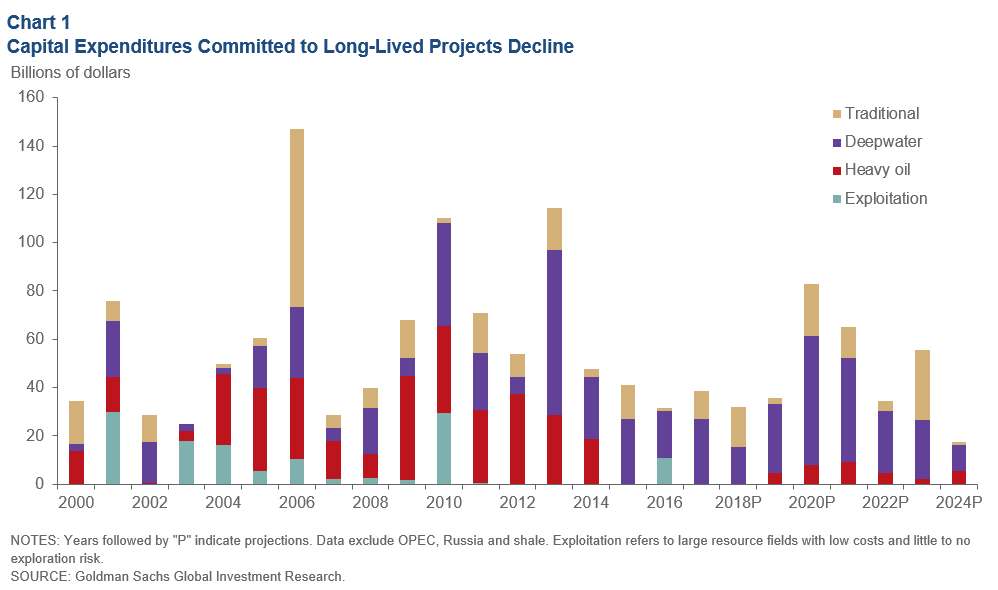
Shale production has the benefit of being more financially manageable and operationally nimble. However, shale wells typically have very rapid production decline characteristics (discussed below). Specifically, a shale project is a much more “short-cycle” investment than a typical conventional project—it can be drilled and brought onstream very quickly and, on average, for approximately $6 million to $8 million per well. However, because of its rapid production decline features, shale requires additional and continuous investment in order to maintain production levels.
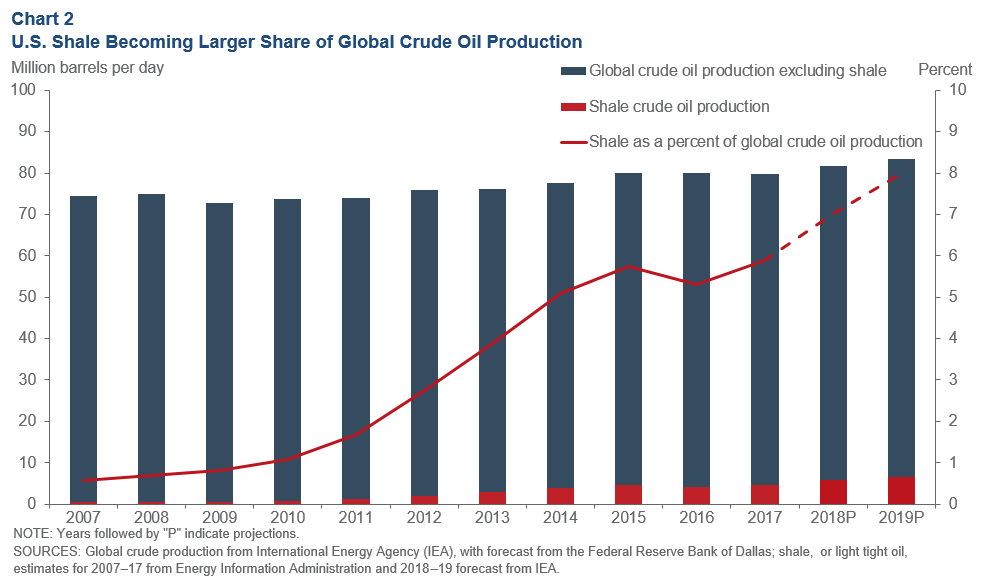
Chart 2 shows the growth in shale crude oil output in the U.S. Less than 10 years ago, U.S. shale produced approximately 0.5 million barrels per day, or less than 1 percent of global crude oil production.[11] In 2017, U.S. shale produced approximately 4.7 million barrels per day and made up approximately 6 percent of global crude oil production. As shale makes up an increasing percentage of global crude oil supply, the challenge will be to find ways to increase shale well productivity, overcome input shortages and ramp up production to meet incremental global demand growth.
Growth in Global Demand
Demand for oil grew from an average of 90.4 million barrels per day in 2012 to approximately 98.4 million barrels per day in the first quarter of 2018.[12] Much of this growth has come from emerging-market economies, particularly China, India and countries in the Middle East region (see Chart 3 for analysis of global demand growth).
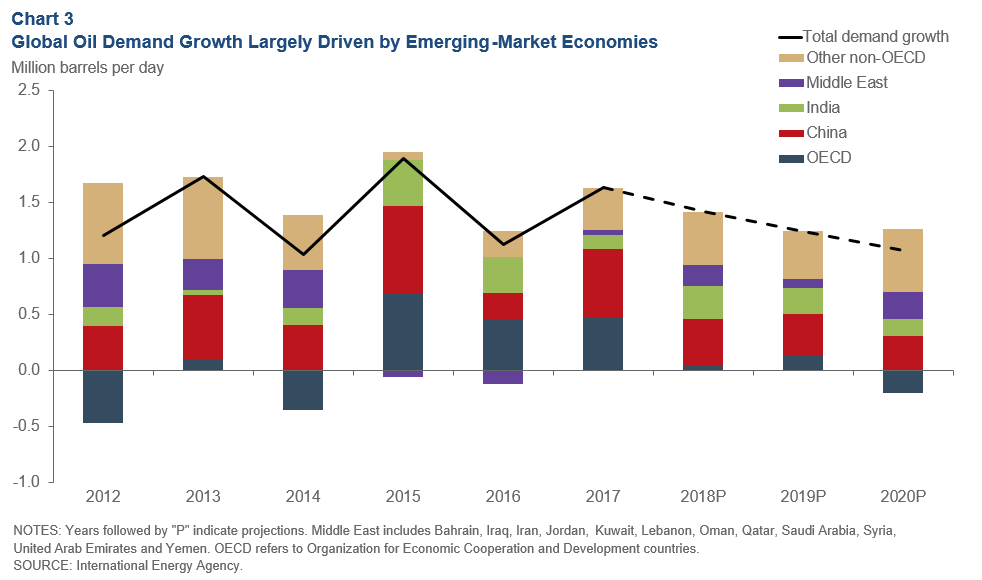
It is estimated that global oil demand is likely to increase from an average of 98.4 million barrels per day in the first quarter of 2018 to approximately 101.5 million barrels per day by 2020. World Bank and International Monetary Fund projections suggest that global demand growth will continue to be driven primarily by emerging-market economies.
This forecast rate of global demand growth (approximately 1.1 million to 1.5 million barrels per day) should provide a strong underpinning for global energy markets and the resulting price of oil. The challenge will be producing enough oil to meet demand growth over the next three to five years.[13]
Impediments to Growth of U.S. Shale Oil Production
While estimates for growth of U.S. shale vary among industry observers, our contacts believe that U.S. shale production should be sufficient to supply a substantial portion of incremental global demand growth for the next few years. However, our industry contacts are concerned about key production impediments that have the potential to limit the ability of shale to supply incremental global demand growth beyond that time frame.
While there are a number of shale formations across the U.S., the most prolific is the Permian Basin, a geologic area rich in oil and gas that is 250 miles wide and 300 miles long across West Texas and eastern New Mexico. The Permian was responsible for approximately 63 percent of U.S. crude oil production growth in 2017, far outpacing the next-most-prolific U.S. shale formation, the Bakken in North Dakota and Montana (which accounted for approximately 18 percent of U.S. crude oil production growth).[14]
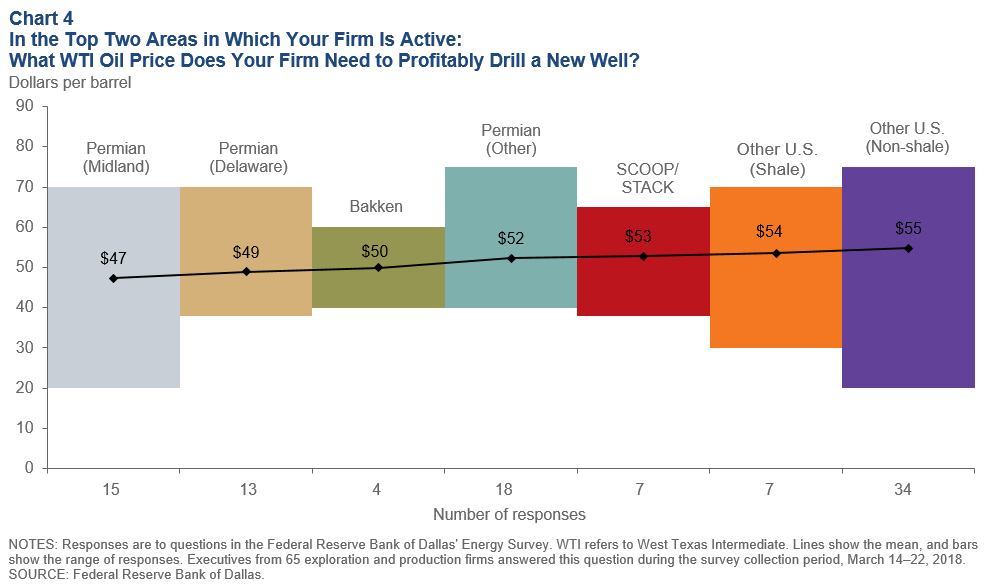
Industry contacts cite the Permian’s advantage over other areas due to its multiple layers of thick shale rock, the quality of the oil and the relatively close proximity to refiners, export terminals and pipelines. The March 2018 Dallas Fed Energy Survey indicated that the Midland Basin portion of the Permian appears to be more economically attractive than other shale formations, on average, as shown in Chart 4. However, several of our industry contacts suggest that the Delaware Basin has attractive drilling characteristics that are as compelling as the Midland Basin’s.
As West Texas Intermediate (WTI) oil prices have remained above $60 for most of 2018, drilling outside the most attractive portions of the Permian has become more economically appealing for E&P companies. These areas include the Bakken, parts of the Eagle Ford in South Texas and most of the SCOOP/STACK in Oklahoma. If prices persist at current levels, industry contacts expect to see oil companies more aggressively expand their production activities beyond the Permian Basin.
As mentioned above, our Dallas Fed industry contacts believe that there are a number of challenges to continued robust growth in shale crude oil production in the medium term. The most significant potential challenges are described below.
1. Rapid production decline curve of shale.
The primary method for drilling wells in shale-rock formations is known as horizontal drilling—where a well is drilled vertically (averaging approximately 10,000 feet) before being guided horizontally through the rock (averaging a distance of between 5,000 and 10,000 feet). Although a highly effective method, horizontal wells often reach peak crude oil production in the first few months, with output declining rapidly thereafter, sometimes as much as 80 percent after one year. As a result, in order to grow overall crude oil production, more wells must be drilled and well productivity must be boosted substantially. While companies are drilling more wells this year to overcome this decline curve, they face constraints regarding labor, input costs, infrastructure and the return requirements of capital providers.
2. Shortages of labor.
Dallas Fed industry contacts report that the oil and gas industry in the Permian Basin faces a shortage of workers. Our contacts note that industry service companies are facing higher levels of turnover as workers either leave for higher pay at competitors or leave the industry due to the highly strenuous working conditions. In addition, companies report finding it difficult to attract previously laid-off workers back to the industry. Bureau of Labor Statistics data indicate that layoffs during the oil price decline of 2014–15 resulted in an estimated loss of one-third of the workforce,[15] and industry contacts report that many workers either are reluctant to return to the industry or need significant financial and/or job security incentives to return given the boom/bust nature of the industry.
While the oil and gas industry has become more efficient, drilling and completing wells is still a labor-intensive endeavor. The oil production sector has added more than 40,000 jobs in Texas and more than 60,000 jobs in the U.S. from December 2016 through April 2018, and high demand for workers has led to significant wage pressures. Our Dallas Fed Energy Survey shows that energy companies based in the Eleventh Federal Reserve District (which includes Texas, northern Louisiana and southern New Mexico) increased wages and benefits throughout 2017 and have been accelerating this pace in 2018.
Labor shortages are particularly acute in the Permian Basin. The May 2018 unemployment rate in Midland, Texas, the heart of the Permian, was 2.2 percent.[16] Housing is also in short supply in the Permian Basin, and companies have again resorted to using temporary housing structures for their workers. House prices in Midland have risen substantially since 2016, and housing inventories are estimated at one month of supply.[17]
3. Raw material, environmental and infrastructure challenges.
Water and sand are key inputs used in shale production, accounting for 30 to 35 percent of the cost of drilling and completing a well.[18] Contacts report that sand costs have increased substantially during the past 12 months. Specifically, increasing volumes of sand used in well fracking are creating strains on infrastructure in the region (10,000 tons of sand per well is not uncommon, requiring 100 railcars or 400 truckloads for transport).
In addition, water availability has become more of a logistical and financial challenge. As operators pursue larger well-completion projects and often operate on multiple well pads, the need for more advanced planning to arrange for water-supply logistics is becoming a more significant challenge. Another concern is water disposal. While companies often source water used in fracking from an underground aquifer in the Permian, operators cite greater concerns regarding the disposal of wastewater that is produced as a byproduct of oil. On average, three to five barrels of water come out of the ground for every barrel of oil that is produced.[19] This water must either be transported to an approved saltwater disposal well, further straining transportation infrastructure, or recycled and used as frack water—a process that is generally considered too expensive for most operators.
Several industry contacts and other observers have cited their concerns regarding water and air pollution, wastewater management and other issues relating to emissions of greenhouse gases. These are critical issues which state as well as federal regulatory agencies must actively monitor and are important operating considerations for firms participating in this industry. Several of our contacts, and industry observers, have discussed the critical need for proper safeguards in order to prevent degradation of water and air quality, and loss of land use.
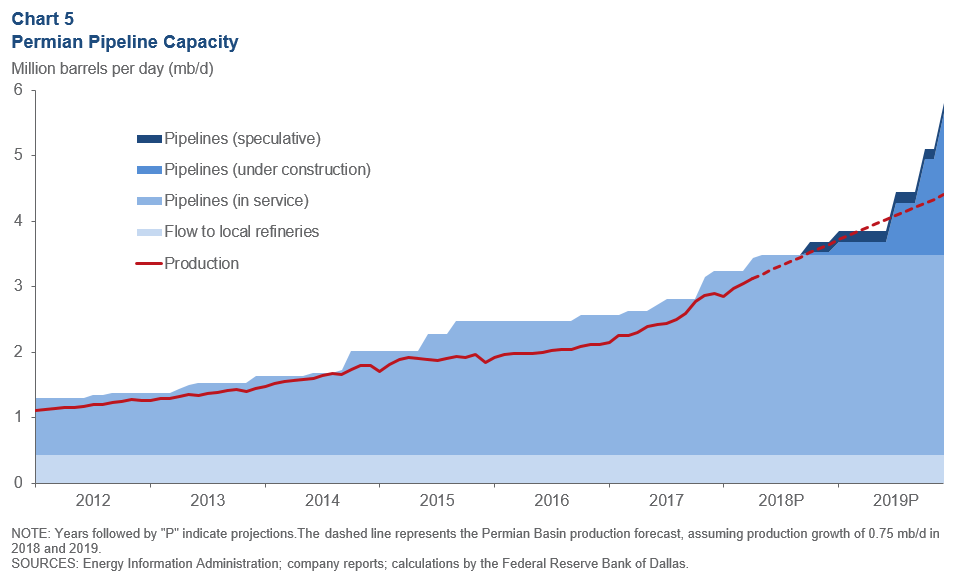
In the Permian, oil and natural gas pipeline capacity—used to transport oil and natural gas to refineries and processing plants hundreds of miles from the well site—remains a potential problem in 2018 and 2019. Our expectation is that oil pipeline capacity will become very tight late in 2018 and early 2019, as shown in Chart 5, and possibly sooner if production surprises to the upside or pipelines and refineries experience unforeseen downtime. However, the pipeline bottlenecks should be alleviated in the second half of 2019 as new pipelines come onstream.
4. Capital discipline exerted by equity owners.
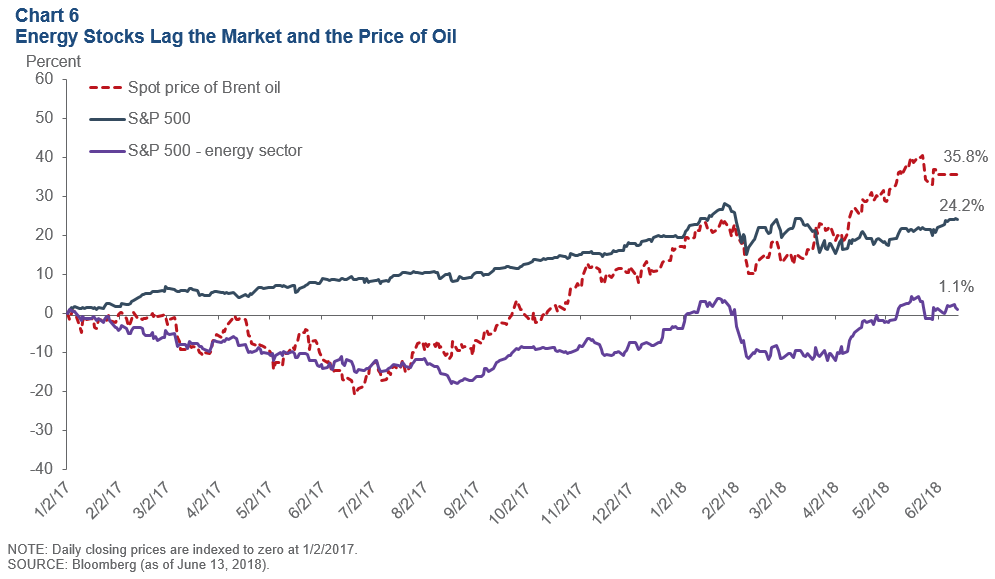
Energy executives report that public-market capital providers are much more focused on capital discipline from oil and gas companies. From January 2, 2017, through June 13, 2018, energy stocks increased only 1.1 percent, while the price of oil and the S&P 500 increased 35.8 percent and 24.2 percent, respectively, as shown in Chart 6.[20]
As a result of this underperformance, industry contacts report that capital providers are increasingly pressuring management teams to increase their focus on achieving higher rates of return, rather than focusing primarily on increasing overall production levels. Contacts report that this capital-discipline focus is causing many boards of directors to revise incentive structures and compensation arrangements for company management teams. It may also have the impact of encouraging some independent production companies to more proactively consider mergers and other actions that increase scale and improve operating margins.
Production Outages and Geopolitical Risks
A large percentage of global oil production is in politically unstable areas of the world, and political and military conflict as well as governance challenges have given rise to oil supply disruptions in the past several years. These disruptions (or “supply shocks”) have the potential to cause a rise in oil prices in the short term.
Some of the more significant disruptions in recent years have occurred in Venezuela, Libya and Iran. Daily Venezuelan crude oil production is estimated to have fallen by 1.1 million barrels since 2013 and is continuing to decline.[21] Libya has experienced civil strife since the fall of Gaddafi. After declining from a high of 1.6 million barrels per day in January 2011 to zero in August 2011, Libyan crude oil production moved back up to roughly 1.0 million barrels per day in May 2018. Iran has seen its crude oil production increase by approximately 0.8 million barrels per day following the removal of sanctions in 2016. However, the recent U.S. withdrawal from the Iran nuclear agreement has the potential to reduce Iranian exports and crude oil production.
In a global market that is in relative oil supply/demand balance, supply outages due to geopolitical events have the potential to cause sporadic episodes of spikes in oil prices.
Implications for Energy Markets
Dallas Fed economists and our industry contacts increasingly are of the view that we have gone from a global oversupply situation (2014 to mid-2017) to one currently of relative balance (taking into account OPEC supply restrictions). Over the next few years, we believe that global oil markets will be in a “fragile equilibrium” in which demand growth should likely be met in large part by growth in U.S. shale oil production. This, of course, assumes no new material disruptions from major oil-producing countries in the Middle East or other producers such as Russia, Nigeria or Venezuela.
However, given the current lack of investment in long-lived production projects, and assuming global oil demand continues to grow between 1.1 million and 1.5 million barrels per day,[22] we would expect future world consumption growth to be more dependent on shale production growth. Due to the potential impediments described above, there is a growing likelihood of an eventual global undersupply situation in which shale will be unable to keep up with demand growth. Industry contacts acknowledge that higher oil prices could well induce producers to find ways to overcome these potential impediments.
In particular, some industry participants are hopeful that this situation could be mitigated by continued technological innovation in shale production and increases in OPEC production, as well as greater future investment in long-lived projects such as oil sands production in Canada and offshore drilling. In general, industry contacts emphasize that higher oil prices certainly have the potential to make these mitigants more likely to occur.
Overall, given our forecast and the potential impediments to substantial growth in shale oil production, we believe global oil markets are likely to be more vulnerable in the medium term to geopolitical shocks and disruptions that would create a potential for price risk to the upside.
A More Muted Impact of Higher Oil Prices on the U.S. Economy
Increases in oil prices can be caused by higher-than-expected demand (so-called “demand shocks”) from a stronger global economy or from unexpected reductions in supply (so-called “supply shocks”), such as those resulting from certain types of geopolitical events. Today, Dallas Fed economists believe that the recent run-up in oil prices is due to a combination of both demand and supply factors.
Historically, recessions in the U.S. have often followed oil price shocks. Higher oil prices tend to increase costs to consumers, which can, in turn, reduce their disposable income and consumption of non-oil goods and services. For example, Dallas Fed analysis indicates that every dollar increase in the oil price leads to a 2.4 cent increase in gasoline prices—all other factors staying the same—which over the course of a year would amount to approximately $3.4 billion in additional expenditures on gasoline.[23] Oil price increases also tend to cause firms to experience higher energy, shipping and input costs.
Over time, several factors have mitigated the impact of higher oil prices on the U.S. economy. The emergence of U.S. shale is one factor, as increased domestic production means that a larger share of the economy is helped by higher oil prices. Reduced crude oil imports also benefit our trade balance.
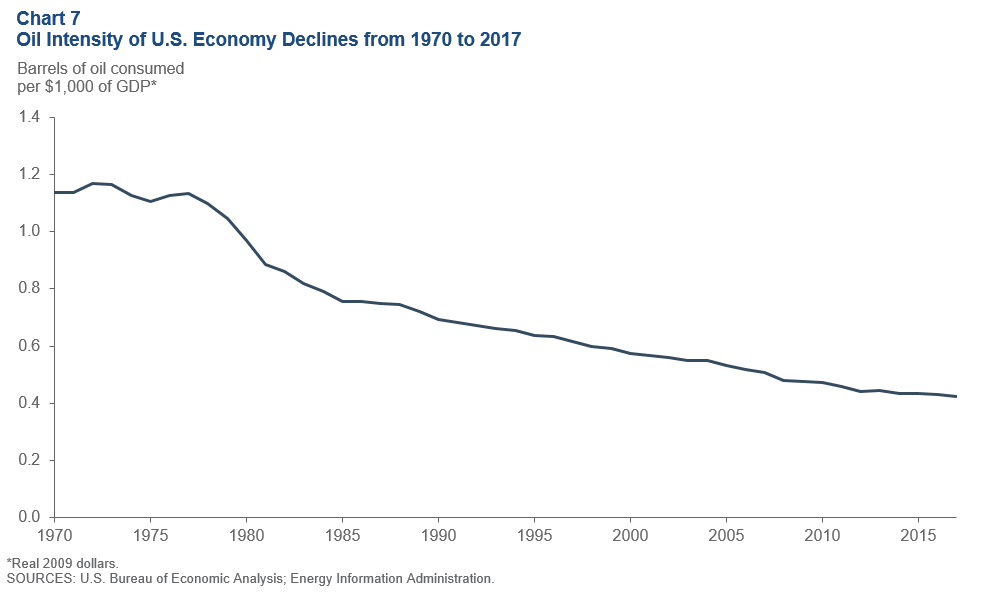
Finally, as shown in Chart 7, the U.S. economy is less oil-intensive than in the past due to substitution for oil by other forms of energy, improved fuel efficiency and growth in the less-energy-intensive services sector as a share of the overall economy. For example, in 1970, the U.S. consumed 1.1 barrels of oil for every $1,000 of GDP; by 2017, only 0.4 barrels of oil were consumed for every $1,000 of GDP.[24]
Based on these various factors, it is the view of Dallas Fed economists that the negative impact of higher oil prices on GDP growth is likely to be more muted than in the past. It is our view that a 10 percent increase in the oil price should have a relatively modest negative impact on U.S. GDP growth.[25] This negative impact should further diminish as the U.S. continues to grow its domestic oil production.
Understanding Evolving Oil Market Dynamics
The purpose of this essay has been to lay out the key factors the Dallas Fed closely tracks in analyzing the global energy markets and in considering the impact of oil prices on economic conditions in the U.S. Like any dynamic market, the oil market can be unpredictable, and key elements are often shifting, which can have profound impacts on global supply and demand. Given the importance of oil to the U.S. and global economies, our Dallas Fed research team is highly focused on understanding these market dynamics and determining their implications for GDP, unemployment and inflation in the U.S.
As discussed in this essay, Dallas Fed economists believe that the global oil market is now in relative supply/demand balance. Based on various factors discussed, it is our judgment that this market is likely in the years ahead to be more vulnerable to geopolitical events and other dynamics that could create price risks to the upside. As these dynamics unfold, we will continue to work with our industry contacts to better understand the oil market and its implications for monetary policy in the U.S.
Notes
The views expressed are my own and do not necessarily reflect official positions of the Federal Reserve System.
I would like to acknowledge the contributions of Tyler Atkinson, Jim Dolmas, Soojin Jo, Evan Koenig, Marc Giannoni, Kunal Patel, Michael Plante, William Simmons, Martin Stuermer, Kathy Thacker, Joe Tracy and Mine Yücel in preparing these remarks. In addition, I want to thank the members of the Dallas Fed Energy Advisory Council for their contributions.
- In this essay, when the term “crude oil” is used, it refers to crude oil and condensates. The term “oil” refers to crude oil, condensates, natural gas liquids and biofuels. Prior to being consumed, oil is refined into “petroleum products” such as motor gasoline, jet fuel, kerosene, diesel, residual fuel and other products.
- International Energy Agency (IEA).
- U.S. Energy Information Administration (EIA).
- As of June 2018. See note 3.
- Fossil fuels include oil (31 percent of global energy use by 2040), natural gas (25 percent) and coal (22 percent). See note 3.
- See note 2.
- See note 1.
- See note 3.
- See note 2.
- Deepwater wells operate in depths ranging from 125 to 1,500 meters; ultra-deepwater below 1,500 meters, according to the EIA.
- See note 3.
- See note 2.
- One other aspect that is less-frequently mentioned is a growing global demand for products known as middle distillates. Middle distillates consist broadly of jet fuel/kerosene, gasoil/diesel and heating oil—products that fuel emerging-market economies and international trade. Shale oil is a relatively light oil and does not yield as much middle distillate as heavier oils (from, for example, Middle East or Venezuela crude oils) in the refining process. As a result, refiners may have difficulty supplying sufficient quantities of middle distillates in the near term.
- As of May 2018. See note 3.
- See Bureau of Labor and Statistics, employment for oil and gas extraction and support activities for oil and gas operations.
- Data are from the Federal Reserve Bank of Dallas and Bureau of Labor Statistics as of June 2018.
- Data are from the Texas A&M University Real Estate Center as of June 2018.
- Barclays Research.
- Data for water in fuel production are from IFP Énergies nouvelles. See “Five Barrels of Water for One Barrel of Oil,” CNBC, Nov. 13, 2017, www.cnbc.com/advertorial/2017/11/13/five-barrels-of-water-for-one-barrel-of-oil.html.
- Data are from Bloomberg as of June 13, 2018.
- See note 2.
- See note 2.
- See note 3.
- U.S. Bureau of Economic Analysis and EIA.
- Our view takes into account a number of factors, including recent research estimates which suggest a roughly 0.1-to-0.3 percentage-point decline in U.S. real GDP growth in response to a 10 percent increase in the real price of oil due to an oil supply shock. See “Oil Supply Shocks and the U.S. Economy: An Estimated DSGE Model,” by Nathan S. Balke and Stephen P.A. Brown, Energy Policy, vol. 116, 2018, pp. 357–72; “Oil Supply Shocks, U.S. Gross Domestic Product, and the Oil Security Premium,” by Alan Krupnick, Richard Morgenstern, Nathan Balke, Stephen P.A. Brown, Ana María Herrera and Shashank Mohan, RFF Report, November 2017; and “On Oil Price Shocks: The Role of Storage,” by Deren Unalmis, Ibrahim Unalmis and Derya Filiz Unsal, IMF Economic Review, vol. 60, no. 4, 2012. See also “Are the Responses of the U.S. Economy Asymmetric in Energy Price Increases and Decreases?” by Lutz Kilian and Robert J. Vigfusson, Quantitative Economics, vol. 2, no. 3, 2011, pp. 419–53.
About the Author
Robert S. Kaplan was president and CEO of the Federal Reserve Bank of Dallas, 2015–21.