Opportunity Youth in Texas

Texas Picture
Texas is home to half a million opportunity youth. In 2017, its disconnection rate was higher than the national average, with 13.8 percent of the state’s 16–24-year-olds out of school and not working compared with the national share of 11.5 percent. This translates to 487,471 opportunity youth in Texas.
If Texas could lower its share of opportunity youth to the national average, thousands more young people could improve their economic outlook by furthering their education or contributing to the state’s economy by working. Such a reduction in the number of opportunity youth would save local, state and federal governments hundreds of millions of dollars over the lifetimes of these individuals.
Texas’ opportunity youth are diverse in terms of geography, race/ethnicity and gender. When considering how to best reengage opportunity youth throughout the state, these differences must be taken into account.
Geography
While several citywide, countywide and regional reconnection efforts are active throughout Texas, there does not appear to be a statewide initiative to address the issue of opportunity youth. This report focuses mostly on large urban areas that are working to reconnect these young people to school and work.
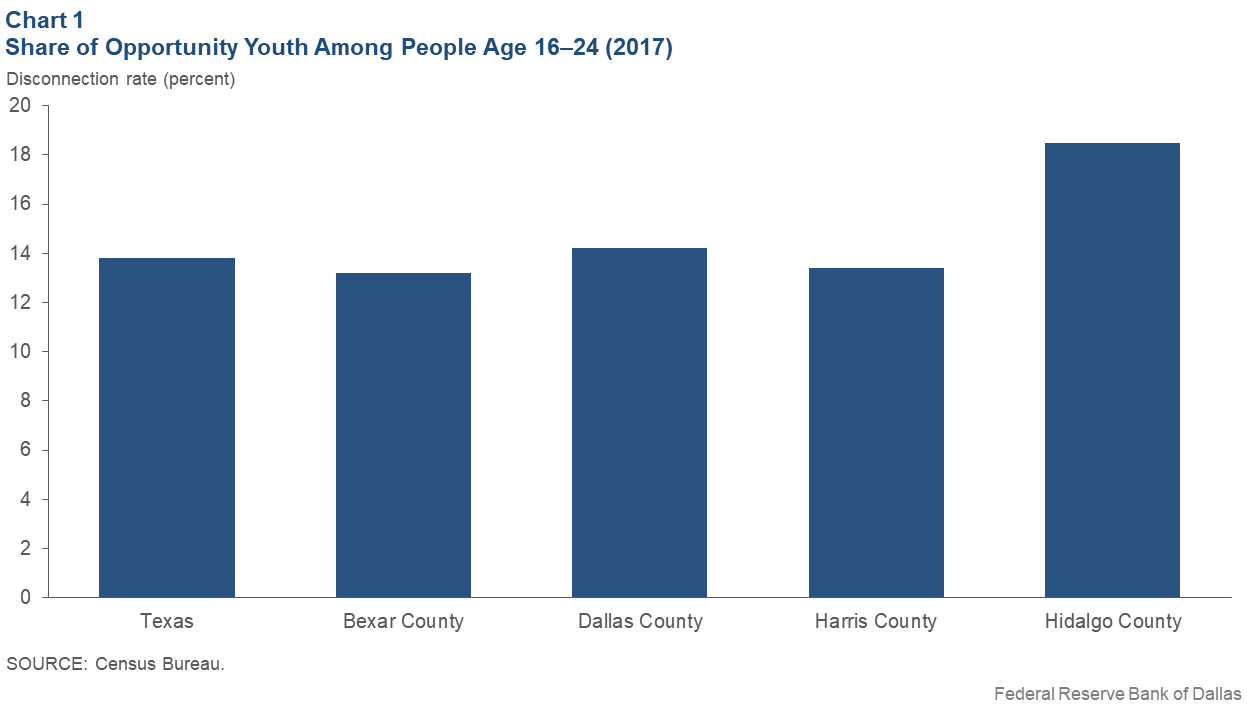
Three of the four counties profiled in this report—Bexar, Dallas and Harris—do not vary dramatically from the statewide disconnection rate of 13.8 percent (Chart 1). Bexar and Harris counties have lower rates at 13.2 and 13.4 percent, respectively, and Dallas County has a slightly higher rate at 14.2 percent. However, in Hidalgo County in South Texas—home to the cities of Edinburg and McAllen—the concentration of opportunity youth is much larger. There, the disconnection rate is 18.5 percent, representing 22,601 youth (see the “Data at a Glance” section of the report for fact sheets on opportunity youth in each of these counties).
According to Measure of America, an initiative of the Social Science Research Council, young people in rural areas are more likely to be disconnected than their urban and suburban counterparts.[6] While this report does not fully explore opportunity youth in rural Texas, it is important to recognize that rural areas need services for disconnected youth as well (see the sidebar “Opportunity Youth: It’s Not Just an Urban Issue”).
| Opportunity Youth: It’s Not Just an Urban Issue |
|
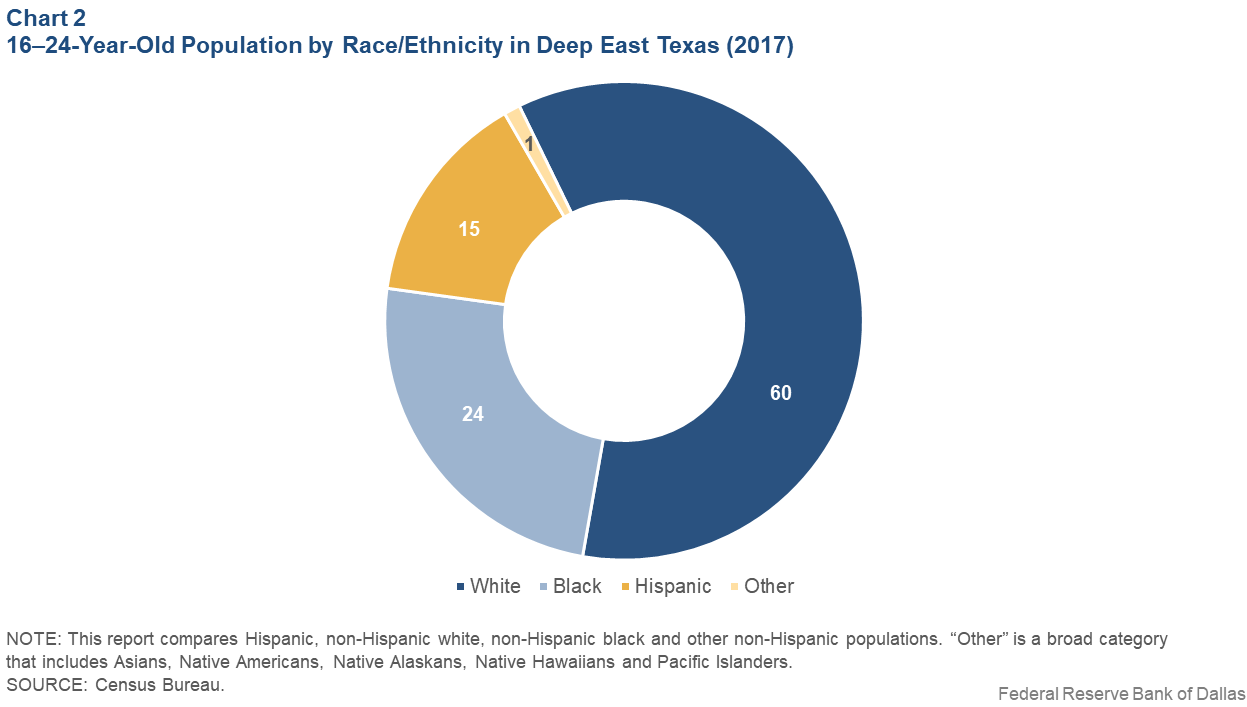
When asked about opportunity youth in rural areas, Wynn Rosser is quick to point out that their challenges—whether transportation, lack of health services or hunger—are no different than the challenges of urban opportunity youth. “It’s the way poverty expresses itself that’s different,” says Rosser, president and CEO of T.L.L. Temple Foundation in Lufkin, Texas. Rosser—whose organization brings resources to rural communities in the areas of education, economic development and community revitalization— says rural “brain drain” has become a popular topic of conversation. However, what he sees is that most rural young people stay near home but many do not thrive, with some working more than one job and still unable to make ends meet. Deep East Texas, a region T.L.L. Temple serves, has a disconnection rate of 30 percent—more than twice the state average.[1] The main reason for disconnection, Rosser says, is that rural places have fewer economic opportunities. One example Rosser points to is the job loss in rural areas due to automation, which he’s seen in East Texas lumber mills. These mills now hire fewer employees, and those who remain tend to the machinery that replaced them on the factory floor. To ensure that local youth build the skills they need to be employable, T.L.L. Temple is starting dual-enrollment high school programs in the region. Rosser says one factor contributing to the loss of local opportunity is that legacy employers in rural areas—those that previously hired the grandparents and parents of today’s youth—are no longer locally owned. As a result, a company’s mindset and investment shifts away from the community where its employees live. In the absence of such local investment, T.L.L. Temple is creating cross-sector partnerships among school districts, local government, nonprofits and philanthropy. He says that these partnerships break down silos and inspire creative solutions to local challenges, such as disconnected youth. This, Rosser says, helps make opportunity youth “everyone’s issue.” From a statewide and nationwide perspective, it is difficult to reengage opportunity youth without first dispelling misconceptions about who they are. Some of these misconceptions, Rosser notes, are based on stereotypes labeling people in rural areas as “backward” and demographically homogenous. In fact, as the data from the Deep East Texas region show in Chart 2, over a third of the 16–24 population is young people of color. Rosser says that once people travel to his part of the state and peek through the “pine curtain,” they discover a bright, young population that is deserving of the opportunities afforded to many other young adults in Texas.
|
Race and Ethnicity
In the United States, Native American, black and Hispanic youth are somewhat more likely to be disconnected than white and Asian youth.[7] This holds true in Texas, where black and Hispanic youth are overrepresented among the state’s opportunity youth but where 28 percent of disconnected youth are white (Table 1).
Table 1: Texas Youth Age 16–24 by Race and Ethnicity (2017)
| White | Black | Hispanic | Other | |
| Total 16–24-year-old population in Texas (percent) | 35 | 13 | 46 | 6 |
| Opportunity youth population in Texas (percent) | 28 | 16 | 52 | 4 |
| Number of opportunity youth | 137,954 | 77,508 | 252,510 | 19,499 |
| SOURCE: Census Bureau. | ||||
In Hidalgo County, disconnection rates are high among people of color at 20 percent for Hispanic youth and 22 percent for black youth in the 16–24 age group. Hispanics make up 96 percent of all 16–24-year-olds in this county along the Mexican border. In Bexar County, home to San Antonio, Hispanic opportunity youth are overrepresented at 72 percent in a county where 64 percent of the 16–24 population is Hispanic.
Dallas and Harris counties have disproportionately high disconnection rates among black youth at 32 percent and 24 percent, respectively. In Dallas County, that means nearly 20 percent of black youth in that age range are out of school and not working, compared with 15 percent of Hispanic youth and 10 percent of white youth. The disparities in Harris County are slightly smaller, with 16 percent of black youth neither in school nor working, compared with 14 percent of Hispanic youth and 11 percent of white youth.
Throughout U.S. history, communities of color have faced barriers to education and employment that continue to have ramifications today. The effects are evident in lower average incomes and wealth accumulation.[8],[9] Underperforming public schools and the high cost of college may be obstacles to higher education in these communities. Racial discrimination in hiring and involvement in the criminal justice system may also be barriers to well-paying jobs for young people of color, particularly black men.[10] Each of these factors can lead to fewer opportunities in young adulthood and contribute to disconnection.
Gender
In Texas, 52 percent of people who meet the standard definition of opportunity youth are female. This definition includes young adults who forgo school and paid work to be stay-at-home parents. As a result, a 16-year-old girl without children who is neither in school nor working and a 24-year-old woman who opts to be a stay-at-home mother would both be considered opportunity youth. The standard definition, therefore, is complex and warrants further discussion (see the sidebar “Who Counts as Disconnected? A Look at Gender and Parenthood.”)
When the statewide data are disaggregated by race and gender, it appears that both black men and women are overrepresented among opportunity youth. Hispanic women are overrepresented as well, but Hispanic men are slightly underrepresented (as are white men and women, and men and women of “other” races). While it is beyond the scope of this paper to further explore the differences exposed by race and gender, these are insights that community leaders may want to take note of.
| Who Counts as Disconnected? A Look at Gender and Parenthood |
|
Social customs in the United States have changed. Women have higher levels of educational attainment, not only from a historical perspective, but also when compared with men today.[1] Women graduate from both high school and college at higher rates.[2],[3] Women’s labor force participation grew significantly in the mid-20th century and was at 56.8 percent in 2016.[4] American women are also having children later in life.[5] From an anecdotal perspective, it is possible that previous cultural norms masked the disconnection rate of girls and young women in earlier generations. Because these norms have shifted, researchers frequently choose to label 16–24-year-old women who are neither in school nor working as opportunity youth, regardless of marital or parenthood status. When these girls and women are disconnected, it may be more often due to a lack of opportunity when it comes to school or work. External factors in disconnection may include the availability of child care, the cost of child care (a statewide annual average of $5,512 for one parent caring for one child), Texas’ teen pregnancy rate (higher than the nation’s average) and other barriers.[6],[7] |
|