Texas Economic Indicators

October 26, 2021
The Texas economy continued to recover in September. Payroll employment growth accelerated, and unemployment claims ticked up but remained near their lowest levels of the pandemic. The Texas Business-Cycle Index continued to climb. Existing-home sales increased in all of Texas’ major metros. In August, both Texas retail sales and construction contract values saw steady growth.
Labor Market
Texas Employment Gains Continue
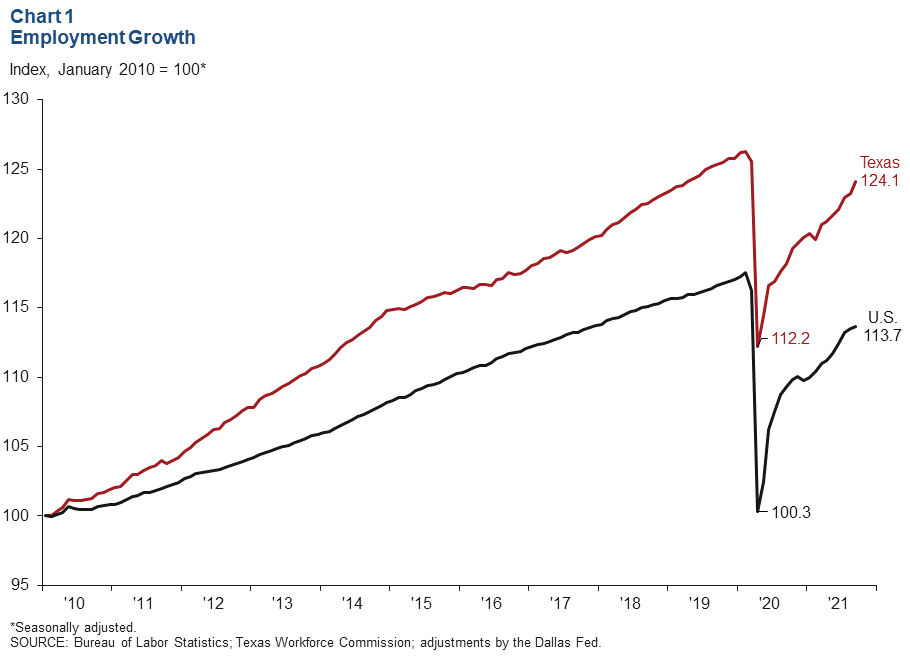
Texas employment expanded an annualized 8.8 percent in September after growing a downwardly revised 3.0 percent in August (Chart 1). Texas job growth in September outperformed the U.S. However, through September, Texas employment has risen an annualized 4.5 percent, trailing the nation’s 4.8 percent increase. The Dallas Fed’s Texas Employment Forecast is for 5.1 percent job growth this year (December/December), suggesting a pickup in job growth in the fourth quarter and a full recovery in payrolls by early 2022.
Unemployment Claims Remain Near Pandemic Low
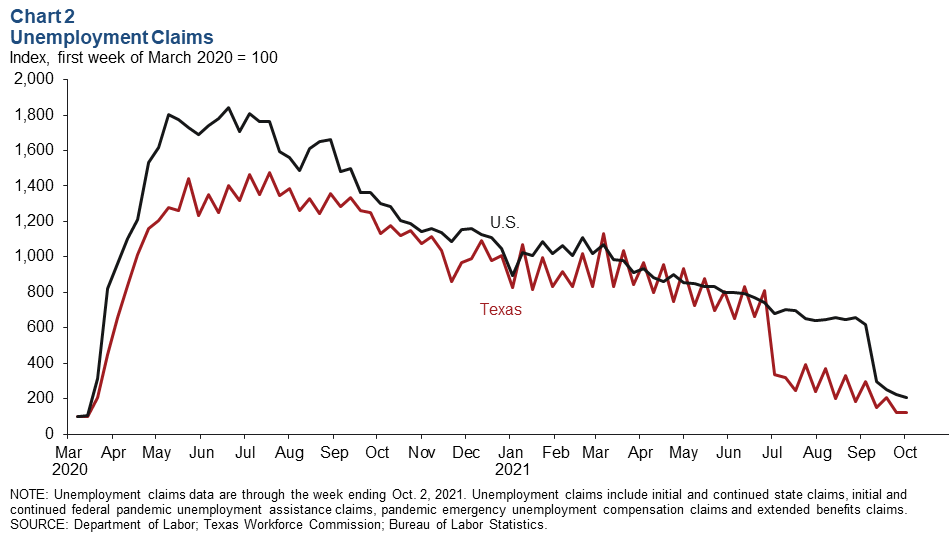
Total unemployment claims ticked up in Texas in early October but dropped nationally (Chart 2). During the week ending Oct. 2, total jobless claims in Texas remained close to the recent pandemic low recorded during the week ending Sept. 25 and were more than 90 percent below the peak level recorded in the week ending July 18, 2020. In September, the Texas unemployment rate fell to 5.6 percent, while U.S. unemployment dipped to 4.8 percent.
Texas Business Cycle Index
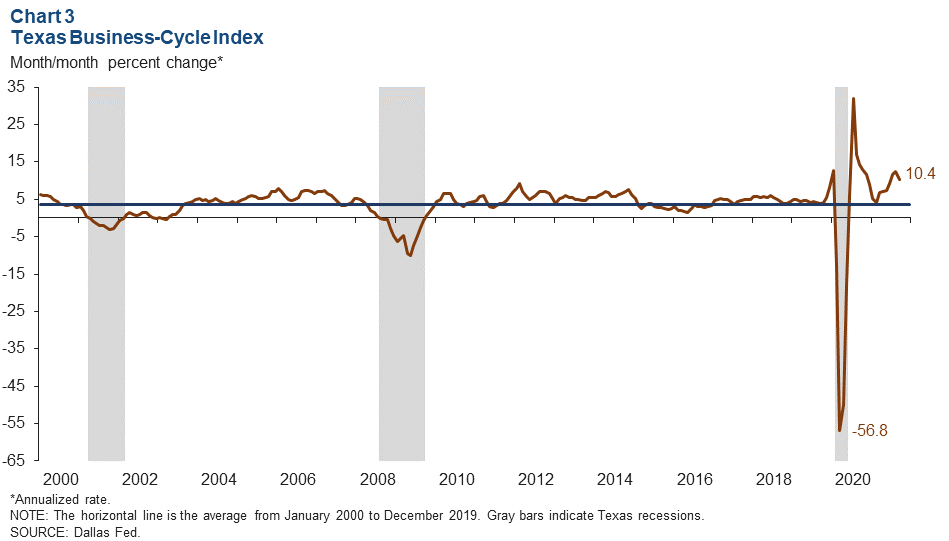
The Texas Business-Cycle Index, a composite of the unemployment rate, state payroll employment and gross state product, measures underlying economic activity in the state. In September, the index rose an annualized 10.4 percent, marking the 16th consecutive month of growth (Chart 3). Growth in the index slipped from 12.5 percent in August.
Home Sales
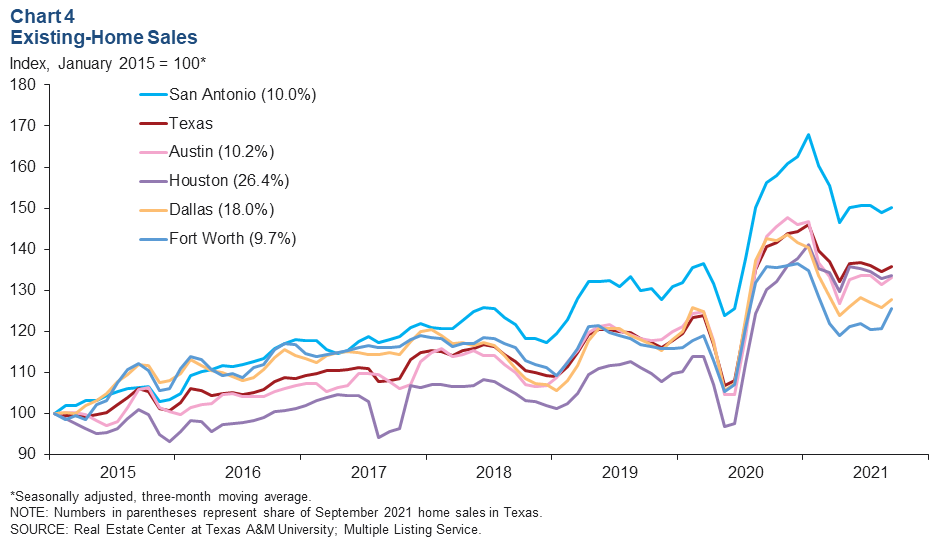
The three-month moving average of Texas existing-home sales rose 1.0 percent in September, and was up in all major metros (Chart 4). The largest increase was in Fort Worth, where sales climbed 4.2 percent, followed by Dallas at 1.4 percent, Austin at 1.2 percent, San Antonio at 0.8 percent and Houston at 0.6 percent. However, year-over-year sales statewide were 3.4 percent lower than in September 2020.
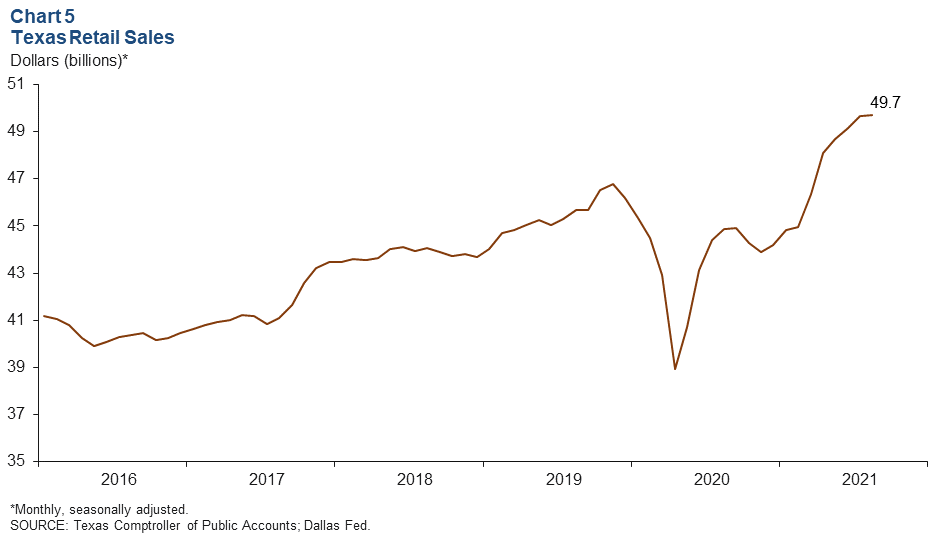
Retail Sales
Texas retail sales expanded 0.7 percent to $49.7 billion in August (Chart 5). This marks the ninth straight month of growth in Texas retail spending. Retail sales growth was modest in August after two months of stronger gains; however, year-to-date gains remain solid. In August, sales were 10.8 percent higher compared with August 2020 levels.
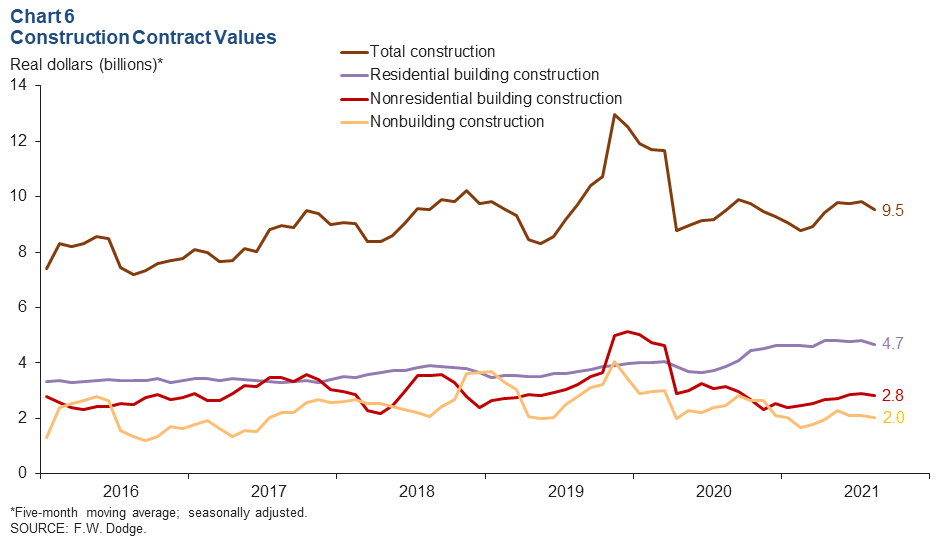
Construction
Construction contract values climbed 5.5 percent in August, while the five-month moving average fell 3.2 percent (Chart 6). The drop in the moving average was the largest since February 2021, when construction activity was halted for about a week due to Winter Storm Uri. The five-month moving average of contract values in all major construction categories dipped in August, with nonbuilding construction posting the largest decline at 4.1 percent—falling to $2.0 billion.
NOTE: Data may not match previously published numbers due to revisions.
About Texas Economic Indicators
Questions can be addressed to Laila Assanie at Laila.Assanie@dal.frb.org. Texas Economic Indicators is published every month during the week after state and metro employment data are released.