December 27, 2016
Growth in Texas Manufacturing Activity Picks up Pace
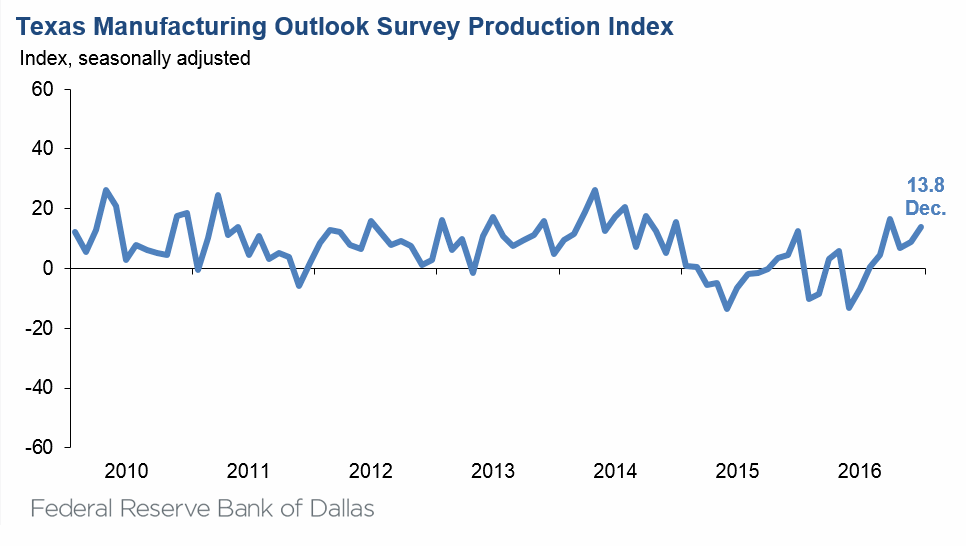
Texas factory activity increased for the sixth consecutive month in December, according to business executives responding to the Texas Manufacturing Outlook Survey. The production index, a key measure of state manufacturing conditions, rose five points to 13.8, suggesting faster output growth this month.
Most other measures of current manufacturing activity indicated expansion, although demand growth remained slightly negative. The new orders index climbed nine points to 7.3, posting its first positive reading in four months. However, the growth rate of orders index stayed slightly negative, edging down to -3.4. The capacity utilization index shot up 10 points to 13.8, its highest reading in more than two years. The shipments index rebounded from a dip into negative territory last month, climbing seven points to 4.7.
Perceptions of broader business conditions improved again this month. The general business activity index posted a second consecutive positive reading and moved up to 15.5. The company outlook index posted a similar gain, increasing six points to a reading of 17.4.
Labor market measures indicated slight employment declines and modestly longer workweeks. The employment index dipped to -2.9 after three months in positive territory. Seventeen percent of firms noted net hiring, compared with 20 percent noting net layoffs. The hours worked index came in at 2.7, largely unchanged from last month’s reading and indicative of a slight increase in workweek length.
Prices and wages rose in December. Input cost increases accelerated markedly, with the raw materials prices index rising 10 points to 28.1. The finished goods prices index also rose notably, climbing from 8 to 14.7 and reaching its highest level since early 2012. Wages and benefits continued to rise, with the index edging up to 18.7.
Expectations regarding future business conditions improved notably this month. The index of future general business activity advanced 8 points to 39.7. The index of future company outlook posted a double-digit increase and came in at 46.8, its highest reading in 12 years. Most other indexes for future manufacturing activity pushed higher in to positive territory.
Next release: January 30, 2017
The Dallas Fed conducts the Texas Manufacturing Outlook Survey monthly to obtain a timely assessment of the state’s factory activity. Data were collected Dec. 13–21, and 112 Texas manufacturers responded to the survey. Firms are asked whether output, employment, orders, prices and other indicators increased, decreased or remained unchanged over the previous month. Survey responses are used to calculate an index for each indicator. Each index is calculated by subtracting the percentage of respondents reporting a decrease from the percentage reporting an increase. When the share of firms reporting an increase exceeds the share reporting a decrease, the index will be greater than zero, suggesting the indicator has increased over the prior month. If the share of firms reporting a decrease exceeds the share reporting an increase, the index will be below zero, suggesting the indicator has decreased over the prior month. An index will be zero when the number of firms reporting an increase is equal to the number of firms reporting a decrease. Data have been seasonally adjusted as necessary. |
Click on links in the table for greater details. Historical data are available from June 2004 to the most current release month.
*Indicator direction refers to this month's index. If index is positive (negative), indicator is increasing (decreasing) or improving (worsening). If zero, indicator is unchanged.
**Number of months moving in current direction.
Data have been seasonally adjusted as necessary.
December 27, 2016
December 27, 2016
Comments from Survey Respondents
These comments are from respondents' completed surveys and have been edited for publication.
Chemical Manufacturing
- We believe the petroleum/petrochemical business will be looking at an upturn in mid-2017. There is pent-up demand and unspent capital waiting on the new political climate to settle in. Also, OPEC's actions will reinvigorate the exploration and production side of the business.
- We are seeing an uptick in our client's inventory levels. I believe there was pent-up demand since life sciences product manufactures seem to have been waiting until after the election to gauge their demand.
Primary Metal Manufacturing
- We purchased another company and feel optimistic regarding market share growth in 2017.
Fabricated Metal Product Manufacturing
- We are seeing a general slowdown in refining purchases of equipment as the turnaround season has ended. Until budgets are finalized, spending from the oil companies has basically halted for 2016. We have labor contracts that require us to pay increases at the same time we are doing layoffs. Business is tough.
- I have never seen customers and suppliers so positive after any election in 40 years. There is real optimism for business in the U.S.
- The global economies and U.S. economy are very weak and uncertain.
- We are bidding a lot of requests for quotations on projects that have been on hold. It remains to be seen if higher oil prices and the improved outlook translates into new business. Our project revenue for 2015 will be less than 50 percent of 2014 contract sales.
- December has improved from very weak November levels. Visibility on first-quarter volume is limited at this time.
- The EPA's regulation of wood burning furnaces has put several of my customers out of business and reduced our sales significantly. These new regulations will put my company out of business.
- The domestic oil and gas exploration and production activity is increasing with the market price of WTI oil. We expect our industry to improve with the WTI oil price increases.
Machinery Manufacturing
- Several of our businesses are recovering from plant-consolidation-related performance issues, and customer-facing metrics are much improved. This is starting to enable some market share gain that drives growth in excess of the market growth rate. There is excess capacity at each manufacturing facility so there are no major investments in equipment or manpower to meet production requirements.
- Finally we have change we can believe in.
Computer and Electronic Product Manufacturing
- Dollar hedging by other countries is putting a huge dent on exports and is detrimental to a lot of us businesses.
Electrical Equipment, Appliance, and Component Manufacturing
- We just purchased some costly computer numeric control machining equipment valued at over $500 thousand. The accelerated depreciation provisions of the tax code were key to the decision to buy the equipment, based on payback analysis. The Federal Reserve should understand how important the deductibility of expenditures for equipment is as an incentive to purchase, which also contributes to retaining jobs in the U.S.
Transportation Equipment Manufacturing
- We are not bearish on business activity in general, and ultimately we believe the environment will improve substantially, but our particular industry is tethered to tax receipts and we see that slowing for us this year due to the energy sector downturn and its effect on Texas municipalities. We are cautious in our outlook for the next six months and want to be able to move quickly in either direction depending on what actually happens.
- We have reason to believe the economy will be on a real growth path and as a result may see increases in prices paid for raw materials. We expect interest rates to creep up and the Federal Reserve to finally take its finger off the scale.
- With the new administration, there is a concern about policies toward Mexico, the North American Free Trade Agreement and the Trans-Pacific Partnership. If tariffs for goods imported from Mexico and certain Asian countries are increased, it will affect the price of some of our components in a negative way.
- Optimism after the election is high. There was a huge sigh of relief from our customer base.
Printing and Related Support Activities
- After a rocking busy October and November, we have gotten very slow in the plant. I am not sure why, as normally we tend to be busy in December and that carries over into early January. We typically are slow from January through April with some occasional busy months mixed in. I am not sure how it will be this go-round.
Wood Manufacturing
- The fourth quarter will be largest of the year. This is very unusual, as our customers are new single-family homes, and in all years past it has never occurred where the fourth quarter is the year's largest.
Paper Manufacturing
- Our main raw material (linerboard) increased in cost, but pass through to customers is very difficult. Volume increase predictions are very slight but on the positive side nonetheless. We need a few more employees, but they are hard to find. We start at $12 to $14 per hour.
Miscellaneous Manufacturing
- We are hoping to get help with overly-burdensome labor regulations, taxation relief and red-tape reductions to allow American companies to become more competitive. If the new administration is able to make good on its promises, we expect to be more competitive globally and increase our investments in technology, hiring and increasing U.S.-based manufacturing (including more assembly that is currently being done in Asia and Europe).
Historical Data
Historical data can be downloaded dating back to June 2004.
Indexes
Download indexes for all indicators. For the definitions of all variables, see Data Definitions.
| Unadjusted |
| Seasonally adjusted |
All Data
Download indexes and components of the indexes (percentage of respondents reporting increase, decrease, or no change). For the definitions of all variables, see Data Definitions.
| Unadjusted |
| Seasonally adjusted |