Economic Conditions and the Stance of Monetary Policy
June 24, 2019
At the recent June meeting, the Federal Open Market Committee (FOMC) left the federal funds rate unchanged in a range of 2.25 to 2.5 percent. In our statement, the FOMC indicated that uncertainties about the outlook have increased and stated that “in light of these uncertainties and muted inflation pressures, the Committee will closely monitor the implications of incoming information for the economic outlook and will act as appropriate to sustain the expansion, with a strong labor market and inflation near its symmetric 2 percent objective.”[1]
The purpose of this essay is to describe my assessment of economic conditions in the U.S. and global economies. In addition, I will discuss business activity in the Eleventh Federal Reserve District and describe how the implications of climate change are impacting Dallas Fed economic analysis of the district and the nation. Lastly, I will discuss my views regarding the appropriate stance of U.S. monetary policy.
The U.S. Economy
Dallas Fed economists expect U.S. gross domestic product (GDP) to grow at a rate of approximately 2 percent in 2019. This is slower than the 3 percent growth achieved in 2018, primarily due to continued waning of U.S. fiscal stimulus, a lower rate of global growth and increased business uncertainty due mostly to heightened trade tensions.
The U.S. economy has been bolstered by a strong consumer. Household balance sheets are in relatively healthy shape—household debt declined from 97 percent of GDP at year-end 2008 to approximately 75 percent in the first quarter of 2019.[2] In addition, a tight labor market has given an added boost to consumer spending and confidence. The consumer is approximately 70 percent of the U.S. economy, so this strength provides a solid underpinning to the outlook for growth.
On the cautionary side, trade tensions and uncertainty have increased significantly over the past two months. Tariffs and trade uncertainty appear to be having a negative impact on companies’ ability to manage input costs and some chilling influence on their capital spending plans. Even before this recent escalation, nonresidential fixed investment had contributed only 0.3 percentage points to GDP growth in the first quarter versus an average of 0.9 for 2017 and 2018.[3] In a recent Dallas Fed Texas Manufacturing Outlook Survey, more than half of companies responding reported that tariffs are increasing their input costs, and a material number of companies reported a reduction in their capital spending plans.[4]
There is evidence that tariffs and trade uncertainties may be impacting manufacturing activity. The most recent manufacturing sector surveys from the Federal Reserve Banks of New York, Philadelphia and Dallas all show significant deterioration in manufacturing business sentiment.
One positive development worth noting is that balance sheets of U.S. banks appear to be in much better shape than 10 years ago. While I have flagged the high level of corporate debt as a potential amplifier in the next downturn, I would also note that the improvement in bank balance sheets means that they should be capable of extending credit in a way that is supportive of further economic expansion. The Fed’s recent stress tests indicate that, after adjusting for stress-scenario losses, capital levels at the largest U.S. banks would still be above capital levels those banks held before the financial crisis of 2008–09.[5]
The Labor Market
The U.S. unemployment rate is 3.6 percent.[6] At the Dallas Fed, we particularly focus on U-6, a broader measure of unemployment that tracks unemployed plus discouraged workers who have given up looking for work, plus part-time workers who would prefer to work full time. This measure is now 7.1 percent, which is well below its prerecession low of 7.9 percent in December 2006.
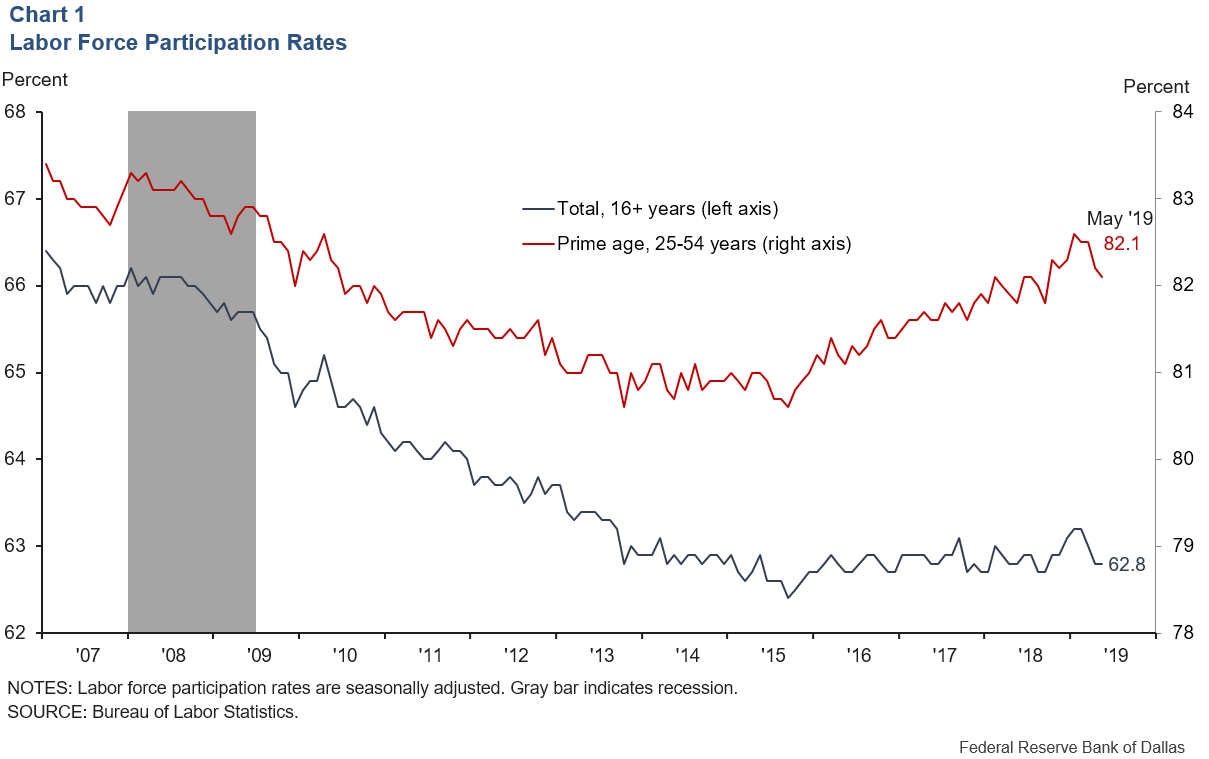
The labor force participation rate now stands at 62.8 percent. It has ranged between 62.4 percent and 63.2 percent for the past five years. The participation rate is the percentage of people 16 years of age and older who participate in the workforce by either working or looking for work.
One factor supporting the overall participation rate is the improvement in the participation rate of prime-age workers (25 to 54). Prime-age participation has increased from 80.9 percent in 2015 to 82.1 percent today. Chart 1 highlights these trends in labor force participation.
It is important to recognize that the aging of the U.S. workforce is negatively impacting the overall participation rate because as workers age, an increasing percentage are more likely to retire. It is the view of Dallas Fed economists that increasing participation of prime-age workers is unlikely to last indefinitely—aging population demographics will tend to bring down the overall labor force participation rate. In light of these trends, it is our view that the labor force participation rate will likely decline to below 61 percent over the next 10 years, even as workers tend to remain in the labor force later in their careers.[7]
The May jobs growth number was approximately 75,000—lower than the average monthly job growth of approximately 223,000 in 2018 and 186,000 in 2019 through April.[8] It is the view of Dallas Fed economists that moderation in the rate of job growth is consistent with a labor market that is tight and likely at or past the level of full employment in the U.S. As a consequence of this tightness, we would expect job growth to remain moderate in the months ahead. Long-run GDP growth is made up of growth in the workforce and growth in labor productivity. Assuming there is not an offsetting burst in productivity growth, a slowing rate of workforce growth will likely translate into slowing GDP growth in the U.S.
Wage Growth and Continuing Strong Jobs Gains
If we are at or past full employment, why is the average nominal rate of wage growth only 3.1 percent?[9] Also, even with the moderation in May jobs growth, why has job growth in 2019 averaged approximately 164,000 workers per month, well over what is necessary to keep up with population growth?[10]
Regarding wages, our Dallas Fed economists believe that more muted inflation and inflation expectations, as compared with previous expansions, are factors tempering nominal wage growth in this expansion. Also, they argue that older workers have increased as a share of the labor force over the past 10 years—and their rate of wage growth tends to be more tepid than that of younger workers.[11] Lastly, our economists believe that more subdued productivity growth has likely had a somewhat muting impact on wage growth.
On a related point, research by the Dallas Fed’s Joe Tracy and Michael Morris along with Robert Rich of the Cleveland Fed indicates that individual wage growth is, in fact, higher than standard statistics have suggested. Their research finds that the growth rate of widely followed wage indicators like average hourly earnings are disproportionately weighted to high-wage earners, who are also typically older and have a lower rate of wage growth. They find that an average of individual wage growth rates, which equally weights the wage growth of all workers, has been close to 5 percent in recent years—materially higher than the 3.1 percent average hourly earnings measure recorded in May 2019.[12]
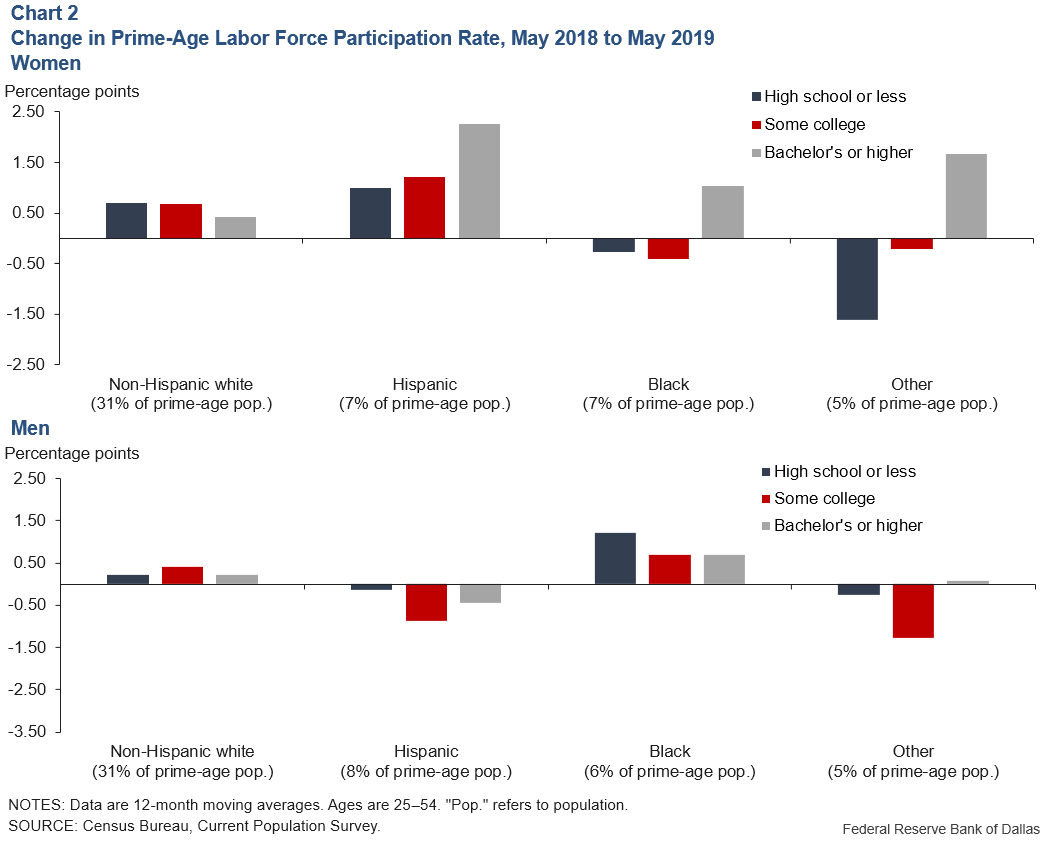
Regarding recent job gains, one key driver has been the improvement in prime-age labor force participation (described earlier). As part of this improvement, it is important to note recent gains reflect disproportionate improvements in participation by previously underrepresented groups. For example, Hispanic women across educational attainment levels, as well as black men with a high school diploma or less, have disproportionately improved their levels of labor force participation. Chart 2 provides a breakdown of recent changes in participation rates, based on educational attainment, race/ethnicity and gender.
These recent improvements in the participation of previously underrepresented groups as well as the growth in wages are welcome developments. To the extent historically underrepresented groups can be drawn into the workforce and gain the skills and experience that enhance their likelihood of staying in the labor force, this should have the impact of increasing the size and productive capacity of the U.S. labor force.
Increasing the size and productive capacity of the labor force is especially important as firms face significant difficulties trying to find workers. A recent Dallas Fed Texas Business Outlook Survey finds that 71 percent of firms surveyed are seeking to hire and 83 percent of those firms report that they are having difficulty finding qualified workers.[13]
As discussed earlier, it is the view of Dallas Fed economists that while there is some scope for further gains in labor force participation, it will not be sufficient to offset the effects of a historically tight labor market. As a result, it is likely that the rate of job growth will remain moderate in the months ahead. In this regard, we believe that job growth in the range of 60,000 to 120,000 jobs per month will be consistent with a “strong”[14] jobs market for the remainder of 2019.
Inflation
The most recent personal consumption expenditures (PCE) reading of inflation was approximately 1.5 percent on a 12-month basis.[15] Our Dallas Fed economists prefer to look at the Dallas Fed Trimmed Mean PCE measure of inflation, which has been running consistently between 1.9 and 2 percent over the past year—and is currently running at approximately 2 percent.[16] This reading of core inflation exes out extreme moves to the upside and downside in individual inflation components. Research by my Dallas Fed colleagues Evan Koenig and Jim Dolmas suggests that the trimmed mean measure is a highly useful indicator of future headline PCE inflation trends.[17] It is our expectation that the trimmed mean will end this year in the range of 2 percent and that headline PCE inflation will move higher over the next 12 months.
I have written and spoken about the idea that there are two key elements of inflation: the cyclical and the structural. Dallas Fed economists believe these two forces are currently working in opposing fashion.
Cyclical inflationary forces are building. These cyclical forces are driven primarily by a tightening labor market and continuing wage gains. Historically, economists would have expected a tightening labor market to contribute to greater price pressures. This connection between labor market slack, wages and prices is sometimes referred to as the “Phillips curve.”[18] Given these cyclical factors, why hasn’t inflation been more apparent? Why have we spent most of the past seven years—and particularly the past two years, when the unemployment rate has been below most estimates of the natural rate of unemployment—with a headline PCE inflation rate below the Fed’s 2 percent objective?
Our view at the Dallas Fed is that the structural forces of technology, technology-enabled disruption and, to some lesser extent, globalization are muting the relationship between labor market tightening and wage gains, and are even further muting the connection between wage gains and prices. Technology advancements such as artificial intelligence are allowing businesses to replace people with technology. In addition, new business models, often technology enabled and aided by the proliferation of mobile computing power, are disrupting old business models and allowing consumers to have more power in choosing the lowest price at a high level of convenience. Think Amazon, Uber, Lyft, Airbnb and so on. These models are often further enabled by the fact that the cost of capital is historically low, and financial markets are willing to assign these businesses substantial valuations and advance substantial amounts of capital, even though these companies frequently generate little or no profitability in their early years.
Against this background, numerous Dallas Fed business contacts report having materially less pricing power today than they have had historically. Based on these discussions, it is our view that as cyclical forces build, which lead to increased costs, these cost increases are just as likely to lead to business margin erosion as they are higher prices.
In a historically tight labor market, cyclical inflationary pressures will likely remain elevated. The question is whether they are strong enough to offset the structural forces that are muting inflation. Time will tell, but we are watching this dynamic very carefully at the Dallas Fed. While the Phillips curve appears to have flattened, it might be a mistake to assume that it is dead—it may just be that the level of unemployment that creates undue price pressures is lower than we have historically experienced—but the overall dynamic hasn’t gone away completely.
The Global Economy
Global (ex the U.S.) GDP growth was approximately 4.3 percent in 2017, declined to 4.0 percent in 2018 and is expected to be 3.6 percent in 2019.[19] Furthermore, risks to this outlook appear to be tilted to the downside. Growth expectations are sluggish due to slowing growth in the euro area and in other advanced economies, as well as somewhat more muted growth in emerging economies.
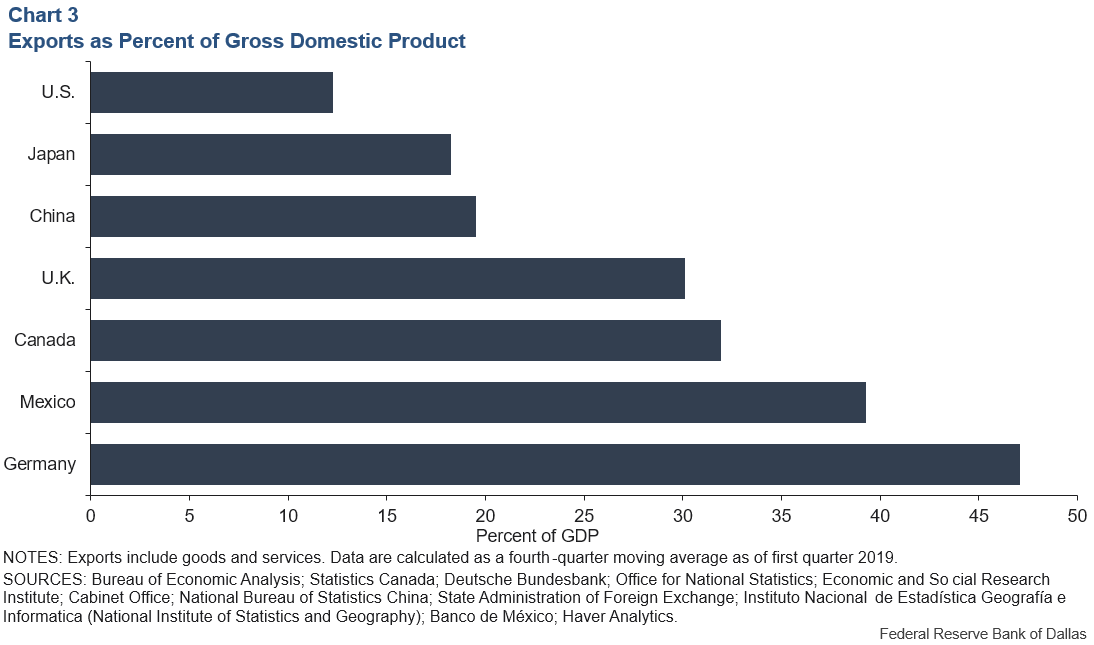
Trade tensions likely play some role in this softening. While exports are approximately 12 percent of U.S. GDP, they are 20 percent for China, 47 percent for Germany and 18 percent for Japan.[20] (See Chart 3.)
While the U.S. may outperform many of these other countries, it is our view at the Dallas Fed that slower growth outside the U.S. is likely to translate into slower growth in the U.S. In this regard, it is worth noting that approximately 45 percent of S&P 500 company revenues come from outside the U.S.[21] While non-U.S. markets serve as important end markets for U.S. companies, logistics and supply-chain arrangements with Mexico, Canada and China are important to these companies in an effort to manage their costs. This is particularly true in North America.
For example, it is estimated that 73 percent of U.S. imports from Mexico are composed of intermediate goods; that is, goods that are part of integrated supply-chain and logistics relationships that allow U.S.-domiciled companies to increase their global competitiveness and keep jobs in this country.[22]
Economic Conditions in the Eleventh District: Including a Brief Discussion Regarding the Impact of Climate Change
Overview
The Eleventh Federal Reserve District comprises Texas, northern Louisiana and southern New Mexico. Texas job growth in 2018 was approximately 2.3 percent, and we expect jobs to grow at a solid rate in 2019.
It is worth noting that the Eleventh District is particularly impacted by developments in the energy industry and international trade, as Texas is both the largest energy producer of any state and the nation’s largest exporter. It is also important to note that growth in Texas continues to be aided by the migration of people and firms to the state. This migration has helped bring human capital and new businesses to the state, which have helped fuel the diversification of industry and the development of its largest metropolitan areas: Houston, Dallas–Fort Worth, San Antonio and Austin.[23]
The Impact of Climate Change: Frequency and Intensity of Severe Weather Events
One factor we are increasingly discussing at the Dallas Fed is the impact of climate change on the Eleventh District. In particular, severe weather events can have a substantial human and economic cost to the district.
One recent example is Hurricane Harvey, which occurred in August 2017. It is estimated that Harvey caused approximately $74 billion in property damage and lost output in the state.[24] While the GDP and job losses appear to have been transitory, the lasting impact in Houston and along the Texas coast continues to be felt in the form of displacement of communities, ongoing rebuilding efforts, increased insurance costs, public spending on mitigation efforts, and more stringent building codes. In addition, the storm disproportionately impacted low-income families by wiping out their savings, impacting their ability to safely domicile their families and increasing their need for health care and related services.[25] Given the extent of the damage, a key question for civic leaders, businesses and residents is the extent to which severe weather events like Harvey are likely to be unusual and sporadic in the future or whether they are likely to become more frequent in the years ahead.
The Eleventh District is home to approximately 50 of the Fortune 500 companies. It is also a major infrastructure hub for the nation’s energy production, transmission and refining capability. The seaports along the Gulf Coast as well as the inland ports in our major metro areas and along the U.S.–Mexico border play a critical role for the U.S. in trade and immigration.
In this context, my Dallas Fed research team is focused on the extent that severe weather events such as hurricanes, droughts, flooding and tornadoes are increasingly likely to impact our people, cities, critical energy infrastructure and key industries. While our district has historically exhibited great resilience in response to the effects of severe weather, the latest National Climate Assessment, a comprehensive report on climate change and its impacts, indicates that the severity and damage caused by extreme weather events are likely to intensify in the years ahead. (See the appendix for a discussion of the National Climate Assessment findings and conclusions, as well as a discussion of certain major considerations for the Eleventh District.)
As a central banker, I do not delve into the political and other controversial aspects of this subject. However, I do intently focus on the ways severe weather events and climate-related trends are likely impacting economic conditions and financial stability in the Eleventh District and the nation.
It is the view of Dallas Fed economists that severe weather events pose a “tail risk” for certain cities and industries in our district. This is not new. However, while many of the impacts of these severe weather events have historically been transitory, we are increasingly cognizant of the longer-term risks that are leading several cities and companies to make substantial capital investments in improving infrastructure in order to mitigate the damage of future severe weather.
For now, it is the view of the Dallas Fed that severe weather-related tail risks are unlikely to materially negatively impact the medium-term economic performance of Texas and overall outlook for the region. However, if the National Climate Assessment predictions regarding the likely frequency and/or severity of extreme weather events turn out to be accurate, these extreme weather events may begin to have a negative impact on the region’s longer-term business prospects and migration trends.
Adaptation and Mitigation Efforts
Businesses, elected officials and civic leaders are taking a number of steps to manage these risks. State and local leaders are studying various infrastructure investments in order to upgrade the viability of neighborhoods, protect at-risk populations who lack the resources to recover from severe weather events, protect businesses, and ensure the ongoing production, transportation and transmission of energy services in the event of a severe weather-related disruption.
In addition, in our extensive discussions with energy industry contacts as well as broad business contacts, we are learning that businesses are investing much more heavily in alternative energy projects and sustainability initiatives.
Energy companies are making substantial investments in moderating the environmental impacts of shale oil production. A number of energy companies and private equity firms are actively investing in battery storage and wind and solar projects that could diversify sources of energy in the U.S. In addition, Texas is now the largest wind-energy-producing state in the nation.[26] Many companies are adopting greenhouse-gas emissions targets and making investments to reduce their carbon footprint.
At the Dallas Fed, we are actively working to play a research and convening role throughout the Eleventh District to help frame these issues and discuss approaches that would improve the region’s ability to manage the effects of future severe weather events.[27] In addition, in order to improve our sustainability leadership and enhance our insight into these matters, the Dallas Fed has established a sustainability initiative intended to reduce our own greenhouse gas emissions and empower our employees to take actions which will improve the sustainability performance of our Bank.[28]
The Stance of Monetary Policy
In light of relatively solid rates of economic growth, a labor market at or past full employment and a PCE inflation rate somewhat below target, I believe it is appropriate to take a balanced approach to monetary policy. I would note that, while headline PCE inflation is running below target, the Dallas Fed Trimmed Mean measure of PCE inflation has been running at approximately 2 percent and our economists expect this measure of inflation to end the year in the neighborhood of 2 percent. In assessing economic conditions, I am cognizant of the structural challenges of slowing workforce growth due to an aging population and limitations on business pricing power due to technology and technology-enabled disruption as well as globalization.
I am also highly attuned to the fact that, since early May, downside risks to the outlook have increased due to heightened trade tensions and decelerating rates of global growth. The economy is also being impacted by the waning of fiscal stimulus. The question is whether trade and global growth uncertainties are likely to persist in a manner that leads to a material deterioration in the outlook for U.S. economic growth.
At this stage, I believe it is too early to make a judgment on this question. These heightened uncertainties have intensified over the past seven weeks, and it is certainly possible that events could occur in the near future which would substantially reduce these uncertainties. In this situation, I believe it would be wise to allow events to unfold a bit more before making judgments regarding the stance of monetary policy. I think this approach would be particularly wise in light of the fact that, as mentioned earlier, my base case is for solid GDP growth in 2019, and I expect labor market conditions to remain at levels I would consider at or past full employment. In addition, financial conditions—the cost and availability of credit—are particularly robust by historical standards.
As I have said previously, monetary accommodation is not “free.” I am concerned that adding monetary stimulus, at this juncture, would contribute to a build-up of excesses and imbalances in the economy which may ultimately prove to be difficult and painful to manage.
I have spoken about the level of corporate debt as potentially one of those excesses that is likely to be a “burden” on the economy in the event of a downturn. Persistently low interest rates make borrowing for share repurchase and merger transactions highly accretive to a company’s earnings per share. In a world where businesses have less and less pricing power and managing costs is essential, debt-financed activity becomes harder to resist. Debt-financed share repurchase and merger activity may help fuel growth in earnings per share when times are good, but in a downturn, increased debt levels will mean that a higher percentage of cash flow will be necessary to service interest and principal repayments. This is just one example of the type of excess that may seem innocuous when times are good but can become more troublesome in a downturn.
In this regard, I think it is important to emphasize that we are well-served by rigorous macroprudential policies, particularly tough capital requirements and stress testing for large banks as well as oversight of nonbank financials. In a period of persistently low interest rates, the potential exists for excesses and imbalances to build, and rigorous macroprudential oversight should provide more flexibility for monetary policy to deal primarily with economic conditions.
I am closely monitoring the shape of the yield curve in the U.S. The three-month Treasury yield is today at 2.12 percent. In my view, the one-year Treasury at 1.93 percent, the five-year at 1.77 percent and the 10-year at 2.03 percent are indicative of sluggish expectations for future growth—and recent heightening of trade tensions has likely exacerbated these growth concerns.[29] It is important to emphasize that financial markets can change very rapidly and are highly sensitive not only to increased economic uncertainties, but also to expectations of Federal Reserve monetary policy actions.
As I have said before, I would be concerned about an inversion of the curve—either three-month to 10-year or one-year to 10-year—of some size and duration. My concern emanates from my belief that an inverted curve ultimately makes it more difficult for financial intermediaries to borrow short and lend long—and, if the inversion persists, it would likely begin to impede the creation of credit and lead to a tightening of financial conditions. I will continue to watch this carefully.
I believe that we currently are in the neighborhood of a neutral setting for monetary policy—that is, we are likely neither accommodative nor restrictive. Over the coming weeks and months, I will be closely monitoring developments in the U.S. and global economies as well as the status of financial conditions (especially credit spreads and availability of credit). In particular, I intend to be highly vigilant with regard to the persistence of heightened trade tensions and indications that slowing global growth is spilling over into a material deterioration of the economic outlook for the U.S. In the meantime, I believe it would be wise to take additional time and allow events to unfold as we consider whether it is appropriate to make changes to the stance of U.S. monetary policy.
APPENDIX
National Climate Assessment Findings and Conclusions
In 1989, President George H.W. Bush created the U.S. Global Change Research Program (USGCRP). It was more formally established by Congress in 1990 via the Global Change Research Act. The USGCRP was given the mandate to develop and coordinate “a comprehensive and integrated United States research program which will assist the Nation and the world to understand, assess, predict, and respond to human-induced and natural processes of global change.”[30]
The USGCRP is comprised of 13 federal agencies that conduct or use research on global change and its impact on society. These agencies include the Departments of Agriculture, Commerce, Defense, Energy, Health and Human Services, Interior, State and Transportation, as well as the Environmental Protection Agency, National Aeronautics and Space Administration, National Science Foundation, Smithsonian Institution and U.S. Agency for International Development.
Every four years, the USGCRP prepares an assessment, known as the National Climate Assessment (NCA). The NCA analyzes the effects of global change on the natural environment, agriculture, energy production and use, transportation, human health and biological diversity; and it describes current trends in global change and projects trends for the subsequent 25 to 100 years.
The most recent NCA was completed in November 2018 and was produced by a team of more than 300 experts, with input from external stakeholders. An expert external peer review of the report was performed by the National Academies of Sciences, Engineering and Medicine.[31]
The NCA concludes “that the evidence of human-caused climate change is overwhelming and continues to strengthen, that the impacts of climate change are intensifying across the country, and that climate-related threats to Americans’ physical, social, and economic well-being are rising.”[32] The report cites “significant, clear, and compelling evidence that global average temperature is much higher, and is rising more rapidly, than anything modern civilization has experienced, with widespread and growing impacts.”[33]
The report also explains that greenhouse gases absorb heat in the atmosphere near the Earth’s surface, preventing it from escaping out into space. If the atmospheric concentrations of these gases rise, the average temperature of the lower atmosphere will gradually increase as the heat emitted by Earth is retained inside the climate system, warming the planet, a phenomenon known as the greenhouse effect.[34] Greenhouse gases include, for example, carbon dioxide, water vapor and methane.
The report cites studies which estimate that the global average temperature rose approximately 1.8 degrees Fahrenheit between 1901 and 2016,[35] and that for the period since 1986, global annual average temperatures appear to have increased at a more rapid rate than for any similar 20–30-year time period in at least the last 1,700 years.[36]
The NCA states that “annual average temperatures in the United States are projected to continue to increase in the coming decades.”[37] The report indicates that recent record-setting temperatures are expected to become common in the near future. By late this century, the report estimates that in the U.S., increases of 2.3°–6.7°F are expected under a relatively optimistic climate change scenario and 5.4°–11.0°F under a more dire scenario, relative to 1986–2015.[38]
In addition to temperature rise, the report suggests that we are likely to see further increases in ocean temperature as well as progressive melting in glaciers and ice sheets, some shrinking in snow cover and sea ice, rising sea levels, and more frequent high temperature extremes and heavy precipitation events.[39],[40]
The NCA argues that heavy rainfall events are associated with climate change. The report explains that, due to the relationships between levels of temperature and humidity, the frequency and intensity of heavy rainfall events are expected to increase over the coming century. The report asserts that warmer temperatures lead to increasing evaporation rates. This trend is likely to cause higher levels of water vapor in the atmosphere, which is likely to lead to more frequent and intense precipitation extremes.[41]
The NCA indicates that climate change has contributed to increases in Atlantic hurricane activity since 1970.[42] It also asserts that hurricane rainfall and intensity are projected to increase as a result of rises in sea surface temperatures and changes in atmospheric conditions.[43] While the frequency of tropical storms is not expected to change, the number of more-severe storms—those with sustained wind speeds in excess of 130 mph (referred to as Category 4 and 5 hurricanes)—is expected to increase.[44]
The report warns that U.S. coastal infrastructure could be adversely impacted by this trend. This infrastructure provides critical energy supplies and access to goods and services from overseas trade.[45] The report further highlights that reliable and affordable energy supplies, which support broad sectors of the U.S. economy, are increasingly at risk from climate change and weather extremes.[46]
Across much of the U.S., climate change is also expected to decrease surface soil moisture due to increased evaporation rates associated with warmer temperatures. This means that future droughts in certain regions of the U.S. are likely to be stronger and potentially last longer. The NCA explains that when droughts occur simultaneously with especially warm temperatures, it creates conditions for substantial wildfires, which have increased in frequency across the western U.S. since the 1980s.[47] Droughts can also have a significant impact on agriculture.
For a fuller explanation of the NCA report, please see the link, National Climate Assessment.
Discussion of Certain Major Considerations for the Eleventh District
Hurricane Activity
A hurricane is defined as a tropical storm with maximum sustained winds of at least 74 mph. Since 2000, approximately 20 hurricanes have impacted the Gulf of Mexico region of the U.S., comprising Texas, Louisiana, Mississippi, Alabama and Florida.[48] Over this period, 14 tropical storms passed through Texas, with six of these having sufficient maximum sustained winds to be categorized as hurricanes.
The NCA asserts that the intensity of hurricane activity is likely to increase. This trend is likely to be associated with greater rainfall during these severe storms.[49] In addition, the report indicates that climate change is likely to cause global sea levels to rise an average of 1–4 feet during the remainder of the 21st century.[50] As a result of rises in sea level, it is probable that the risk of flooding on the western Gulf of Mexico coast will increase.[51]
These developments could impact economic conditions in the Eleventh Federal Reserve District and U.S. because of the impact on coastal infrastructure, which connects the nation to energy supplies as well as access to goods and services from overseas trade. In addition, as a result of these trends, the costs to repair damage to Gulf Coast facilities are expected to grow substantially.[52]
One recent example of the impact of severe storms is Hurricane Harvey, which made landfall on Aug. 25, 2017, in the area just north of Corpus Christi, Texas. As Hurricane Harvey stalled over the Houston metro area, some areas recorded more than 50 inches of rain in a five-day period and experienced substantial flooding as local bayous, rivers and reservoirs overflowed their banks.[53]
According to estimates by Moody’s Analytics, Hurricane Harvey had total direct costs of approximately $65 billion and indirect costs of approximately $8.5 billion.[54] Tragically, 68 people are estimated to have lost their lives as a direct result of the storm. More than 300,000 homes and businesses and approximately 500,000 cars were flooded.[55]
Harvey led to an estimated 16,000 lost jobs in the Texas Gulf Coast region—however, the Dallas Fed estimates that as of the end of 2017, employment on the Gulf Coast had more than fully recovered.[56] While increased economic activity was associated with reconstruction efforts, there are more lingering impacts including lost homes and businesses, increased insurance costs and costs of government programs to mitigate future damages.
As discussed earlier, the Gulf Coast is home to a substantial concentration of refinery capacity, chemical industry infrastructure and offshore production facilities. At its peak, approximately 25 percent of the Gulf of Mexico’s offshore oil and natural gas production was shut in as a result of Harvey.[57] Refinery utilization along the Gulf Coast fell from in excess of 90 percent to approximately 60 percent.[58] More than 50 percent of U.S. output of basic petrochemicals was temporarily disrupted.[59] The refinery outages resulting from Harvey-related shutdowns led to a temporary increase in U.S. gasoline prices of 28 cents.[60]
In the aftermath of this storm, Gulf Coast cities as well as the state of Texas and various federal agencies have been working together to undertake multibillion-dollar investments to upgrade reservoir and flood mitigation infrastructure to better protect the region (residents and businesses) in the event of future weather events.
Impact on Water Supplies, Flooding and Agriculture
Climate change is expected to increase dryness in the Eleventh District as temperatures rise, as well as increase the frequency and intensity of heavy precipitation.[61] For the agriculture sector, this increased weather variability will naturally lead to increased agricultural production variability and risk. These trends may also lead to challenges relating to water availability in the state.
According to the U.S. Department of Agriculture, “drought is the leading driver of production risk in U.S. agriculture … [as it] can reduce crop yields, lead farmers to cut back planted or harvested acreage, reduce livestock productivity, and increase costs of production inputs such as animal feed or irrigation water.”[62] For the livestock sector—which accounts for more than 60 percent of agricultural production in Texas[63]—drought effects are often felt over multiple years due to the resulting pasture damage and herd reduction that take years to recover from.
In Texas, where farm employment makes up approximately 1.6 percent of employment, and farm output makes up approximately 0.4 percent of state GDP,[64] agricultural losses from the historic 2011 drought were estimated to be in excess of $7 billion, accounting for about 40 percent of the average value of agricultural production and far exceeding loss estimates from any prior drought on record.[65] Droughts also induce additional indirect effects from reduced agribusiness activity in drought years—fertilizer, crop storage, machinery—plus the decrease in expenditures in the local economy resulting from lost income for producers, harvest laborers, truck drivers and agribusinesses.
Heavy precipitation, which is expected to continue to increase in both frequency and intensity as climate change progresses,[66] also causes problems for agriculture, as seen this year in Texas and in other parts of the country. When flooding happens early in the season, fields become too wet for farmers to prepare the soil and plant crops, causing delays which lead to reduced yields or crop substitution. Flooding late in the season causes harvest delays and crop quality issues, which both hamper farm income. Hotter temperatures prompted by climate change also pose additional pest problems for farmers, driving up pesticide use and costs, and hamper livestock productivity—increasing time to grow animals to a given weight and decreasing calving rates and milk production.[67]
The inherent risks in the agriculture industry may be exacerbated by climate change, which could make it more difficult for agricultural producers to get sufficient financing and insurance. As crop yields become more variable, lenders may become more concerned about repayment of crop production loans and tighten their lending standards and terms. Also, insurance costs will go up as insurers have more indemnities to pay out from droughts or floods. Adaptations in the agricultural sector to mitigate the impact of drought cycles include planting more drought-resistant crops, increasing irrigation, and technological advances in water retention and irrigation application. In Texas, we may see a shift to more cotton acreage, as cotton can tolerate more heat than grain crops and has a wider time frame for planting and harvesting, which is beneficial in times of flooding.
Besides increased hurricane intensity and greater risk of drought, climate change may have additional impacts that could affect our district. Increased temperatures are likely to have an adverse effect on people’s health and quality of life.[68] They will likely lead to increased water evaporation and soil moisture deterioration, as well as aquifer drawdowns.[69] Increased ocean acidity and warming will affect aquatic life, impacting the commercial and recreational fishing industries along the Gulf Coast.[70]
Conclusion
The purpose of this appendix has been to lay out key elements of the National Climate Assessment and discuss some of the potential implications of severe weather events for the Eleventh District. Dallas Fed economists will continue to carefully monitor and consider the impact of climate change on economic and financial conditions in the district and the nation.
Notes
- Federal Open Market Committee statement, Federal Reserve Board of Governors press release, June 19, 2019.
- Data are from the Bureau of Economic Analysis (BEA), Federal Reserve Board and Haver Analytics. Household debt is from the Federal Reserve Board’s flow of funds series and is defined as households and nonprofit organizations; debt securities and loans; liability.
- Data are from the BEA.
- Texas Business Outlook Surveys, Federal Reserve Bank of Dallas, June 24, 2019.
- See “Business Debt and Our Dynamic Financial System,” speech by Jerome H. Powell at the 24th Annual Financial Markets Conference, May 20, 2019.
- As of May 2019. Data are from the Bureau of Labor Statistics (BLS).
- BLS employment projections and Federal Reserve Bank of Dallas analysis.
- See note 6.
- Growth in average hourly earnings over the 12 months ending in May 2019. Data are from the BLS.
- See note 6.
- “U.S. Real Wage Growth: Slowing Down with Age,” by Robert Rich, Joseph Tracy and Ellen Fu, Federal Reserve Bank of New York Liberty Street Economics, Sept. 28, 2016.
- Data are from the BLS Current Population Survey and Establishment Survey. For a further description of the differences in calculations, see “Is Wage Growth Higher than We Think?” by Michael Morris, Robert Rich and Joseph Tracy, Federal Reserve Bank of Dallas Dallas Fed Economics, Feb. 26, 2019.
- Texas Business Outlook Surveys, Federal Reserve Bank of Dallas, May 28, 2019.
- See note 1.
- As of May 31, 2019. Data are from the BEA.
- As of May 31, 2019. Data are from the Federal Reserve Bank of Dallas.
- See “Which Core to Believe? Trimmed Mean Versus Ex-Food-and-Energy Inflation,” by Jim Dolmas and Evan Koenig, Federal Reserve Bank of Dallas Dallas Fed Economics, May 28, 2019. Also see “Room to Grow? Inflation and Labor Market Slack,” by Jim Dolmas and Evan Koenig, Federal Reserve Bank of Dallas Dallas Fed Economics, May 30, 2019, and “Two Measures of Core Inflation: A Comparison,” by Jim Dolmas and Evan Koenig, Federal Reserve Bank of Dallas Working Paper no. 1903, February 2019.
- In very simplified terms, the Phillips curve suggests that inflation is higher when unemployment is low and lower when unemployment is high, conditional on stable inflation expectations. The logic supporting the Phillips curve is that when there are lots of unfilled jobs and few unemployed workers (i.e., a tight labor market with little slack), employers will have to offer higher wages, boosting inflation, and vice versa.
- Data are from the Database of Global Economic Indicators, Haver Analytics and Consensus Forecasts. Calculations are based on a representative sample of 40 countries, aggregated using gross domestic product at PPP (purchasing power parity) weights on an annual average basis.
- Data are calculated as a four-quarter moving average as of first quarter 2019. Data are from the BEA, Deutsche Bundesbank, Economic and Social Research Institute, Cabinet Office, National Bureau of Statistics China, State Administration of Foreign Exchange and Haver Analytics.
- See “S&P 500 Global Sales,” by Howard Silverblatt, S&P Dow Jones Indices, 2018.
- See “Intra-Industry Trade with Mexico May Aid U.S. Global Competitiveness,” by Jesus Cañas, Aldo Heffner and Jorge Herrera Hernández, Federal Reserve Bank of Dallas Southwest Economy, Second Quarter, 2017.
- See “Gone to Texas: Migration Vital to Growth in the Lone Star State,” by Pia Orrenius, Alexander T. Abraham and Stephanie Gullo, Federal Reserve Bank of Dallas Southwest Economy, First Quarter, 2018. Also see “Texas Top-Ranked State for Firm Relocations,” by Anil Kumar and Alexander T. Abraham, Federal Reserve Bank of Dallas Southwest Economy, Fourth Quarter, 2018.
- Data are from Moody’s Analytics.
- See “Mental Health Services Still Needed at Houston Schools in Wake of Recent Storms,” by Rebecca Hazen, Houston Chronicle, May 20, 2019. Also see “Survey Finds Extensive Mental, Physical Health Impacts of Hurricane Harvey,” by Leah Binkovitz, The Kinder Institute, Rice University, Feb. 21, 2019, and “A Year After Hurricane Harvey, Houston’s Poorest Neighborhoods Are Slowest to Recover,” by Manny Fernandez, New York Times, Sept. 3, 2018.
- Data are from the U.S. Energy Information Administration (EIA). Also see “Wind Power a Growing Force in Oil Country,” by Justin J. Lee and Kelvinder Virdi, Federal Reserve Bank of Dallas Southwest Economy, Second Quarter, 2017.
- The Federal Reserve Banks of Dallas and Kansas City are organizing a joint conference on Energy and the Economy: Markets in Transition on Oct. 17–18, 2019, which will address topics related to the energy transition and renewable energy. They are also planning the annual Federal Reserve System Energy Meeting, in which research on energy, commodities and environmental economics is shared within the System. As scientific committee members, Dallas Fed staff are in charge of selecting papers on climate change for the Workshop on Commodities and Macroeconomics of the Central Bank Research Association on Sept. 26–27 in Rome. The Dallas Fed’s Community Development function has prioritized disaster preparedness and recovery in its efforts to promote the economic resilience and mobility of underserved and lower-income neighborhoods. These efforts include several publications, which can be found here. Community Development has also hosted and presented at convenings of bankers and community organizations on the topic of inclusive disaster recovery across the Federal Reserve Eleventh District and the country.
- The Dallas Fed and its branches in Houston, San Antonio and El Paso are using more than 38 million kilowatt-hours of Texas wind power annually, which represents 100 percent of the Eleventh District’s total electric power needs. The district is the first in the Federal Reserve System to be 100 percent powered by wind energy. See “Dallas Fed Joins EPA’s Green Power Partnership,” Federal Reserve Bank of Dallas news release, April 3, 2019.
- As of June 24, 2019.
- See “GCRA Mandate” on the Global Change Research Act, U.S. Global Change Research Program (USGCRP).
- Review of the Draft Fourth National Climate Assessment, National Academies of Sciences, Engineering and Medicine, Washington, D.C.: National Academies Press, 2018, via Fourth National Climate Assessment, Volume II: Impacts, Risks, and Adaptation in the United States, David Reidmiller et al., eds., USGCRP, Washington, D.C.: U.S. Government Publishing Office, 2018.
- Fourth National Climate Assessment, Volume II: Impacts, Risks, and Adaptation in the United States, David Reidmiller et al., eds., USGCRP, Washington, D.C.: U.S. Government Publishing Office, 2018, p. 36.
- See note 32, p. 36.
- See note 32, p. 39.
- See note 32, p. 73.
- See Fourth National Climate Assessment, Volume I: Climate Science Special Report, by Donald J. Wuebbles et al., Washington, D.C.: U.S. Global Change Research Program, 2017, pp. 185–206 and 35–72. Also see “Continental-Scale Temperature Variability During the Past Two Millennia,” PAGES 2k Consortium project, Nature Geoscience, vol. 6, no. 5, 2013, pp. 339–46, via note 32, p. 76.
- See note 32, p. 42.
- See note 32, p. 43.
- See note 32, p. 76.
- See note 32, p. 37.
- See note 32, p. 88.
- See note 32, p. 74.
- See note 32, p. 74.
- See note 32, p. 97. Also see “Global Projections of Intense Tropical Cyclone Activity for the Late Twenty-First Century from Dynamical Downscaling of CMIP5/RCP4.5 Scenarios,” by Thomas R. Knutson, Joseph J. Sirutis and Ming Zhao, Journal of Climate, vol. 28, no. 18, 2015, pp. 7,203–224. For detail about how hurricanes are categorized, see Saffir-Simpson Hurricane Wind Scale.
- See note 32, p. 47.
- See note 32, p. 45.
- See note 32, p. 91.
- Data are from the National Oceanic and Atmospheric Administration (NOAA).
- See note 32, p. 74.
- See note 32, p. 996.
- See note 32, p. 996.
- See note 32, p. 47.
- Data are from the National Weather Service and NOAA.
- See note 24.
- See “National Hurricane Center Tropical Cyclone Report, Hurricane Harvey,” by Eric S. Blake and David A. Zelinsky, National Hurricane Center, May 9, 2018.
- Data are from the BLS and Federal Reserve Bank of Dallas.
- Bureau of Safety and Environmental Enforcement, U.S. Department of the Interior press release, Aug. 26, 2017.
- Data are from the EIA.
- See “Harvey Disrupts More than One-Third of U.S. Chemical Production,” by Jack Kaskey, Bloomberg, Aug. 28, 2017. Also see “Harvey Has Made the World’s Most Important Chemical a Rare Commodity,” by Jack Kaskey, Bloomberg Businessweek, Aug. 31, 2017.
- The gasoline price increase is calculated using the weekly average price across all formulations of gasoline between Aug. 28 and Sept. 4, 2017. Data are from the EIA with calculations by the Federal Reserve Bank of Dallas.
- See note 32, p. 1,004.
- See “Farmers Employ Strategies to Reduce Risk of Drought Damages,” by Steven Wallander, Elizabeth Marshall and Marcel Aillery, Amber Waves, U.S. Department of Agriculture (USDA), June 5, 2017.
- Livestock refers to animals and products. Data are from the USDA, 2017.
- Agriculture refers to farms. Data are from the BEA, 2017.
- See “Updated 2011 Texas Agricultural Drought Losses Total $7.62 Billion,” by Blair Fannin, AgriLife Today, Texas A&M AgriLife, March 21, 2012.
- See note 32, p. 88.
- Much of the content of this paragraph and the following paragraph was informed by Federal Reserve Bank of Dallas discussions with contacts in the Eleventh District.
- See note 32, p. 989.
- See note 32, pp. 996, 1,001–03.
- See note 32, pp. 1,009–11.
About the Author
Robert S. Kaplan was president and CEO of the Federal Reserve Bank of Dallas, 2015–21.
The views expressed are my own and do not necessarily reflect official positions of the Federal Reserve System.
I would like to acknowledge the contributions of Tyler Atkinson, Alexander Chudik, Jackson Crawford, Jim Dolmas, Marc Giannoni, Stephanie Gullo, Evan Koenig, Emily Kerr, Anthony Murphy, Michael Morris, Demere O’Dell, Pia Orrenius, Keith Phillips, Laton Russell, Amro Shohoud, William Simmons, Martin Stuermer, Kathy Thacker, Joe Tracy, Mark Wynne, and Mine Yücel in preparing these remarks.