
Is Wage Growth Higher than We Think?
There is always widespread interest in the degree to which the U.S. labor market generates higher pay for workers. A standard measure of wage growth suggests that this expansion is not improving the standard of living of workers, but our analysis reveals that actual wage growth is understated.
Average hourly earnings, or AHE—reported monthly by the Bureau of Labor Statistics (BLS)—is a commonly referenced measure of wage growth. AHE growth has picked up over the past few years as labor markets have tightened. However, when inflation is factored in, workers appear to have experienced only modest real wage growth.
If this calculation is correct, an implication would be that it is difficult for workers to realize significant increases in their real purchasing power even when labor markets are relatively tight.
To investigate this, we examine how the AHE is constructed and why this measure leads to a conservative estimate of underlying wage growth. When we compare AHE growth from the BLS with a measure of individual wage growth derived using Current Population Survey (CPS) data from the Census Bureau, the magnitude of the understatement becomes apparent.
Because AHE has a central role in wage growth analyses, we show that actual wage growth is higher than we think. In a subsequent article, we will show that the average growth of individual wages is likely even stronger than the measure constructed using CPS data.
How BLS calculates average hourly earnings
AHE is based on BLS’ monthly survey of more than 440,000 establishments. Each establishment reports employment, payroll expenses and hours for the pay period covering the 12th day of the month for private, nonfarm nonsupervisory workers. (Payroll expenses are payments before deductions and include overtime, paid holidays, commissions, vacation and sick leave).
The BLS calculates average hourly earnings as aggregate payroll expenses divided by aggregate hours. That is, AHE represents the overall average implied wage rate for workers covered in the survey.
To reduce the statistical “noise” and highlight the trend in wage growth, we obtain a smoothed quarterly series by first averaging 12-month growth rates for the three relevant months in a quarter and then applying a four-quarter moving average.
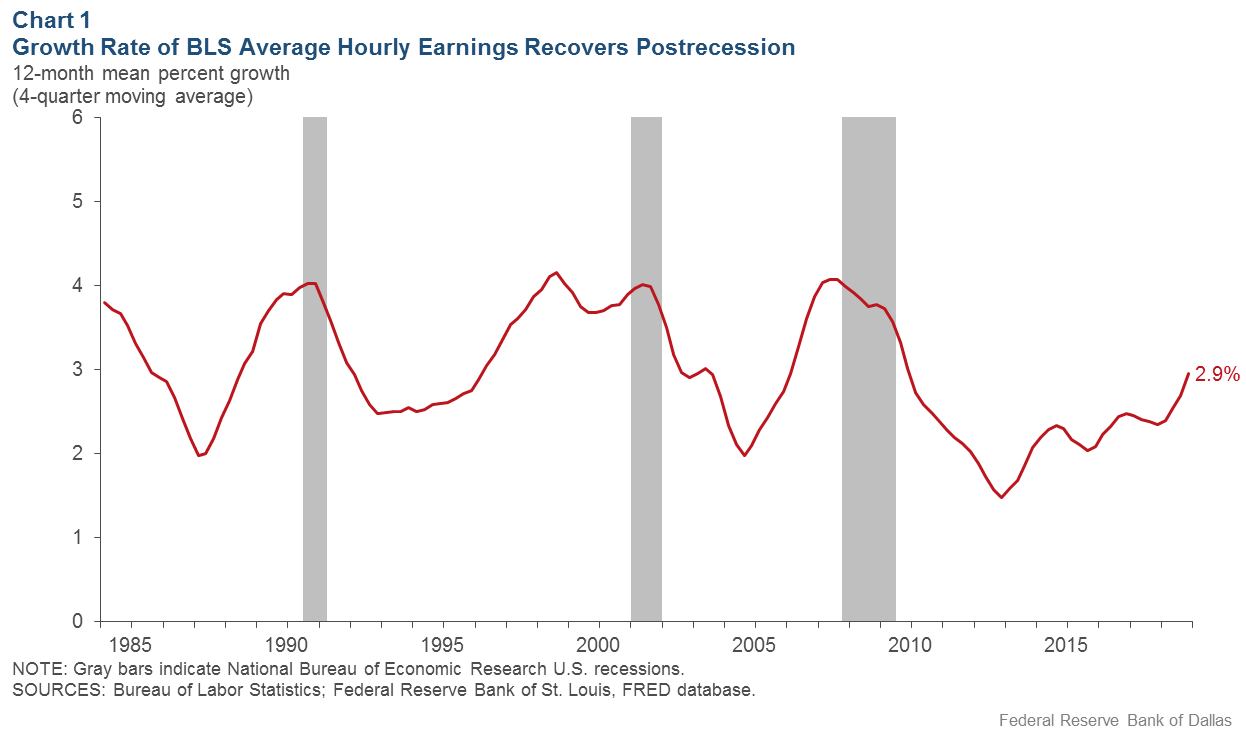
Using BLS data, Chart 1 plots the smoothed quarterly AHE from 1984 to present. Growth in AHE slows considerably following a recession and accelerates as economic expansion reduces the unemployment rate. Over the current cycle, the four-quarter average growth in AHE reached a low of 1.5 percent in 2012 and stood at 2.9 percent recently. When interpreting the latest reading as the average wage growth and 2 percent as the average inflation rate, it appears that, despite the low unemployment rate, workers’ real wages are only growing 0.9 percent.
Hourly earnings, average wage growth differ
AHE wage growth is not the same as the average wage growth that workers experience. It reflects the “earnings share” weighted average growth in wages and hours, as well as “composition effects” arising from earnings differences between individuals entering and exiting the workforce.
For example, consider the case where hours of work for individuals are constant and no individuals enter or exit working over a 12-month period. In this case, there are no composition effects and growth in AHE is an “earnings share” weighted average of individual wage growth rates. That is, AHE growth weights a worker’s wage growth by that individual’s earnings as a share of total earnings.
As such, the wage growth for workers with relatively high earnings receives greater weight in the AHE calculation than if the weight were the same for all workers.
Life-cycle wage growth
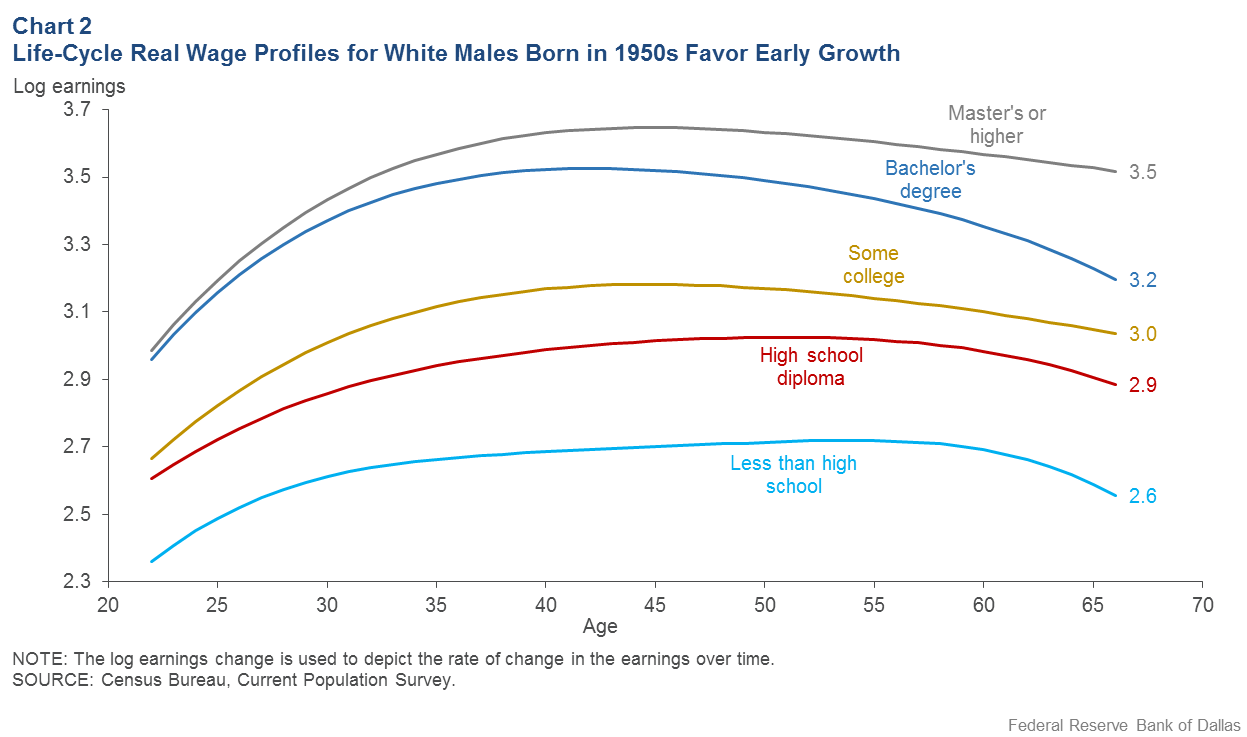
When interpreting AHE growth, it’s important to consider the relationship between the level of a worker’s wage and subsequent wage growth. A common feature of such life-cycle wage profiles is that high wage growth is concentrated early in an individual’s career when the wage level is relatively low (see Chart 2 for profiles of cohorts of white males born in the 1950s). This creates a negative relationship between the wage level and subsequent wage growth.
In other words, workers with a relatively low earnings share will tend to have relatively high earning growth. This negative relationship implies that AHE growth will typically be lower than average individual wage growth.
Constructing an earnings measure with CPS data
Worker data from the Current Population Survey help verify the validity and importance of this claim. The CPS is a monthly household survey of approximately 50,000 individuals used to compute the unemployment rate. Households are interviewed for a total of eight months. They are initially interviewed for four consecutive months, not interviewed for the next eight months and then re-interviewed for the next four months.
We followed individuals from their fourth and eighth interviews—covering a 12-month period. To align coverage with the BLS establishment data, we look at individuals employed in the private nonagricultural sector and holding nonsupervisory jobs.
Individuals paid by the hour report their hourly wage; salaried workers report their usual weekly earnings. Everyone reports their usual weekly hours. Salaried workers’ wages are estimated by dividing the usual weekly earnings by the usual weekly hours. The CPS survey does not follow individuals who change residence.
Comparing two measures of hourly earnings
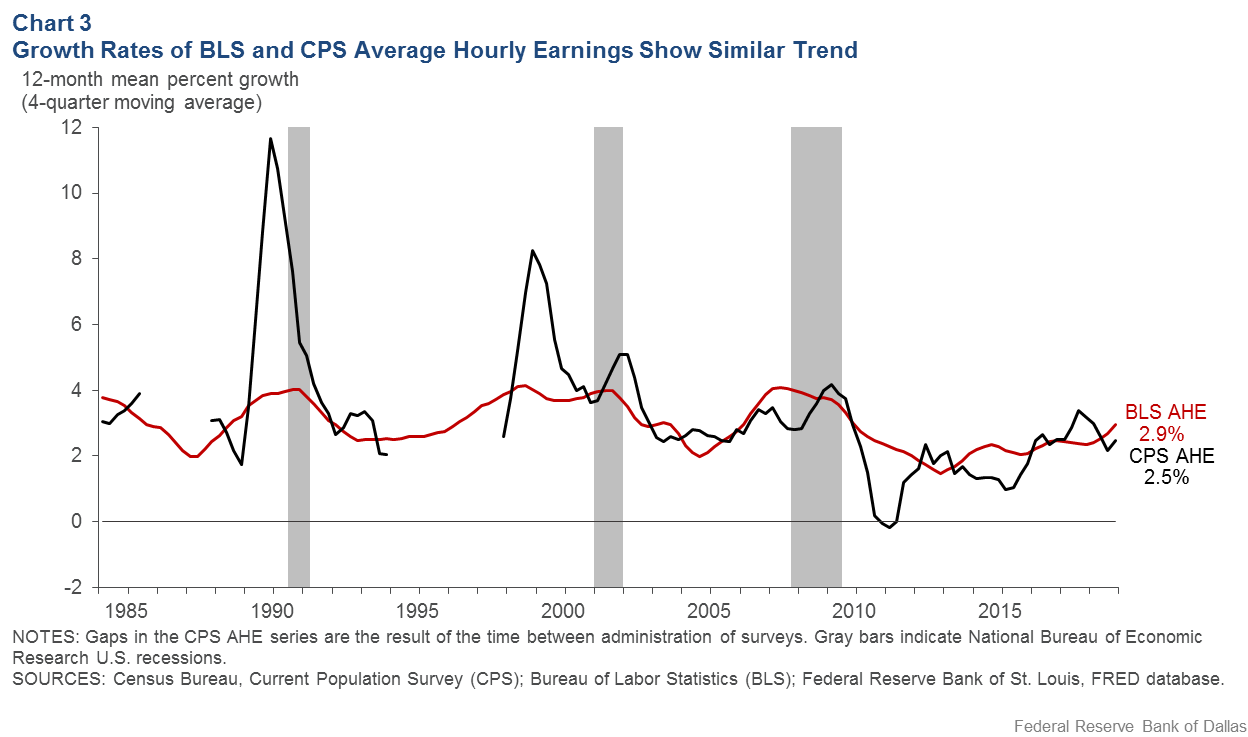
To ensure the comparability of the CPS household and BLS establishment data, we construct a CPS-based analog to the BLS AHE that uses the same four-quarter average of 12-month growth rates. Chart 3 provides a comparison of the official BLS AHE growth (as shown in Chart 1) to our CPS AHE growth.
Survey changes that prevent matching individuals across survey years produce gaps in the CPS series. Overall, the CPS AHE is more volatile than the BLS AHE, reflecting the relatively much smaller CPS survey size. Apart from two spikes in the CPS AHE in the late 1980s and late 1990s that do not appear in the BLS AHE, the two series generally track each other, and recent values for the two (smoothed) growth rates are very similar, thereby confirming the comparability of the underlying wage information.
The next task is to figure out how much the official BLS AHE growth may understate average individual wage growth. So we calculate the 12-month wage growth for every worker using CPS data and then the average across workers, applying the same smoothing procedure as before.
BLS data understate wage growth
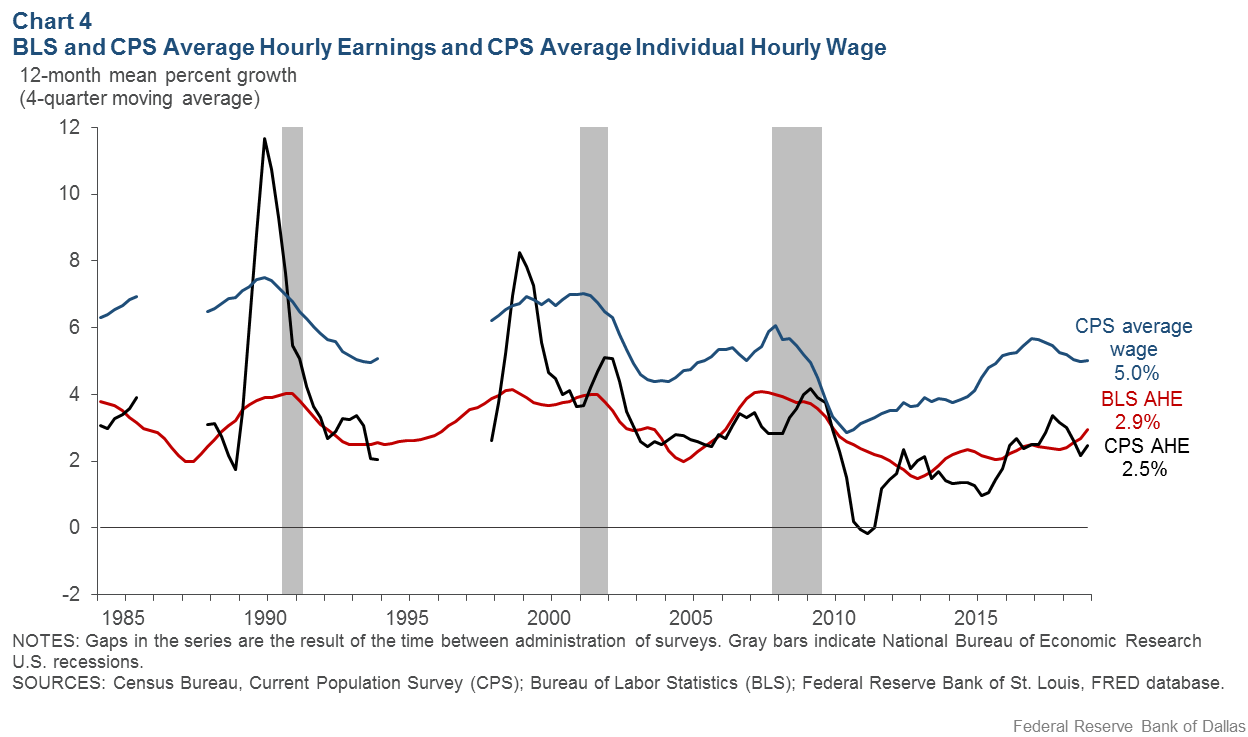
As seen in Chart 4, CPS average individual wage growth is always higher than AHE growth. Most recently, CPS average individual wage growth was 5.0 percent—a full 2.1 percentage points greater than the BLS’ AHE.
The important point from this comparison is that AHE growth significantly understates average individual worker wage growth. This indicates that, on average, recent real wage gains have been meaningful and are more consistent with recent historically low unemployment rates.
As we ask in the title: “Is Wage Growth Higher than We Think?” Given the prominence of AHE as a wage measure, wage growth is higher than we think—and by a notable amount.
About the Authors
The views expressed are those of the authors and should not be attributed to the Federal Reserve Bank of Dallas, the Federal Reserve Bank of Cleveland or the Federal Reserve System.