Income disparities between white and Hispanic and Black Texans seen from 2005 to 2019
This is the first installment in a two-part series. Read about income mobility by race and ethnicity in Part 2.
In the United States, a great deal of research has documented income disparities across racial and ethnic groups over time. If left unaddressed, those disparities could act as a headwind to future economic growth, especially given the country’s increasingly diverse population. To explain these disparities, scholars point to the legacy of discriminatory laws and practices. Researchers also point to ongoing differences in educational attainment and occupations as contributing to, and being influenced by, income gaps.[1]
Might these gaps have narrowed in recent years? The Income Distributions and Dynamics in America dataset provided by the Federal Reserve Bank of Minneapolis presents a new opportunity to examine income gaps by geography, race and ethnicity, and socioeconomic status. In this article, we explore income gaps by race and ethnicity in Texas within four different earnings groups: very low income, low income, low-to-middle income and high income.[2] Within each group, we examine the relative earnings of Black, Hispanic, Asian, American Indian or Alaska Native (AIAN), and Native Hawaiian or Other Pacific Islander (NHOPI) Texans compared with white Texans.[3]In the first of this two-part series, we look at relative earnings within our four income groups to investigate how income disparities by race and ethnicity might play out differently in these various contexts within our state. Could it be that these disparities disappear once we look at the highest-income Texans? Or could very-low-income Texans of all races and ethnicities be in the same metaphorical boat when it comes to annual earnings? Exploring the circumstances in which these disparities shrink and widen can shed light on how different demographics within discrete socioeconomic groups experience Texas’ economy.
Comparing relative earnings by race and ethnicity
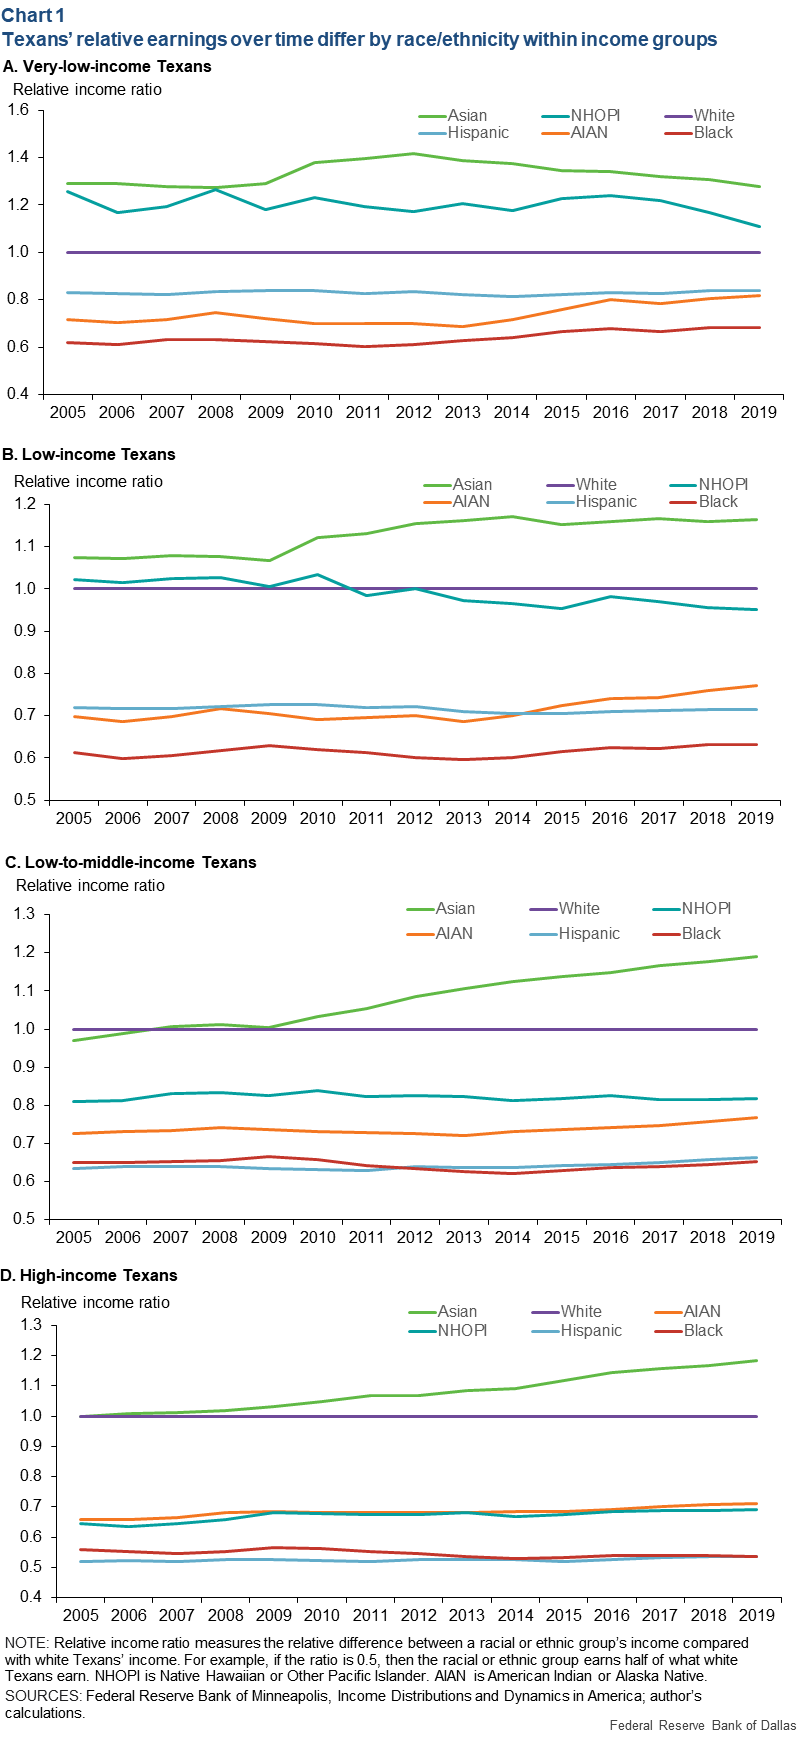
Chart 1A shows the racial and ethnic income gap among very-low-income Texans. “Very low income” in this study refers to earners in the 10th percentile, or lowest-earning one-tenth, of Texans for each demographic. The data are available from 2005 to 2019.
In this income group, the relative earnings for Hispanic Texans have barely budged since 2005. Very-low-income Black and AIAN Texans saw their relative earnings increase, while very-low-income Asian and NHOPI Texans saw their relative earnings decline. It is worth emphasizing that even increases in relative earnings among this income group result in very low annual earnings, which ranged from $3,245 for Black Texans to $6,075 for Asian Texans in 2019.[4]
Chart 1B looks at relative earnings for low-income Texans who are in the 25th percentile, or lowest-earning quarter, for each demographic group. Relative to low-income white Texans, earnings for low-income Blacks and Hispanics have hardly changed since 2005. Low-income AIAN Texans saw their relative earnings increase modestly, while low-income NHOPI Texans’ relative earnings fell somewhat. Low-income Asians saw their relative earnings rise a fair amount, especially after 2009.
Chart 1C shows relative earnings among low-to-middle-income Texans, whose income is in the 50th percentile, or bottom half of all earnings. Black and NHOPI Texans saw virtually no change in this income group, while Hispanic and AIAN Texans saw modest growth. Asian Texans again saw high growth in their relative earnings.

While this series focuses on the outcomes for low-earning individuals, it is worth demonstrating that these racial and ethnic disparities persist, and in some cases even worsen, in the highest-income group. Chart 1D shows relative earnings for the top 5 percent of earners, or the 95th percentile. Even among the highest-income group, Black Texans’ relative earnings actually declined, while Hispanic, AIAN and NHOPI Texans saw little-to-modest growth. Once again, Asian Texans experienced high growth in their relative earnings.
Relative earnings have only increased for some
Within each income group, we see how people within different demographics experience disparate trends in their relative income from 2005 to 2019:
- Low-income and low-to-middle-income Black Texans experienced hardly any increase in relative earnings, while high-income Black Texans actually experienced a decline.
- Hispanic Texans saw little to no difference in relative earnings in any income category, except for low-to-middle-income Hispanics, who saw a slight bump.
- Asian Texans saw high growth in their relative earnings in all income groups except very-low-income Asians, who saw a decline.
- Native Hawaiian or Pacific Islander Texans saw their overall relative earnings ratio decline with each higher-earning income group.
- Despite seeing modest-to-high growth in relative earnings within each income group, American Indian and Alaska Native Texans still saw low relative earnings compared with white Texans.
These data show that within each income cohort, income inequality largely persists across race and ethnicity. The next article in the series will examine how frequently people are able to move across income cohorts and the resulting impact on income inequality.
Notes
- It is worth noting that racial disparities in income persist within similarly educated groups. For example, in 2016, the median annual income of young Black and Hispanic workers with a bachelor’s degree was about $5,300 less than the median annual income of a young white worker with a bachelor’s degree.
- One of the advantages of this dataset is its large sample of comparatively small racial and ethnic groups such as Asians, Native Hawaiians or Other Pacific Islanders (NHOPI), and American Indians or Alaska Natives (AIAN). Given their relatively small size, members of these groups are often lumped together in a single “Other” racial and ethnic category, but these data allow us to confidently capture each group’s income in addition to other larger demographic groups.
- In this study, the Hispanic demographic group includes members of various racial groups. Other racial groups in this study consist of non-Hispanic individuals. For simplicity, we simply refer to these groups as white, Black, Asian, AIAN and NHOPI.
- Adjusted for inflation to 2019 dollars.
About the author


