Energy Indicators

June 3, 2022
Natural gas prices have been rising as inventories wane. Exports of natural gas are at record levels and set to grow further in the second half of 2022. U.S. chemical industry barometers show robust utilization, production and margins as rising input costs pass through to customers.
Natural gas
Prices way up
Global natural gas prices have risen sharply over the past year, and domestic prices have not been immune to strong demand, waning inventories and the impact of Russia’s invasion of Ukraine.
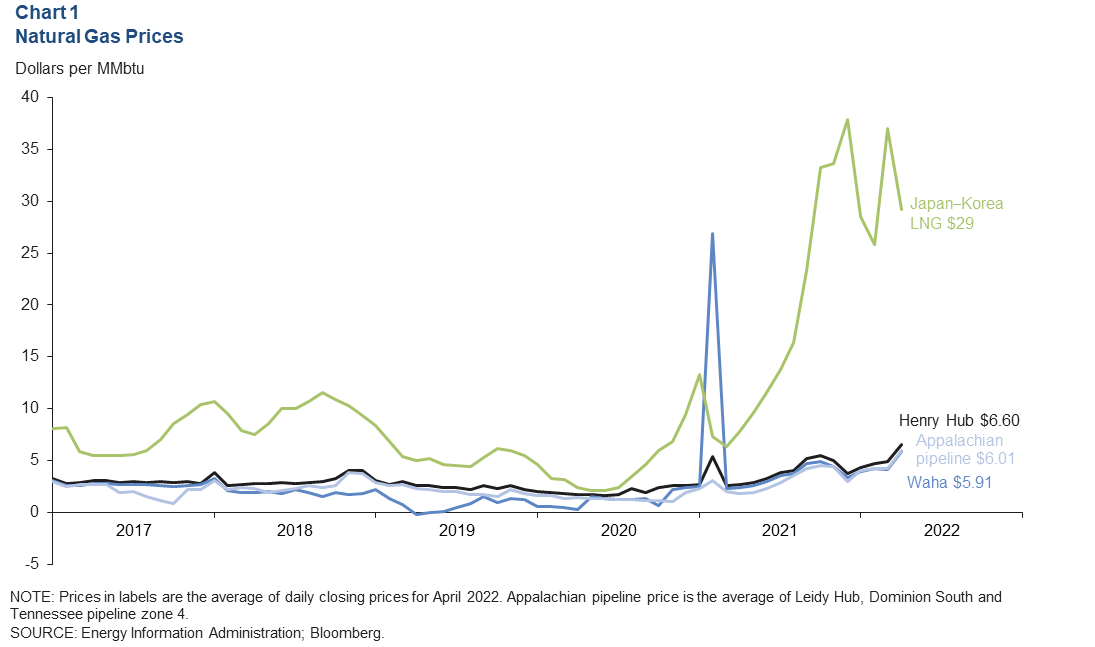
Natural gas prices in Europe have soared to over $30 per million British thermal units (MMbtu) as flows from Russia lag demand. Buyers seeking other gas resources bid up the benchmark Japan–Korea marker for liquefied natural gas (LNG) to average $29 in April.
Soaring global LNG prices and exports, tepid U.S. production growth and strong domestic demand lifted Henry Hub to $6.60 in April. The U.S. benchmark was trading between $7 and $8 over the first half of May (Chart 1). That’s more than double the average nominal price level this past decade but still well below price in Europe and Asia.
Along with rising exports, coal power plant outages and rising coal prices have contributed to elevated power sector demand for natural gas. Meanwhile, northeastern gas producers like those in the prolific Marcellus Shale have limited pipeline takeaway capacity with which to increase supplies despite higher prices; associated gas production growth (natural gas produced from oil wells) from regions like the Permian Basin has been limited by tepid spending growth in the oil sector.
Exports rising
Rising capacity and utilization are projected to take U.S. exports of LNG up from 11.6 billion cubic feet per day (bcf/d) in April 2022 to 13.4 bcf/d by December 2022 and then hold near those levels until new capacity comes online in 2024. Similarly, pipeline capacity to Mexico is also projected to rise, increasing total U.S. pipeline exports from 7.7 bcf/d to 9.2 bcf/d (Chart 2).
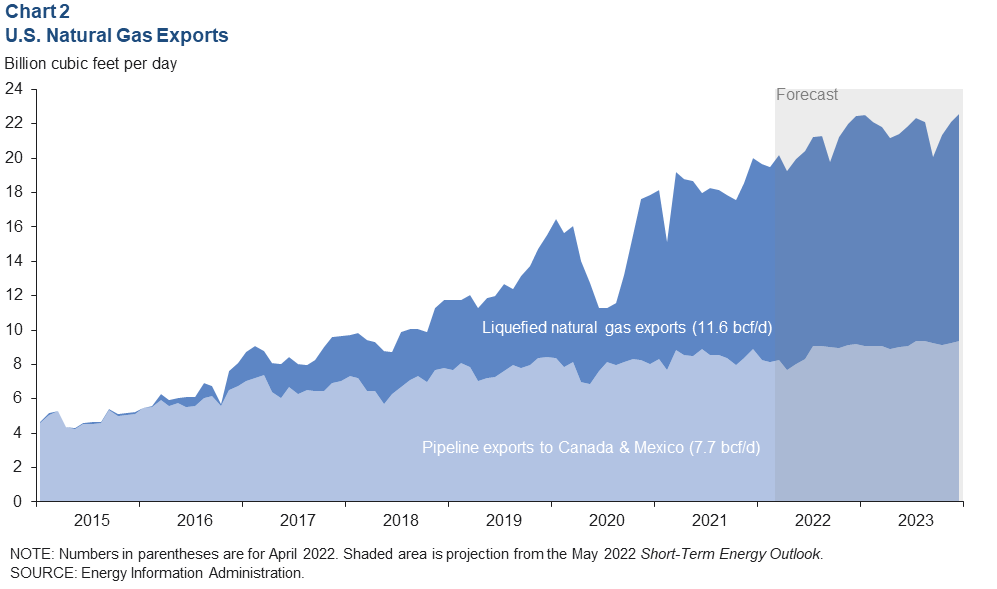
Altogether, the Energy Information Administration is projecting the combined 22.5 bcf/d of gas exports in December 2022 will account for 21 percent of U.S. marketed natural gas production, up from 18 percent in December 2021.
With rising exports, strong demand from the power sector and modest production growth, U.S. working inventories have rapidly fallen to a seasonally adjusted 2.1 trillion cubic feet of gas over the five months ending in April 2022—their lowest level since the cold winter of 2019.
Chemicals
Railcar loadings signal strong U.S. chemical production growth
The three-week average pace of chemical railcar loadings has eased from its recent peak of 35,000 on March 19 to 33,700 cars on May 14 (Chart 3). This implies that while domestic capacity utilization remains high, output has slowed modestly.
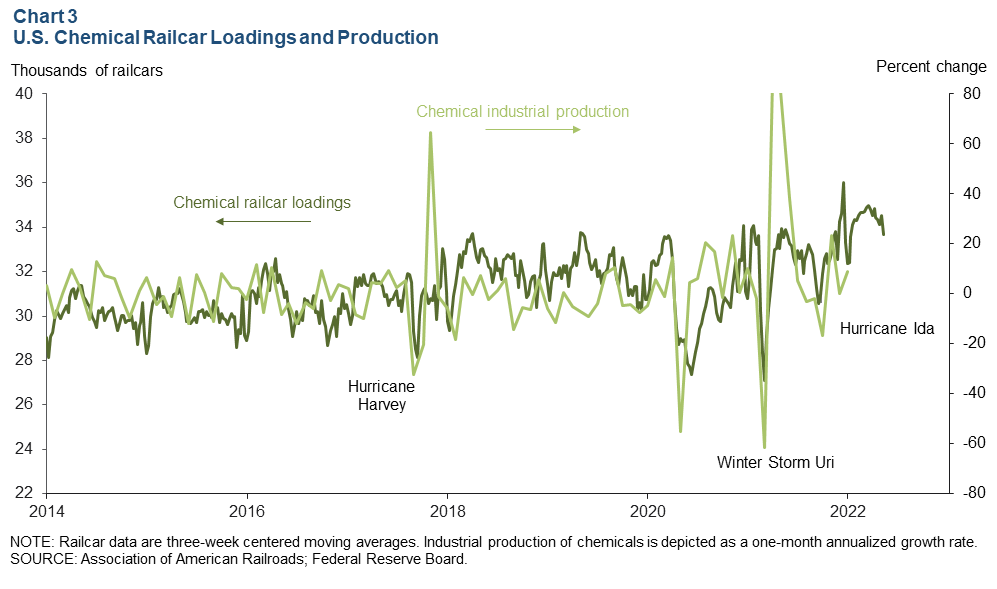
U.S. railcar loadings of chemicals are a timely but noisy barometer of sector production growth and capacity utilization. Rising prices and supply-chain challenges on land and water may be partly responsible for the slight softening. The sector’s early position near the front-end of manufacturing supply chains makes it a leading indicator for industrial production more broadly.
Polymer prices keep pace with rising costs
Recent increases in the price of natural gas have led to steady increases in ethane’s price per pound to 16.8 cents per pound—its highest nominal Gulf Coast price since October 2018 and March 2012 before that (Chart 4). Gulf Coast polymer (polyethylene) prices have risen with ethane costs to 61.2 cents per pound. Implied margins for industry product lines remain very healthy.
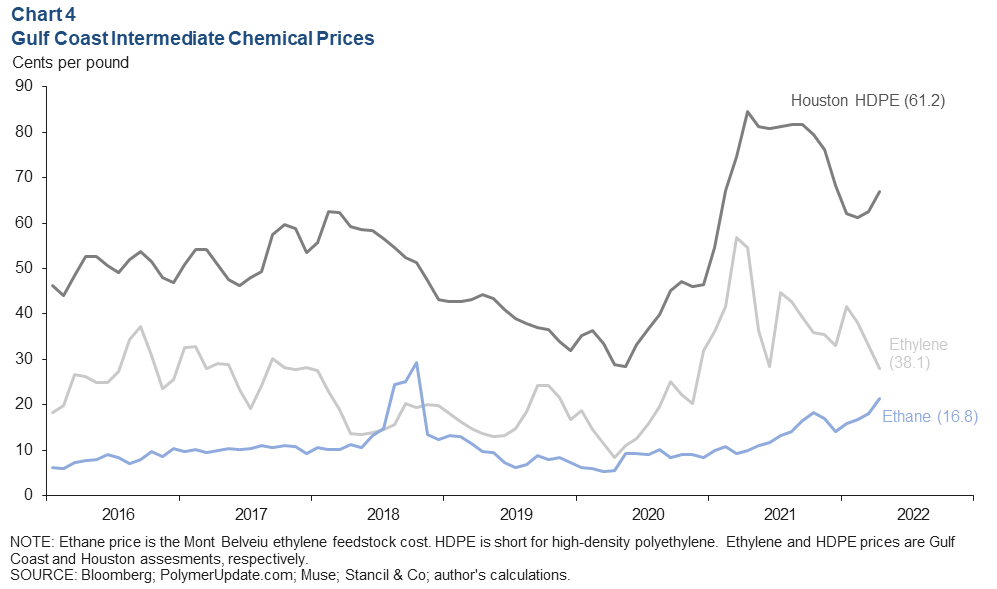
Ethane is a key raw material that can either be sold for combustion along with natural gas or separated and sold to petrochemical manufacturers. Last fall, new production capacity allowed ethylene and polymer prices to ease on the Gulf Coast. That has partly reversed since February with increases in global oil and gas prices.
Industry lead times for deliveries continue to extend for many product lines as supply-chain challenges over both land and water persist. Chemical producers have been able to broadly pass through recent cost increases so far, but industry comments in the Beige Book and the Purchasing Managers Index suggest further attempts to raise prices may be less successful for the remainder of 2022.
Chemical sector contributing to higher producer prices
The effects of higher energy and commodity input prices on the chemicals sector can be seen in Producer Price Index (PPI) components. Basic organic chemicals (like ethylene and benzene, which are inputs to many other products) saw a slight decline in February 2022 before Russia invaded Ukraine. Over the three months ending in April 2022, producer prices for organic chemicals rose 7.1 percent (Chart 5). Plastics and resins (like polymers), which had been easing since November 2021, rose 2.6 percent over the three months ending in April.
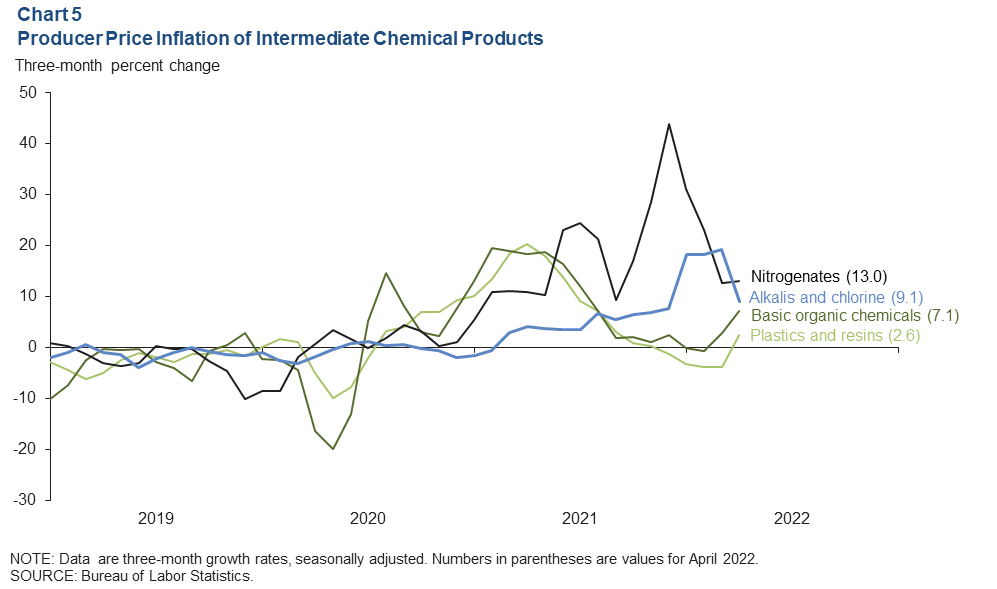
Alkalis and chlorine—which feed into myriad sectors like detergents, sanitation products, aluminum production, plastics and paper manufacturing—saw prices rise sharply over the winter months. Rising energy prices, lingering delivery backlogs tied to Hurricane Ida in the U.S. Gulf Coast, as well as unplanned outages and seasonal maintenance in China, Europe and the U.S., all helped drive costs skyward. The broad use of chlor-alkali products in industrial processes makes them an important indicator for trends in industrial production.
Nitrogenates are a small component of the chemical sector, but the price appreciation has been outsized. Nitrogenates are fertilizer components mostly made from ammonia, a high-nitrogen substance primarily synthesized from methane (natural gas) and air (which is 70 percent nitrogen by dry weight).
Sharp increases in natural gas prices in Europe, Asia and the U.S. have dramatically increased the price of nitrogen over the past year. The growth rate of the U.S. PPI for nitrogen peaked at 43.9 percent over the three months ending December 2021. It slowed to 13.0 percent by April 2022. Higher prices for nitrogen may contribute to higher food inflation in the months ahead as farmers reduce consumption (and thus yield) while attempting to pass through higher costs.
About Energy Indicators
Questions can be addressed to Jesse Thompson at jesse.thompson@dal.frb.org. Energy Indicators is released monthly and can be received by signing up for an email alert. For additional energy-related research, please visit the Dallas Fed’s energy home page.