Energy Indicators

December 14, 2022
Refiners continued to boost activity as the country moved into the winter heating season amid low inventories and high margins. U.S. refiners’ crack spreads hit record-setting levels in 2022 due to the surge in wholesale fuel prices.
Refining
Refinery processing near pandemic highs
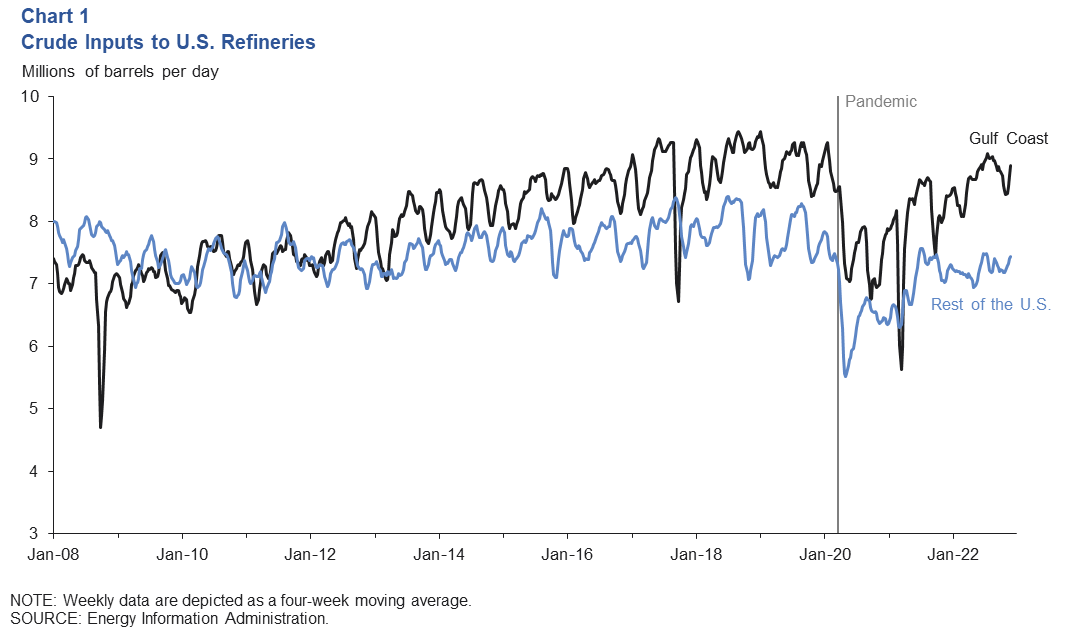
Refineries on the U.S. Gulf Coast processed roughly 8.9 million barrels of crude oil per day (mb/d) over the four weeks ending Nov. 25—the strongest since August 2022 and slightly above the seasonal high mark in summer 2021 (Chart 1). The volume of crude processed in the rest of the U.S. was 7.4 mb/d and has been trending up since July. U.S. utilization of refinery capacity is up to 95.2 percent for the week ending Nov. 25—effectively fully utilized. While there are no new building plans for refineries in the U.S., major expansions are underway in the Gulf Coast. One example is ExxonMobil’s Beaumont facility, which will add 250,000 barrels per day of light crude oil processing capacity in 2023.
Distillate inventories continue to drop
The U.S. continues to experience large weekly draws in crude supplies. There were 29 days of cover for distillate (the number of days that domestic inventories would likely last at the recent pace of consumption) at the end of November—five days below the five-year average (Chart 2). According to the Energy Information Administration (EIA), U.S. distillate stocks are at 112.6 million barrels, 9.1 percent below the year-ago level and 15 percent below the five-year average.
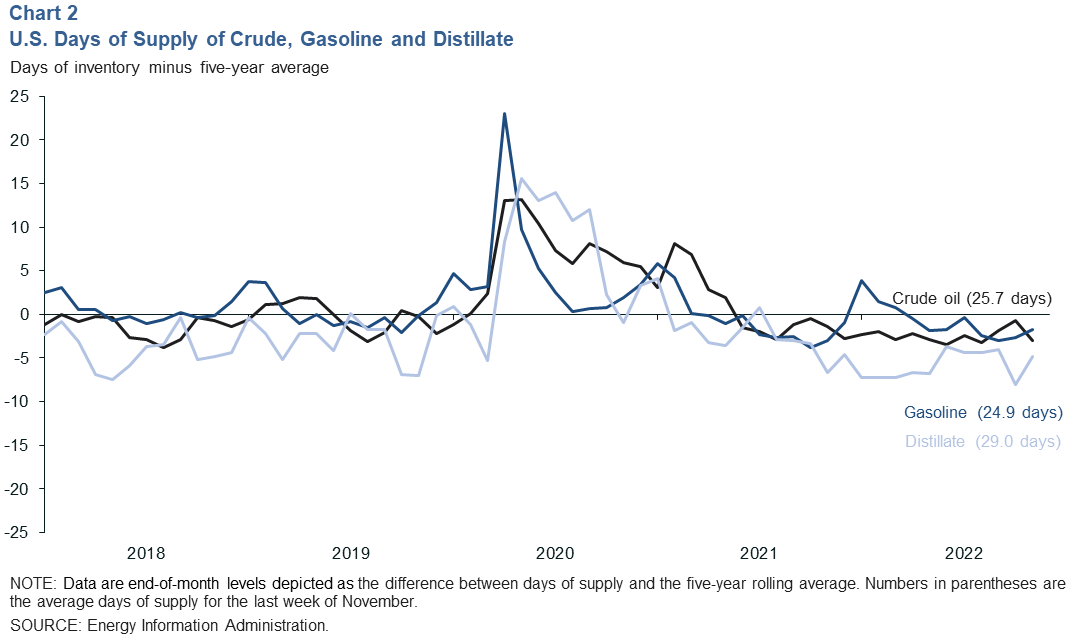
Stocks of motor gasoline totaled 206.6 million barrels at the end of October, 3.6 percent less than the year-ago level and 9 percent below the five-year average. However, gasoline stockpiles did jump 2.8 million barrels from the week of Nov. 18 to Nov. 25 to total 213.8 million barrels.
U.S. commercial crude oil inventories dropped due to an increase in refinery activity and slowing sales from the strategic reserves. The EIA reports U.S. crude oil stocks for the week of Nov. 25 were 808.2 million barrels. This is a decrease of 1.7 percent from last week and a decrease of 22.18 percent from a year ago.
Refining margins begin to ease from multiyear highs
The Brent crude 3:2:1 crack spread in New York was up by $28.94 from the start of this year to $45.23 for the week of Nov. 25 (Chart 3). That is 410 percent above the prepandemic average. However, all of the margin metrics remain below high points they hit earlier this year.
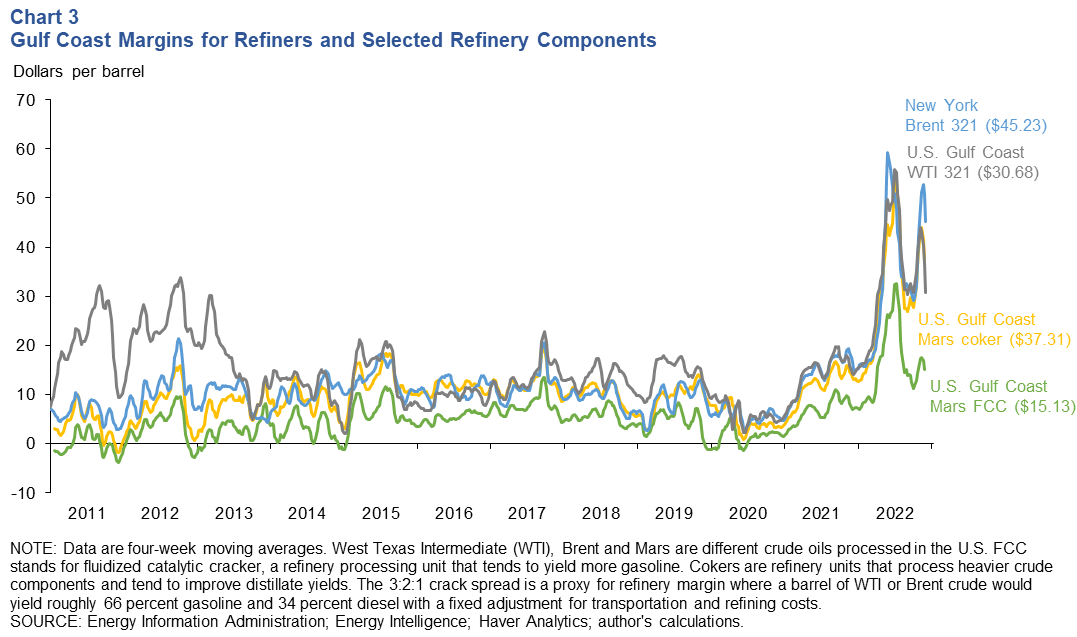
U.S. Gulf Coast Mars fluidized catalytic cracker—refinery components that are geared to yield more gasoline—showed the largest decline at 53.1 percent. In contrast, refiner margins for cokers—heavy-crude processing components in refineries that tend to yield more diesel—remain extremely strong, aided by the tight distillate market.
The West Texas Intermediate-Mars spread increased by 230 percent compared with a year ago but has come down a slight 3.9 percent since its May 2022 high of $5.15. Mars is a “medium-sour” crude, and it was sold at a deeper discount to West Texas Intermediate this year due to the Biden administration’s release of sour-crude barrels from the Strategic Petroleum Reserve.
U.S. refining crack spreads fell from record levels in early spring and began to pick back up in October, driven mainly by the tighter diesel market. Wholesale gasoline prices have dropped since spring, dragging gasoline margins down to more moderate levels.
Looking ahead, the European Union’s ban on Russian refined products could boost crack spreads if Russian supplies struggle to find markets outside of Europe come February.
Exports
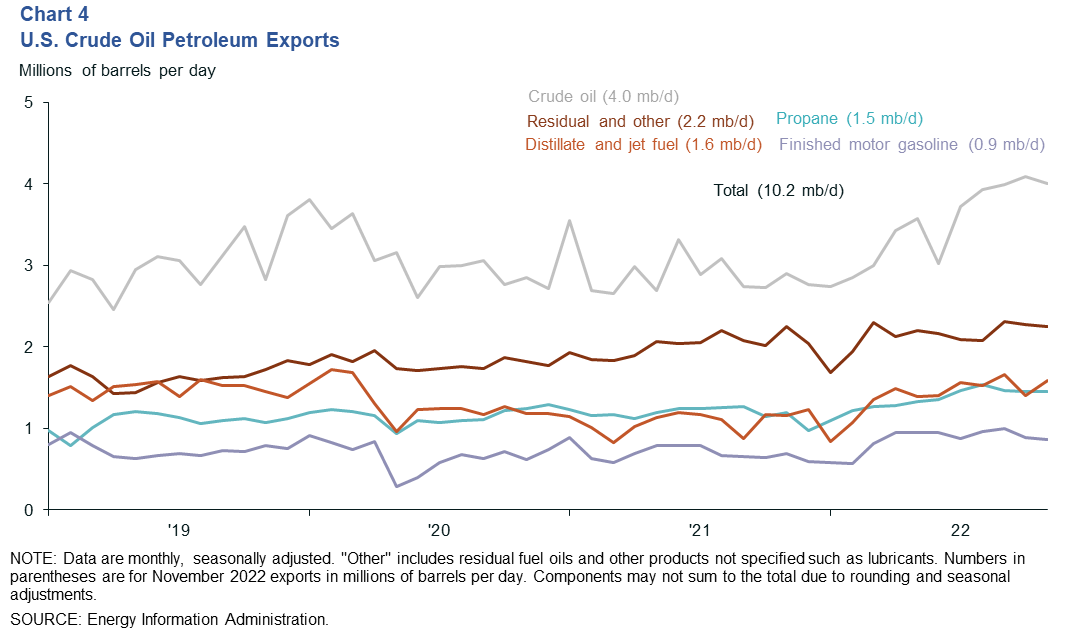
Global energy markets have been disrupted by Russia’s invasion of Ukraine, and the U.S. has stepped up its petroleum products exports. From December 2021 to November 2022, total U.S. crude oil petroleum exports increased by 1.23 million barrels a day (mb/d) (Chart 4).
Europe’s ban of Russian seaborne crude oil imports began on Dec. 5, and the refined oil products’ ban will begin on Feb. 5, 2023; this will likely draw more U.S. product exports to Europe in 2023.
Exports of propane and residual and other fuels have been steady near 1.45mb/d and 2.3 mb/d, respectively, since September. Distillate and hydrocarbon gas liquids (including propane) contributed the largest volumes to petroleum products’ export growth in the U.S. Propane saw the largest growth since the start of the pandemic, rising 28 percent since December 2019. Propane exports increased due to rising domestic production and expanded export capacity along the U.S. Gulf Coast.
Petrochemicals
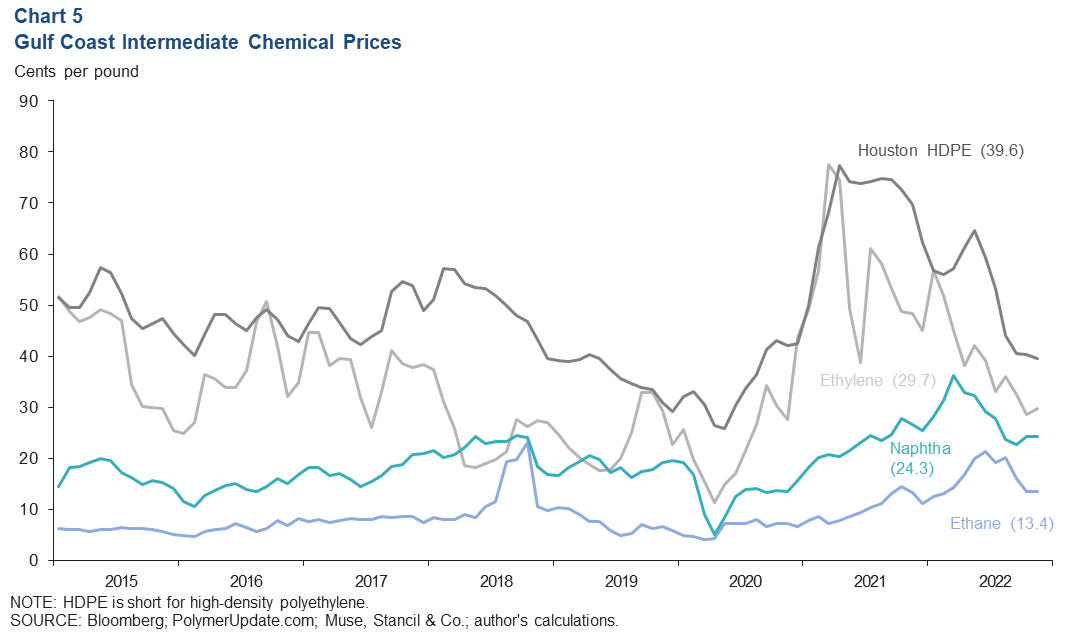
Recent declines in the price of natural gas have led to a decrease in ethane’s price to 13.4 cents per pound (ethylene feedstock cost) from a high of 21.3 cents per pound earlier this year (Chart 5). Naphtha hit a 14-year high in March 2022 but has slid significantly since then. The feedstock cost of naphtha has been trending down as well, due to easing Brent crude oil prices and weakening chemical plant demand in Europe and Asia. Ethylene prices have been on the decline also, falling from 44.9 cents per pound in December 2021 to 29.7 cents per pound in November 2022. Quarterly profits for the global petrochemical sector returned to average 2019 levels during third quarter 2022.
Currently, petrochemical feedstock accounts for 12 percent of global liquids (crude, condensate and natural gas liquids) demand. The International Energy Agency predicts that petrochemicals will account for more than one-third of the growth in world liquids demand by 2030 and half by 2050 in their base-case scenario.
About Energy Indicators
Questions can be addressed to Kenya Schott at kenya.schott@dal.frb.org. Energy Indicators is released monthly and can be received by signing up for an email alert. For additional energy-related research, please visit the Dallas Fed’s energy home page.