Energy Indicators

The annual U.S. Energy and Employment Report (USEER) from the Department of Energy shows solar dominated electricity generation employment in 2022 and petroleum lead fuels employment. The U.S. rig count is down, but payrolls in the oil and gas sector remain strong, which is beneficial for Texas because fossil fuel jobs are concentrated in the state. Fuel prices are rising, crude inputs into Gulf Coast refineries remain elevated, and distillate stocks continue to remain low.
Employment
Solar buildout dominates electric power generation jobs
New details on the breakdown of U.S. energy employment released in June in the USEER show the impact of solar energy growth. Solar is the largest employment category for electric power generation in the U.S. and gained the most jobs of any power generation type from 2021 to 2022, with 12,256 new positions, a growth rate of 3.7 percent. Construction jobs made up a third of all electric power generation payrolls because site-prep and installation are labor intensive relative to the other categories of work (Chart 1). Sixty percent of those construction jobs were in solar. In 2022, solar, or photovoltaic, installations accounted for 46 percent of all new generation in the U.S., according to the Energy Information Administration.
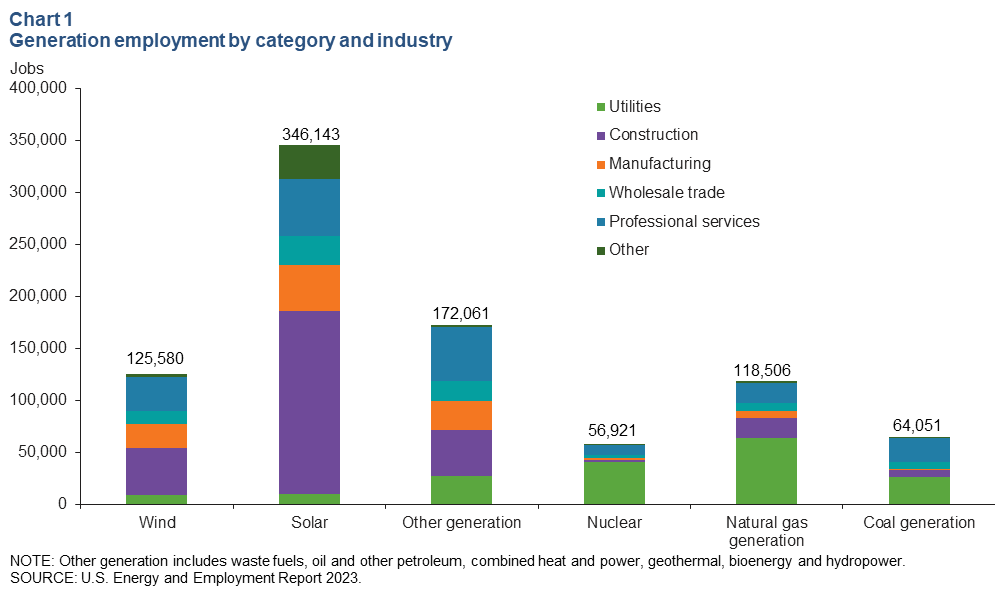
Natural gas accounted for 13.4 percent of electric power generation jobs and coal for 7.3 percent. Other generation amounted to 19.5 percent and includes hydropower, geothermal, bio, waste oils, and combined heat and power such as generating units that use natural gas.
All low-carbon generation jobs grew from 2021 to 2022, including wind, solar, hydro, geothermal and nuclear, adding 21,664 jobs (up 44.2 percent), while natural gas generation added 7,311 jobs (up 12.4 percent) and coal lost 6,780 jobs (down 9.6 percent).
Oil and gas outweigh other sectors in U.S. energy employment
Petroleum and natural gas account for by far the largest share of fuels employment, at a combined 77.2 percent. Within these two categories, mining and extraction jobs are 48.9 of total employment (Chart 2).
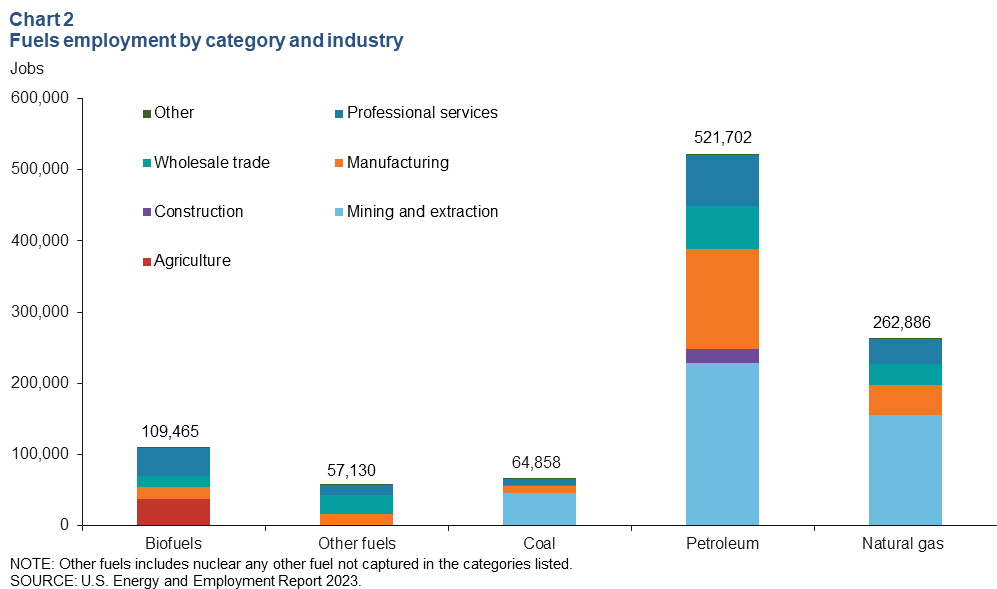
Petroleum fuels employment rebounded from a contraction during the pandemic and, amid high prices, notched the largest employment gain among all fuel categories from 2021 to 2022, followed by natural gas. Petroleum and natural gas growth also outstripped all other major components of domestic energy employment as categorized by the USEER—electricity generation, transmission, distribution and storage, energy efficiency and motor vehicles and component parts.
Total employment for all fuel categories—petroleum, natural gas, biofuels, coal and other fuels—grew 123,377 jobs, or 13.6 percent.The petroleum fuels category added 58,100 jobs (up 34.6 percent), and natural gas jobs increased by 51,100 (up 33.6 percent). It should be noted that the USEER accounts for some energy jobs, notably natural gas and petroleum energy jobs, in the storage, transmission and transportation category. These jobs are not included in the fuels and generation charts above.Texas notches Texas-size share of energy jobs
Texas dominates petroleum and natural gas employment sectors, as well as renewable energy categories. Wind generation jobs total 26,135 in Texas, 21 percent of the national total, according to the USEER (Chart 3). Texas also has the largest installed wind capacity in the nation, with 27 percent of the country’s total.
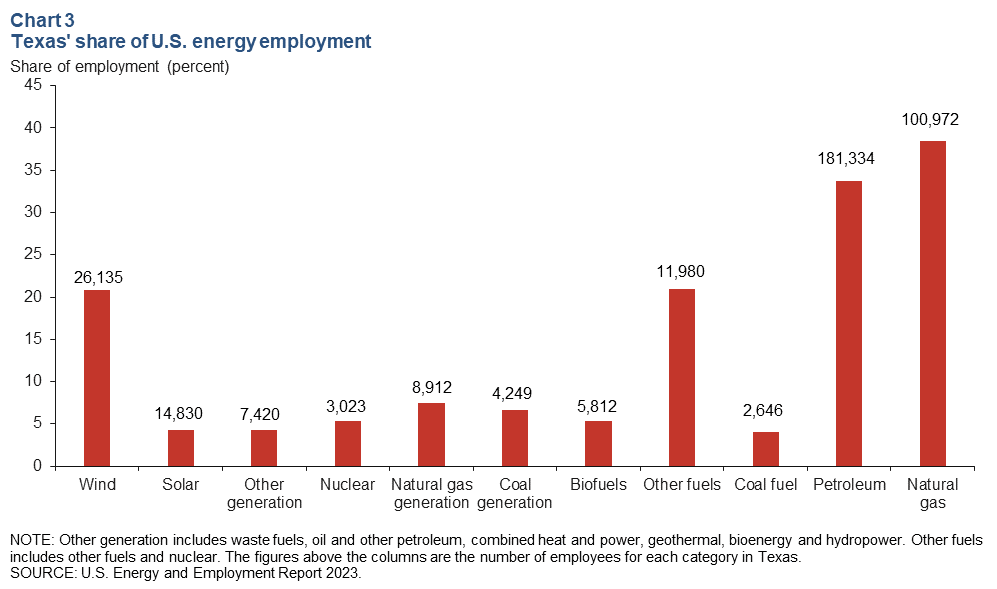
At the same time, Texas accounts for 35.5 percent of all petroleum and natural gas fuels sector jobs in the U.S. Within just the oil and gas extraction and support activities for oil and gas operations components of all fuels jobs, the state’s share is 59.1 percent, according to Bureau of Labor Statistics (BLS) data. These shares align with the fact that in 2022 Texas produced 42 percent of the nation’s crude oil and 27 percent of its marketed natural gas. Second-place Louisiana has 7.8 percent of petroleum and natural gas employment.
Oil and gas jobs and drilling activity
Energy payrolls up; rigs down
In the latest monthly data from the BLS, U.S. oil and gas jobs increased slightly in June to 578,900 (Chart 4). Of those jobs, 227,300, or 39 percent, are in support activities for oil and gas operations, and another 127,100, or 22 percent, are in pipeline construction. June marks the highest total since April 2020. The industry has added 13,800 jobs this year. The payroll trend stands in stark contrast to the rig count.
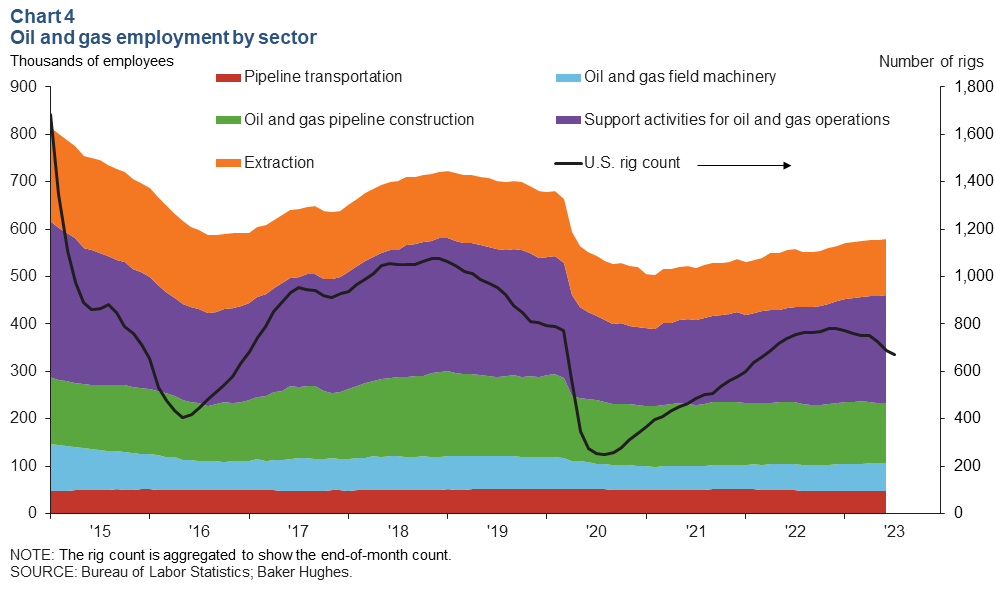
Drilling activity dropped by 125 rigs in the first week of August from the high point of 784 the first week of December 2022. Rigs targeting natural gas production dropped by 27, and oil-directed rigs fell by 102. The miscellaneous rig count added four rigs during the same period. Texas drilling shrank by 57 rigs, and among the major basins, the Permian shed the most, dropping 21 rigs in the first week of August from December 2022, with the net losses coming from the Texas side of the basin.
The falling rig count may portend downward revisions to oil and gas payrolls. Historically, support activities and related manufacturing are the first sectors to show job losses when the rig count turns down. However, this disconnect may also mean firms are eyeing an upturn in drilling activity soon, a notion consistent with comments in the Dallas Fed Energy Survey, anecdotal information such as the July Beige Book and public commentary from oilfield services firms.
The healthy payroll data align with low industry unemployment claims for the mining and logging supersector in June. The BLS job openings and labor turnover survey also shows the mining and logging labor market remains tight, with job openings in excess of hiring, and job losses holding at unremarkable levels.
Refinery throughput
Fuel prices ticking up
The price of retail diesel and gasoline both ticked up in recent weeks. On-highway diesel rose to $4.24 per gallon the week of Aug. 7, up 12.6 percent since the start of July (Chart 5). Regular gasoline rose to $3.94 for the same week, up 8.2 percent during the same time frame. For comparison, the price of Brent crude rose 16.4 percent.
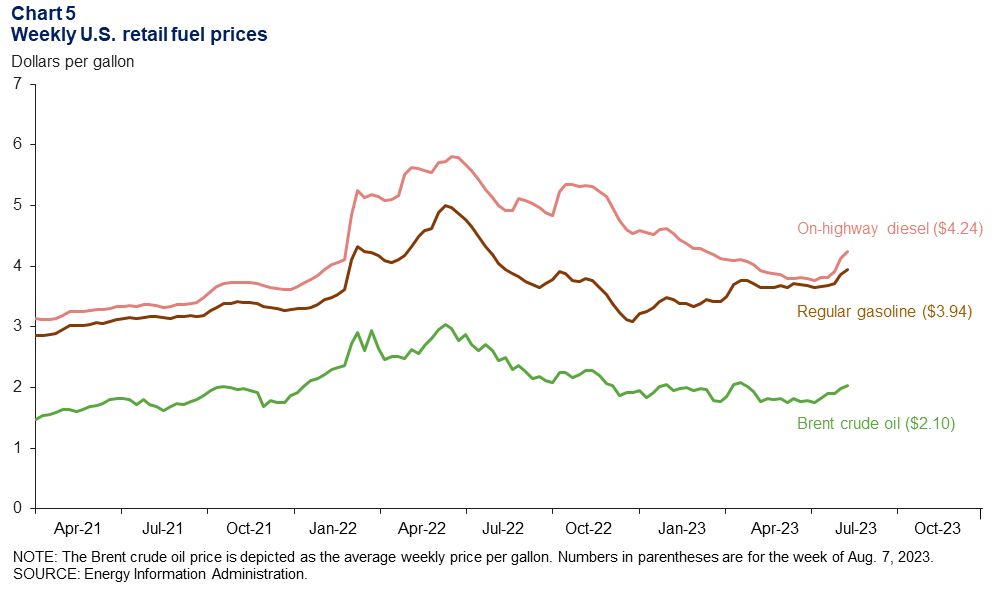
Fuel prices have risen due to higher oil prices, as well as a number of unplanned outages at U.S. refineries. Distillate fuels (such as diesel and jet fuel) were more impacted than gasoline, in part because distillate inventories remain tight compared with gasoline, and several refineries reported outages in distillate units in July.
Crude inputs into Gulf Coast refineries elevated
Refineries on the U.S. Gulf Coast processed 9.0 million barrels of crude oil per day (mb/d) over the four weeks ending July 28 after dipping earlier in the month due to outages. That’s the highest volume processed since August 2022 (Chart 6). The volume of crude processed in the rest of the U.S. was 7.6 mb/d and has been trending down slightly since the start of July.
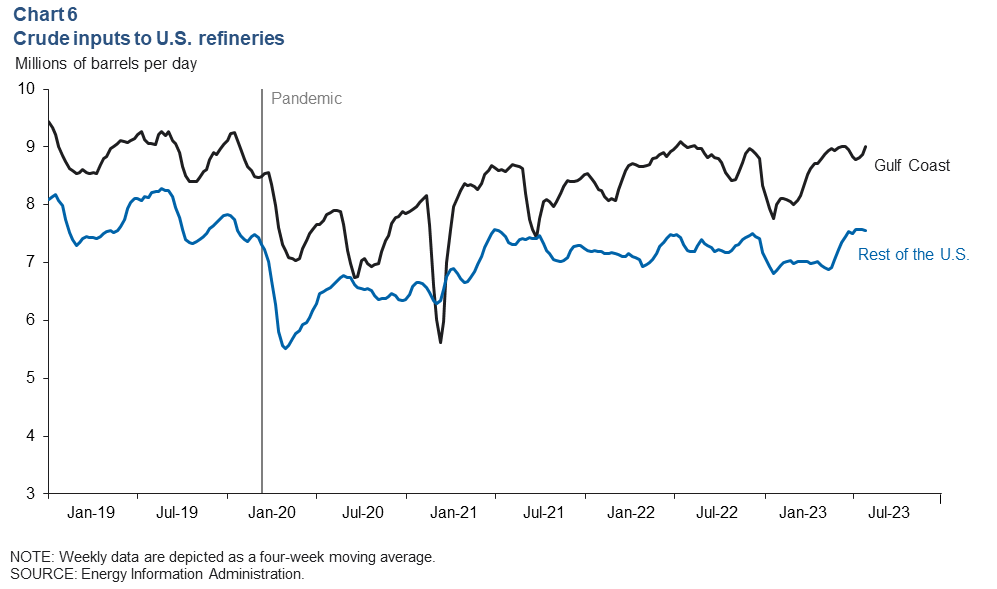
The utilization rate for U.S. Gulf Coast refineries fell from 98.8 percent at the start of the summer to 94.8 for the week ending July 28. The rate for the U.S. overall is lower than the Gulf Coast, declining from 95.8 percent in June to 92.7 percent at the end of July.
A number of unplanned outages this summer, including a fire at one facility and maintenance at others, have limited fuel output. Record sustained high temperatures are also partly to blame for lower run rates as some facilities were forced to limit utilization to keep equipment from overheating.
Distillate days of cover remain below average
There were 33.6 days of cover for distillate (the number of days domestic inventories would likely last at the recent pace of consumption) at the end of July, two days below the 10-year average for that month (Chart 7). Gasoline days of cover were on par with the 10-year average at 24.1.
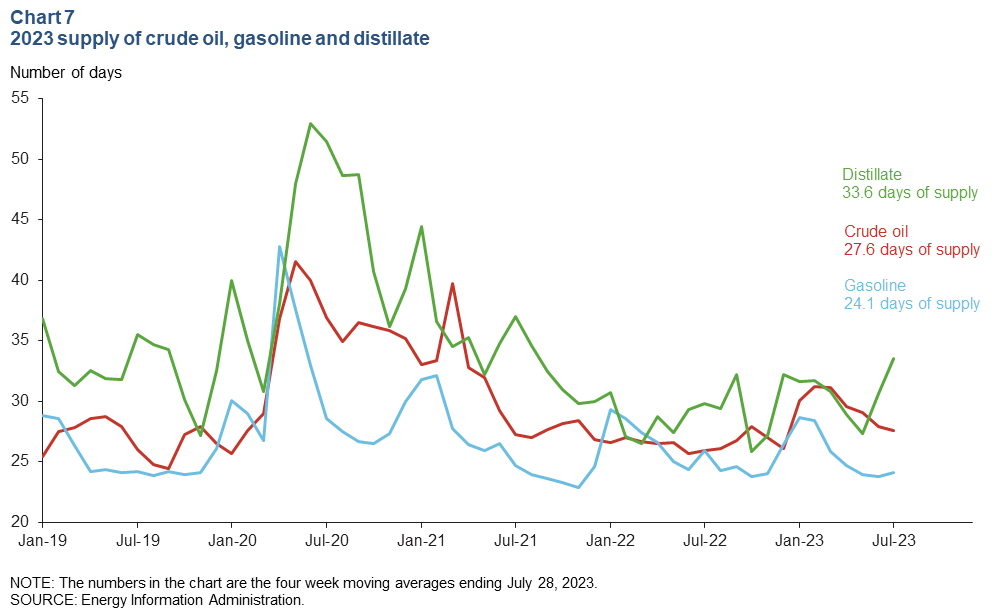
U.S. crude oil days of cover (excluding the strategic petroleum reserve) stand at 27.6, the lowest level since December. This is due in part to the rise in exports. Using a four-week moving average, U.S. exports of crude oil rose 345,000 barrels per day (b/d) from the week ending July 21 to the week ending July 28. Stocks of motor gasoline totaled 219.1 million barrels at the end of July, 2.8 percent less than the year-ago level. According to the Energy Information Administration, U.S. distillate stocks are at 117.2 million barrels, which is 7.2 percent above the year-ago level. The recent uptick in diesel prices was likely moderated by lackluster distillate demand growth, driven in part by modest freight demand, which is down 0.5 percent (180,000 b/d), and a shift in consumer spending toward services rather than goods.
About Energy Indicators
Questions can be addressed to Kenya Schott at kenya.schott@dal.frb.org. Energy Indicators is released monthly and can be received by signing up for an email alert. For additional energy-related research, please visit the Dallas Fed’s energy home page.