Energy Indicators

Resilient demand and constricted supply due to OPEC+ production cuts will leave crude oil balances in a deficit for the remainder of the year, even with continually increasing U.S. production. China’s reopening increased demand for oil but fell short of producers’ and traders’ expectations. U.S. natural gas production has been strong since the start of the year, and exports are expected to rise. Natural gas prices have been on the decline in 2023.
Crude oil
Crude stocks to decline in second half of 2023
In the second half of 2023, global crude oil consumption is expected to outpace production, causing global crude stocks to decline (Chart 1). According to major energy agencies, consultancies and investment banks, the third quarter shortfall is projected to be 1.3 million barrels per day (mb/d), with a slight easing in the fourth quarter to an 800,000 barrels per day (bpd) deficit. Supply cuts are driving the shortfall. In July, OPEC+ production fell 1.2 mb/d to a near-all-time low of 35.7 mb/d as Saudi Arabia’s voluntary production cuts took effect. Meanwhile, global consumption was buoyed by the postpandemic demand recovery in China and resilient consumption in advanced economies.
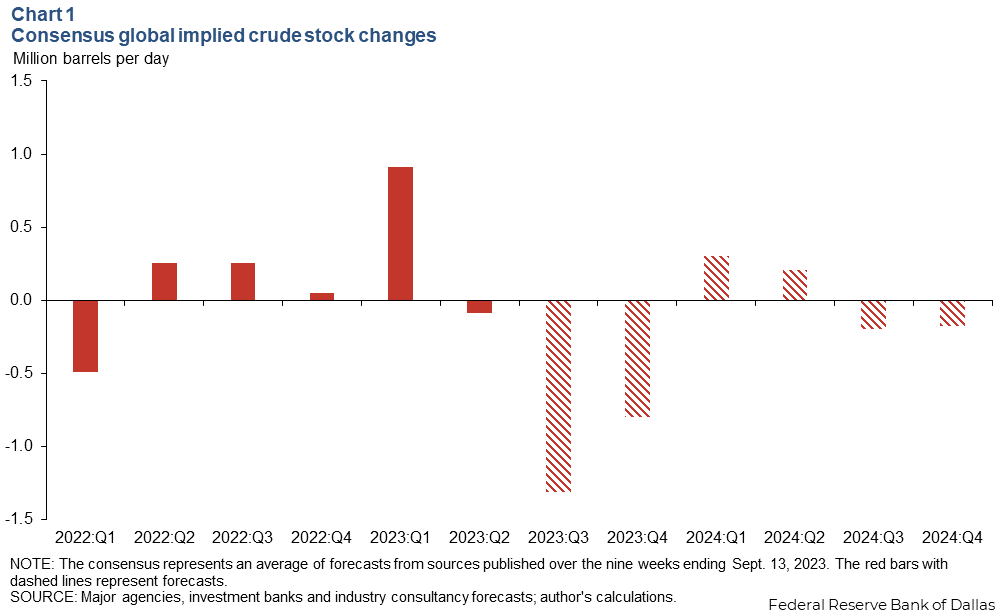
However, consumption and production are projected to be roughly balanced in 2024. Consumption is expected to slow as the postpandemic demand surge will have run its course, and production—mainly from OPEC+ and the U.S.—is expected to rise. If this is how fundamentals unfold, it would imply global stocks of crude oil will remain at relatively low levels.
Production surpasses forecasts
U.S. crude oil production was 13 mb/d in July 2023, 630,000 b/d more than the Energy Information Administration’s (EIA) January Short-Term Energy Outlook (STEO) predicted (Chart 2). The report forecasted output to hit 13 mb/d in November 2024.
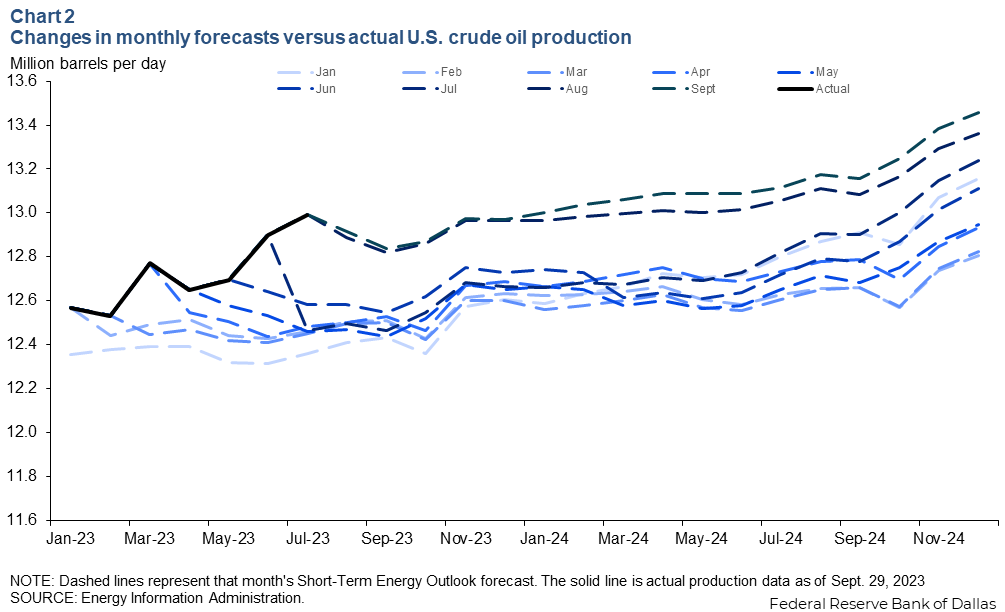
More recently, the August STEO forecasted production would hit 13 mb/d in March 2024 and even the report released in September has output hitting 13 mb/d in January 2024. A July consensus of several forecasts projected U.S. crude production to be around 13 mb/d sometime in late 2024, and a consensus from the same forecasters taken in September anticipated hitting that level of production in the third quarter of 2024. A clear trend emerges: Actual production is coming in way higher than forecasters had predicted.
The higher-than-expected production numbers surprised forecasters because the rig count has dropped 20 percent year-to-date. Energy agencies, consultancies and investment banks cannot pin down exactly why production continues to climb even with the precipitous rig count decline, but one theory is that wells are producing more than expected.
China recovers but falls short of expectations
A consensus of views from energy agencies, investment banks and consultancies suggests Chinese crude oil demand will increase 7 percent from 2022 to 2023 (Chart 3). Since China ended its zero-COVID policy in fourth quarter 2022, the country’s demand has risen 8 percent. However, according to the second-quarter Dallas Fed Energy Survey, this was less than expected by oil and gas executives.
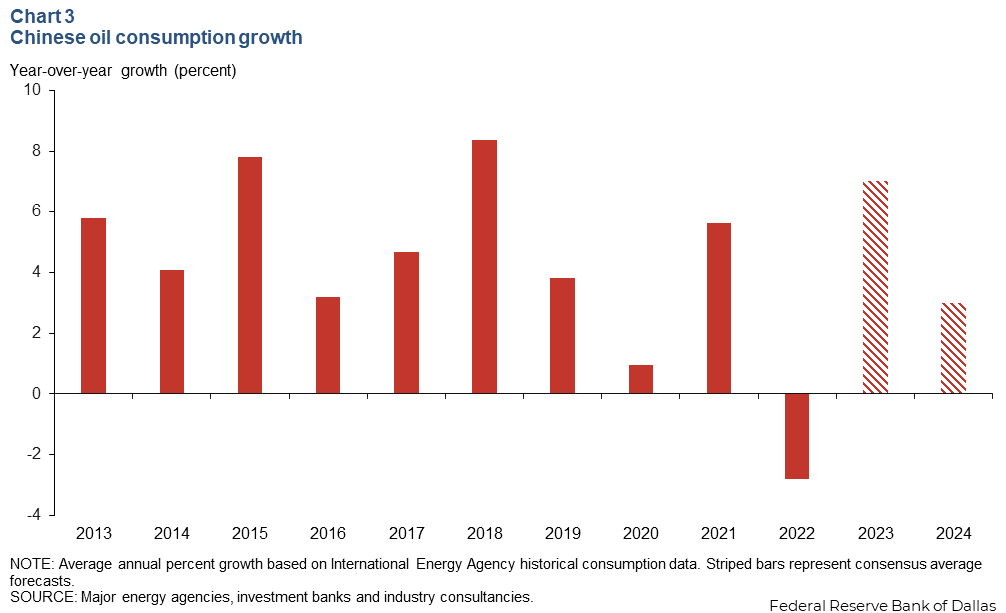
China’s oil consumption growth is expected to slow to 3 percent in 2024. That is well below its prepandemic trend growth rate of about 5.6 percent, which had already slowed from 5.9 percent 10 years prior. Forecasts of slowing economic growth, slowing population growth and accelerating electrification of transportation in the country show China’s contribution to global fuel demand could be structurally lower going forward.
Natural gas
Exports expected to rise
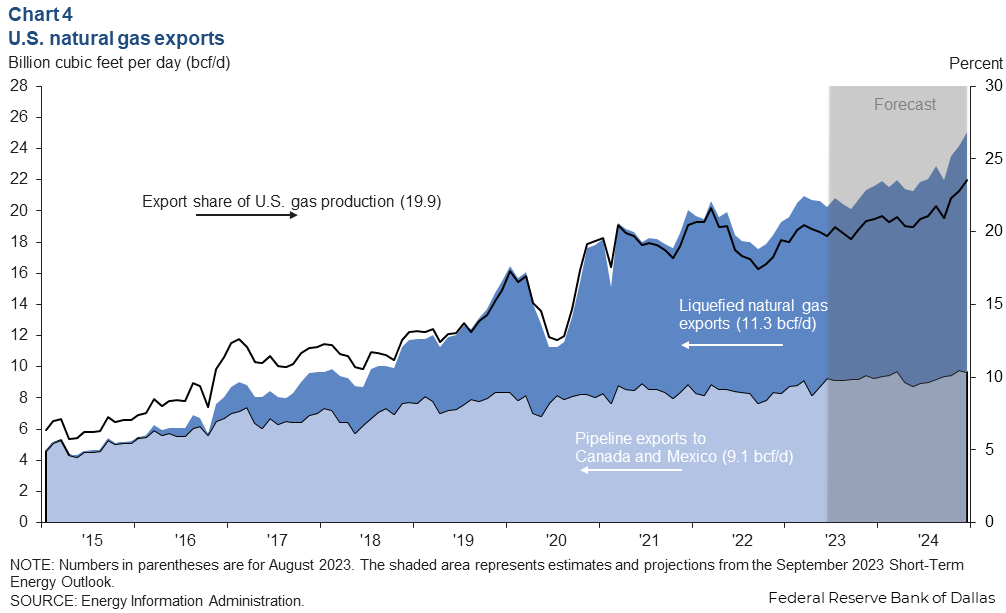
The EIA expects U.S.-marketed natural gas production to be relatively flat from August until the end of the year. Liquefied natural gas (LNG) exports stood at 11.3 billion cubic feet per day (bcf/d) and pipeline exports were 9.1 bcf/d in August. If the EIA’s projections are realized, the export share of U.S. supplies will rise from 19.9 percent in August 2023 to 23.6 percent in December 2024 (Chart 4). As of the EIA’s June LNG liquefaction capacity report, peak nameplate capacity for LNG exports in the U.S. was 12.97 bcf/d.
In between crude oil and natural gas is the natural gas liquids (NGL) category such as ethane, propane and butane. U.S. NGL production was 6.3 mb/d in August. Exports of NGLs, mostly to Asia and Latin America, have risen significantly over the past several years to 2.4 mb/d in 2022. NGLs are used for myriad purposes including petrochemical feedstocks, heating and cooking, and blending into crude oil.
Production up since start of the year
Total dry shale gas production in the U.S. rose 3.9 percent year over year in June to 82.4 bcf/d.
Production from the Appalachian shale region totaled 31.2 bcf/d in June 2023 compared with 30.5 bcf/d at the start of the year (Chart 5). Natural gas production for the Haynesville Shale has held steady year to date, only increasing 0.2 bcf/d. Permian output has increased the most by volume out of the major basins, rising 0.7 bcf/d over the same period.
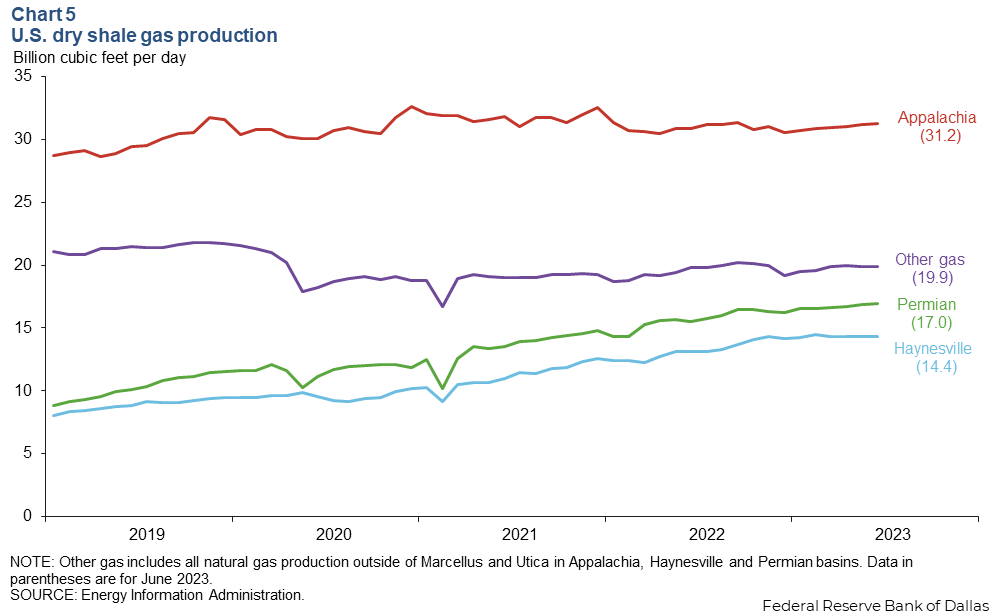
The EIA expects gross withdrawals of gas from the Permian to reach a record high of 23.7 bcf/d in September. Appalachia withdrawals are expected to fall to 35.75 bcf/d in September, the lowest since May 2023, and Haynesville is projected to slip to 16.3 bcf/d.
Natural gas prices ease up
Natural gas prices declined globally, with the most dramatic dive in Asian LNG, down 55 percent from the start of year to $13.33 per MMBtu the week ending Sept. 8 (Chart 6). High summer temperatures and a potential labor strike in Australia added volatility to LNG prices over the summer months, but prices eased after the strike was called off on Sept. 8, and LNG settled in Asia near $12.63 per MMBtu in the second half of September .
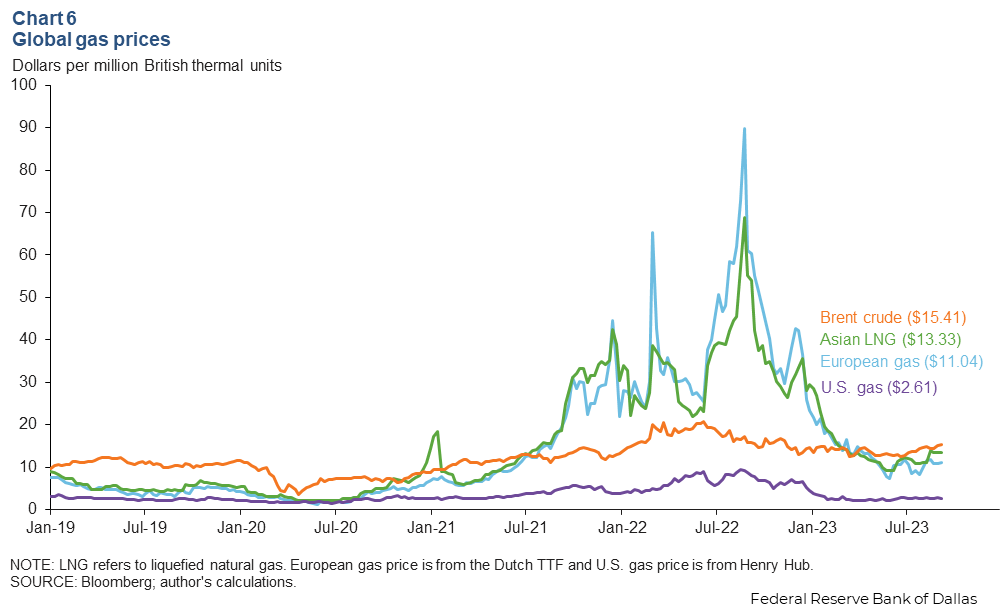
European gas declined 53 percent to $11.04 per MMBtu, and U.S. gas declined 42 percent to $2.61 per MMBtu over the same period as inventories of gas swelled, particularly in Europe, which was running out of storage capacity by mid-September. European inventories have built rapidly this year on heavy LNG imports, lower industrial consumption and less power sector demand (thanks largely to nuclear).
U.S. natural gas benchmark Henry Hub averaged $2.61 per MMBtu in August 2023, down from its 2022 average of $6.49. Respondents from the Dallas Fed Energy Survey expect Henry Hub to tick up slightly to end the year at $3.14 per MMBtu.
Gas futures imply an average Henry Hub price in 2024 of $3.40 per MMBtu versus $14.94 for European gas and $15.50 for Asian gas benchmarks. The persistent spread represents a strong arbitrage that will draw as many export cargoes from the U.S. as capacity will allow. The U.S. will maintain much of the cost advantage for energy-intensive production such as petrochemicals that has existed since shale first crushed the domestic price of natural gas and natural gas liquids over a decade ago.
About Energy Indicators
Questions can be addressed to Kenya Schott at kenya.schott@dal.frb.org. Energy Indicators is released monthly and can be received by signing up for an email alert. For additional energy-related research, please visit the Dallas Fed’s energy home page.