Banking Conditions Survey

Loan Growth Continues in Eleventh District; Outlooks Optimistic
For this month’s survey, Eleventh District business executives were asked supplemental questions on profitability and expectations. Read the special questions results.
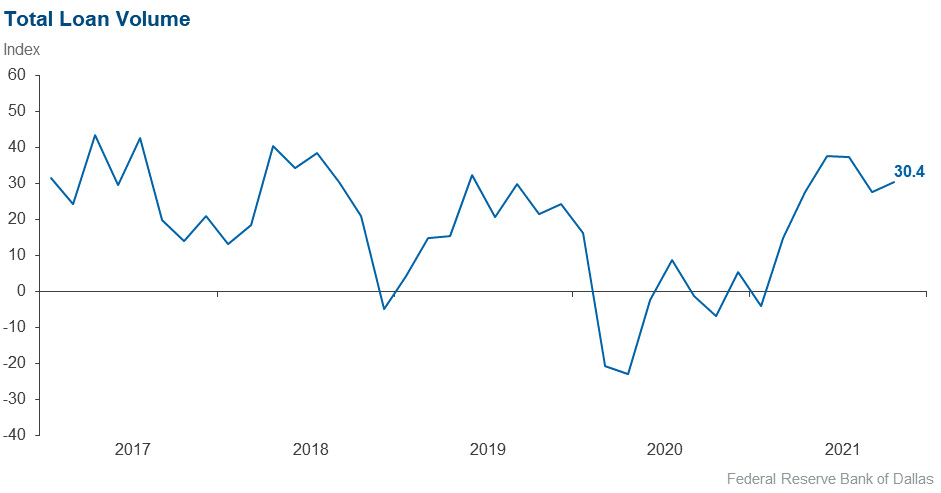
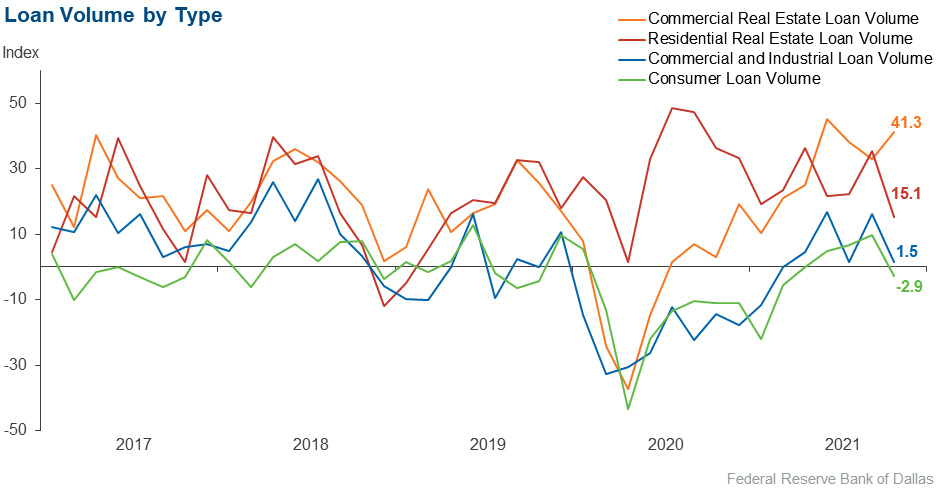
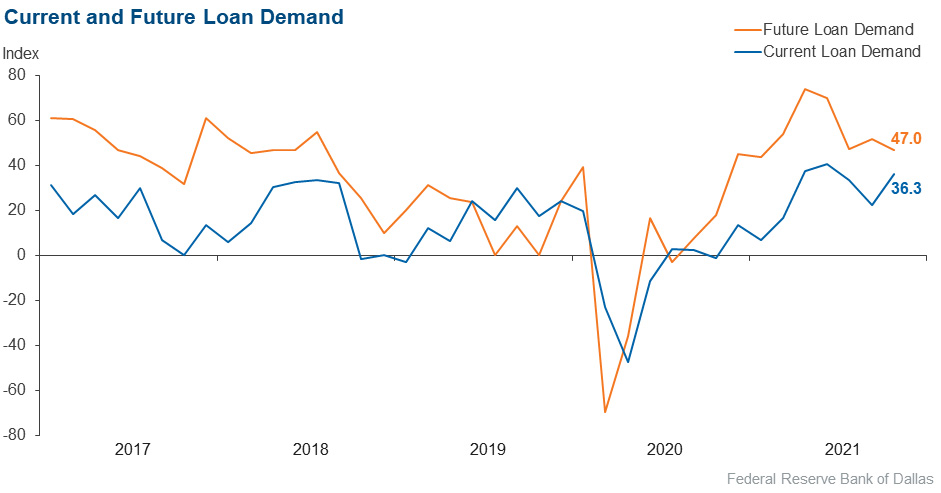
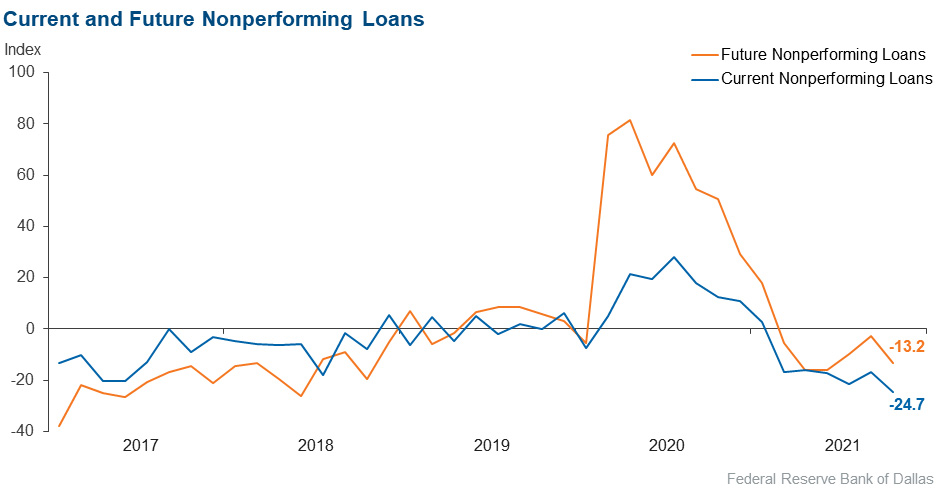
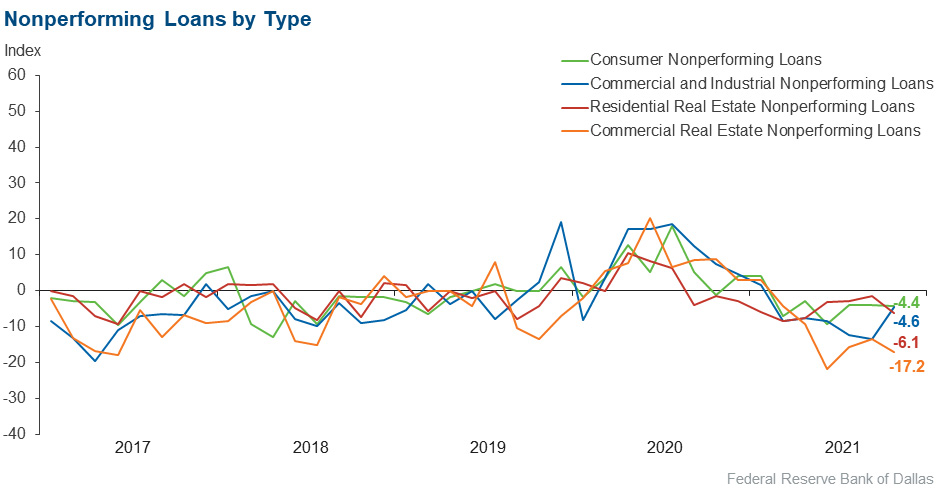
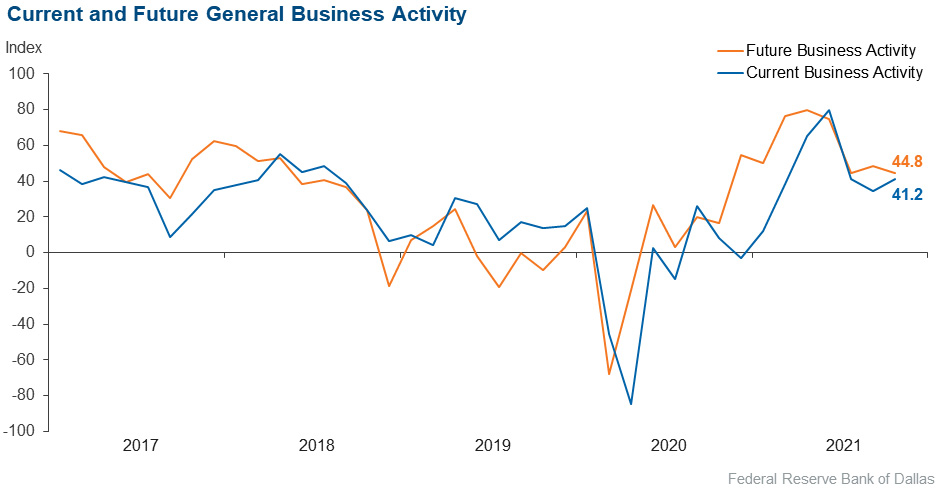
Loan-demand growth picked up over the past six weeks, bolstering loan volumes. Commercial real estate lending led volume growth, eclipsing residential real estate lending, which continued to grow but at a decelerated pace. Volumes were largely unchanged for commercial and industrial loans and edged down for consumer loans. Nonperforming loans continued to decrease, and credit standards and terms remained unchanged. General business activity increased further, though contacts expressed concern over supply-chain disruptions, labor shortages and inflation. Outlooks for loan demand and broader business activity six months from now remained optimistic.
Next release: December 27, 2021
Data were collected November 1–9, and 69 financial institutions responded to the survey. The Federal Reserve Bank of Dallas conducts the Banking Conditions Survey twice each quarter to obtain a timely assessment of activity at banks and credit unions headquartered in the Eleventh Federal Reserve District. CEOs or senior loan officers of financial institutions report on how conditions have changed for indicators such as loan volume, nonperforming loans and loan pricing. Respondents are also asked to report on their banking outlook and their evaluation of general business activity.
Survey responses are used to calculate an index for each indicator. Each index is calculated by subtracting the percentage of respondents reporting a decrease (or tightening) from the percentage reporting an increase (or easing). When the share of respondents reporting an increase exceeds the share reporting a decrease, the index will be greater than zero, suggesting the indicator has increased over the prior reporting period. If the share of respondents reporting a decrease exceeds the share reporting an increase, the index will be below zero, suggesting the indicator has decreased over the prior reporting period. An index will be zero when the number of respondents reporting an increase is equal to the number reporting a decrease.
Results Summary
Historical data are available from March 2017.
| Total Loans: Over the past six weeks, how have the following changed? | |||||
| Indicator | Current Index | Previous Index | % Reporting Increase | % Reporting No Change | % Reporting Decrease |
Loan volume | 30.4 | 27.7 | 50.7 | 29.0 | 20.3 |
Loan demand | 36.3 | 22.3 | 49.3 | 37.7 | 13.0 |
Nonperforming loans | –24.7 | –16.7 | 7.2 | 60.9 | 31.9 |
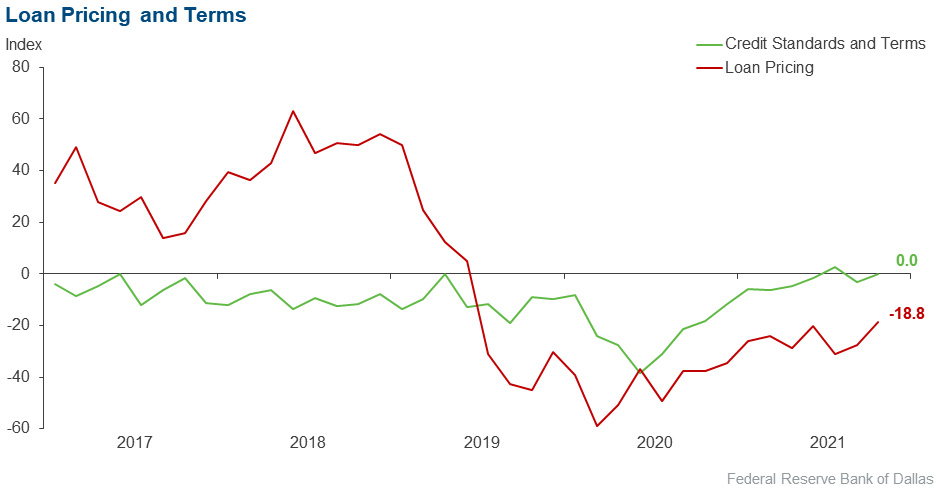
Loan pricing | –18.8 | –27.7 | 2.9 | 75.4 | 21.7 |
| Indicator | Current Index | Previous Index | % Reporting Eased | % Reporting No Change | % Reporting Tightened |
Credit standards and terms | 0.0 | –3.0 | 1.7 | 96.7 | 1.7 |
| Commercial and Industrial Loans: Over the past six weeks, how have the following changed? | |||||
| Indicator | Current Index | Previous Index | % Reporting Increase | % Reporting No Change | % Reporting Decrease |
Loan volume | 1.5 | 16.2 | 21.5 | 58.5 | 20.0 |
Nonperforming loans | –4.6 | –13.4 | 9.2 | 76.9 | 13.8 |
| Indicator | Current Index | Previous Index | % Reporting Eased | % Reporting No Change | % Reporting Tightened |
Credit standards and terms | 0.0 | 1.5 | 1.5 | 96.9 | 1.5 |
| Commercial Real Estate Loans: Over the past six weeks, how have the following changed? | |||||
| Indicator | Current Index | Previous Index | % Reporting Increase | % Reporting No Change | % Reporting Decrease |
Loan volume | 41.3 | 32.8 | 54.0 | 33.3 | 12.7 |
Nonperforming loans | –17.2 | –13.4 | 3.1 | 76.6 | 20.3 |
| Indicator | Current Index | Previous Index | % Reporting Eased | % Reporting No Change | % Reporting Tightened |
Credit standards and terms | –4.8 | 1.5 | 0.0 | 95.2 | 4.8 |
| Residential Real Estate Loans: Over the past six weeks, how have the following changed? | |||||
| Indicator | Current Index | Previous Index | % Reporting Increase | % Reporting No Change | % Reporting Decrease |
Loan volume | 15.1 | 35.3 | 31.8 | 51.5 | 16.7 |
Nonperforming loans | –6.1 | –1.5 | 3.0 | 87.9 | 9.1 |
| Indicator | Current Index | Previous Index | % Reporting Eased | % Reporting No Change | % Reporting Tightened |
Credit standards and terms | –3.0 | –4.5 | 0.0 | 97.0 | 3.0 |
| Consumer Loans: Over the past six weeks, how have the following changed? | |||||
| Indicator | Current Index | Previous Index | % Reporting Increase | % Reporting No Change | % Reporting Decrease |
Loan volume | –2.9 | 9.8 | 10.1 | 76.8 | 13.0 |
Nonperforming loans | –4.4 | –4.1 | 1.4 | 92.8 | 5.8 |
| Indicator | Current Index | Previous Index | % Reporting Eased | % Reporting No Change | % Reporting Tightened |
Credit standards and terms | –1.5 | –2.9 | 0.0 | 98.5 | 1.5 |
| Banking Outlook: What is your expectation for the following items six months from now? | |||||
| Indicator | Current Index | Previous Index | % Reporting Increase | % Reporting No Change | % Reporting Decrease |
Total loan demand | 47.0 | 51.5 | 63.2 | 20.6 | 16.2 |
Nonperforming loans | –13.2 | –2.9 | 11.8 | 63.2 | 25.0 |
| General Business Activity: What is your evaluation of the level of activity? | |||||
| Indicator | Current Index | Previous Index | % Reporting Better | % Reporting No Change | % Reporting Worse |
Over the past six weeks | 41.2 | 34.7 | 51.5 | 38.2 | 10.3 |
Six months from now | 44.8 | 48.6 | 59.7 | 25.4 | 14.9 |
Comments from Survey Respondents
Respondents were given an opportunity to comment on any issues that may be affecting their business.
These comments are from respondents’ completed surveys and have been edited for publication.
- Margin compression is a big concern. We are concerned that the Fed will not address inflation with an increase in short-term rates soon enough.
- We are still seeing a tight labor market. Supply-chain disruptions and high inflation are on the minds of business owners and consumers in our area.
- The central Texas economy and business activity seem to be thriving. Real estate prices and appraised tax values have increased significantly. From a bank industry perspective, many concerns remain on the regulatory front—from proposed data collection/reporting requirements to regulatory agency appointments. And competition from large fin-techs and nonbank companies with lending and real-time payment services continues to adversely impact smaller community banks. The added pressures from increased regulatory compliance costs and market competition in a low-rate environment certainly weigh heavily on margins and profitability.
- The dramatic deceleration of GDP [gross domestic product], ongoing supply-chain issues, inflationary pressures and worker shortages are issues of concern. The economy looks more like a global wartime economy with labor, supply and lines of communication all being disrupted.
- Auto and home lending are still being affected by supply shortages; we expect supply-chain issues to be resolved by second quarter 2022.
- The number and detail of regulations make it very difficult for under-$100-million-in-deposit banks.
- We are still seeing inflationary pressures on residential and commercial construction projects. This includes all building materials as well as labor costs.
Historical Data
Historical data can be downloaded dating back to March 2017. For the definitions, see data definitions.
NOTE: The following series were discontinued in May 2020: volume of core deposits, cost of funds, non-interest income and net interest margin.
Questions regarding the Banking Conditions Survey can be addressed to Emily Kerr at emily.kerr@dal.frb.org.
Sign up for our email alert to be automatically notified as soon as the latest Banking Conditions Survey is released on the web.