Special Questions

Special Questions
For this month’s survey, Texas business executives were asked supplemental questions on wages, prices and outlook concerns. Results below include responses from participants from both the Texas Manufacturing Outlook Survey and Texas Service Sector Outlook Survey.
Texas Business Outlook Surveys
Data were collected June 16–24, and 262 Texas business executives responded to the surveys.
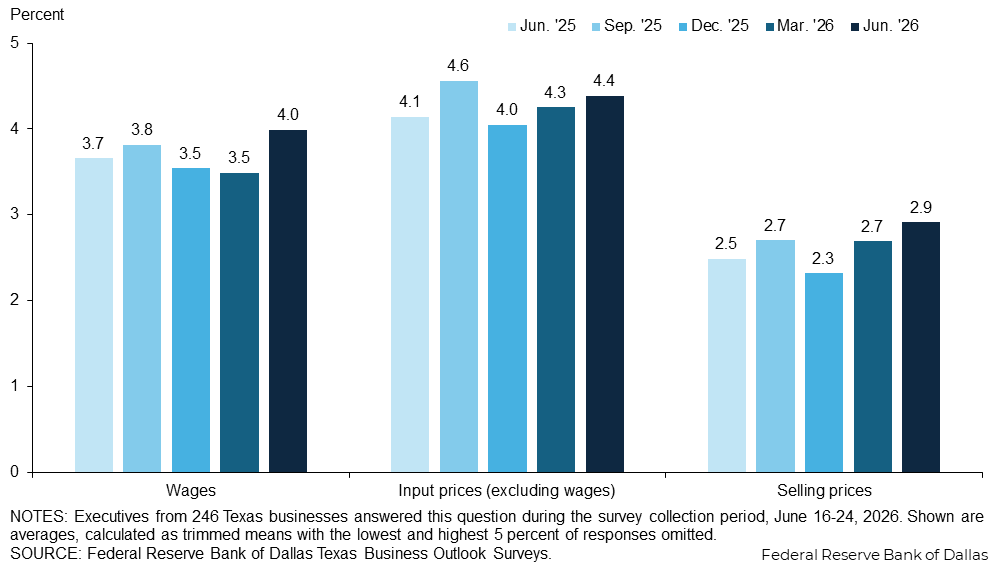
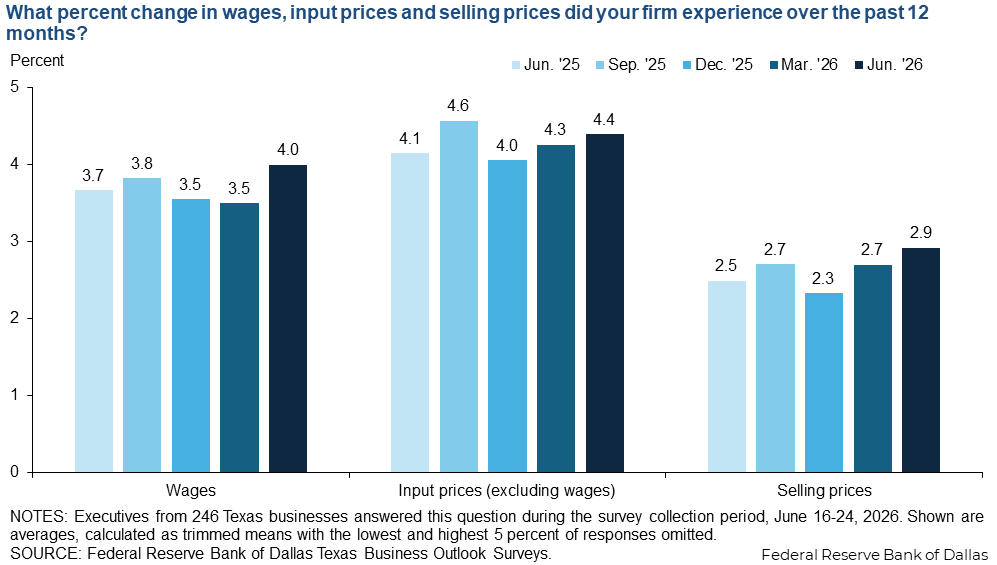
Wage and price growth has accelerated. Texas firms surveyed report wage growth of 4.0 percent over the past 12 months, on average, up markedly from 3.5 percent in March and representing the strongest pace seen since December 2024. Input price growth averaged 4.4 percent and selling price growth averaged 2.9 percent, both up slightly from March. The recent pickup in growth was seen in both the service and manufacturing sectors, but was more pronounced in manufacturing.
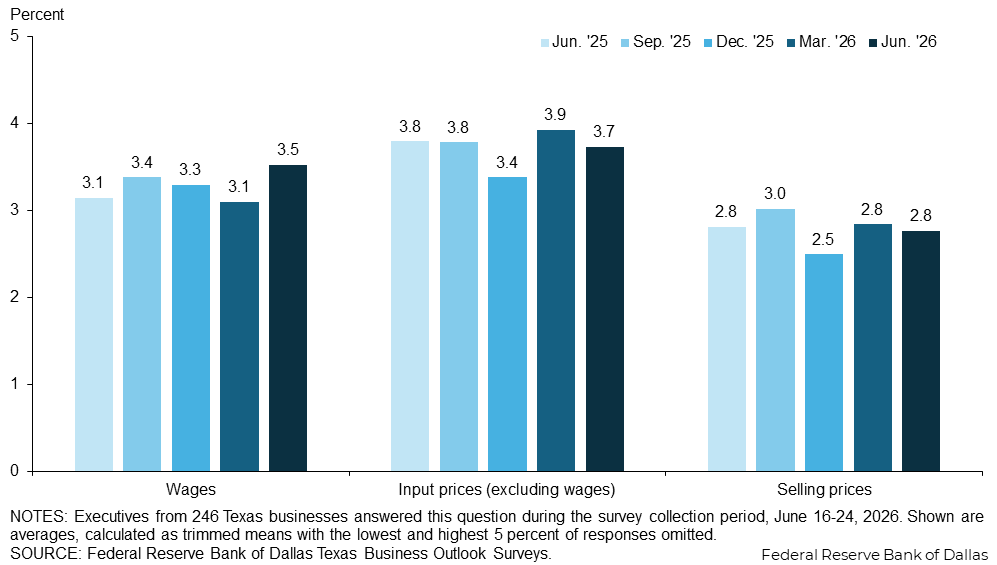
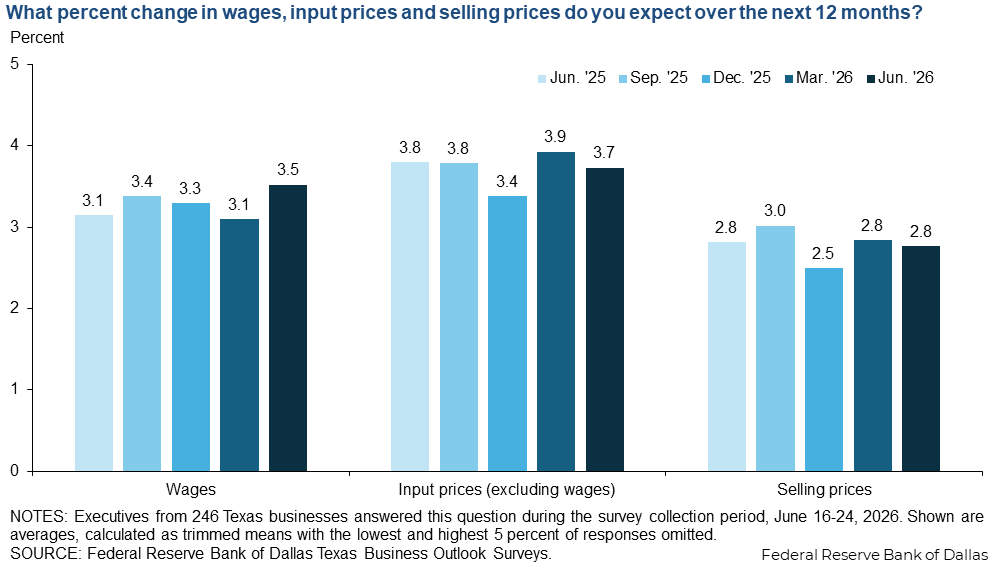
Price growth expectations were flat to down slightly while wage growth expectations reversed trend and moved up. Texas firms surveyed expect wages to increase 3.5 percent over the next 12 months, on average. They expect input prices to increase 3.7 percent and selling prices to increase 2.8 percent. The pickup in expectations for wage growth is broad-based across sectors, while the easing in input price growth is only expected in the manufacturing sector, not among service sector firms collectively.
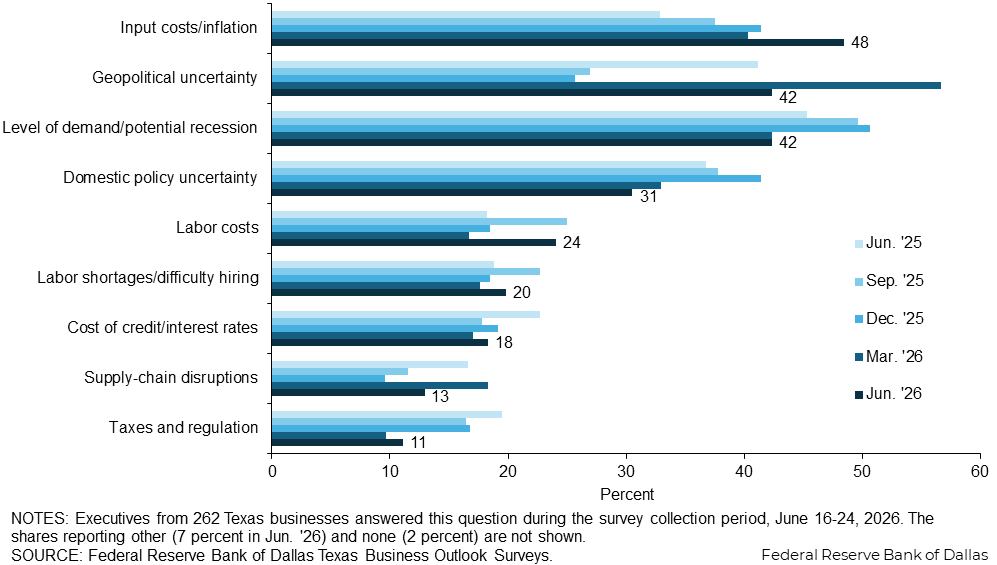
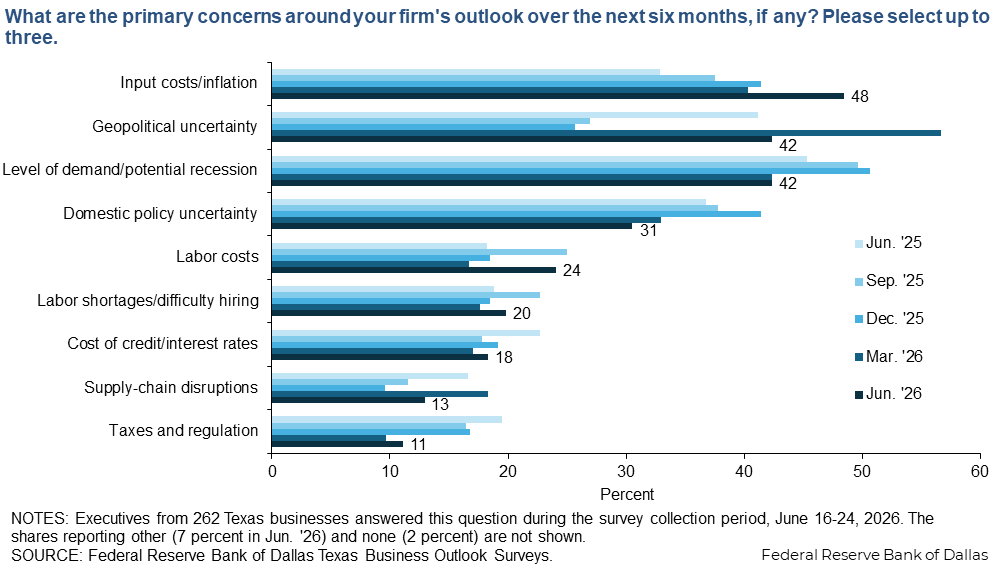
Inflation rose to the most widely-cited outlook concern, while the share of firms citing geopolitical uncertainty retreated but remained elevated. The level of demand remains a top-three concern. The share of firms citing labor costs rose notably in June, while the share citing supply-chain disruptions fell markedly.
Survey respondents were given the opportunity to also provide comments, which can be found in the Comments tab above.
Texas Manufacturing Outlook Survey
Data were collected June 16–24, and 59 Texas manufacturers responded to the survey.
| Sep. '25 (percent) |
Dec. '25 (percent) |
Mar. '26 (percent) |
Jun. '26 (percent) |
|||||
| Past 12 months | Next 12 months | Past 12 months | Next 12 months | Past 12 months | Next 12 months | Past 12 months | Next 12 months | |
| Wages | 3.8 | 3.2 | 3.4 | 3.3 | 3.9 | 3.4 | 4.8 | 3.7 |
| Input prices (excluding wages) | 5.8 | 4.2 | 5.5 | 4.1 | 6.0 | 4.5 | 6.1 | 3.8 |
| Selling prices | 3.8 | 3.8 | 2.7 | 2.7 | 3.9 | 3.7 | 4.8 | 3.8 |
NOTES: 57 responses. Shown are averages, calculated as trimmed means with the lowest and highest 5 percent of responses omitted.
| Mar. '25 (percent) |
Jun. '25 (percent) |
Sep. '25 (percent) |
Dec. '25 (percent) |
Mar. '26 (percent) |
Jun. '26 (percent) |
|
| Input costs/inflation | 43.8 | 45.2 | 45.5 | 46.4 | 44.0 | 52.5 |
| Geopolitical uncertainty | 30.0 | 43.8 | 31.8 | 30.4 | 49.3 | 49.2 |
| Level of demand/potential recession | 50.0 | 47.9 | 50.0 | 53.6 | 49.3 | 37.3 |
| Supply-chain disruptions | 17.5 | 30.1 | 19.7 | 17.4 | 32.0 | 30.5 |
| Domestic policy uncertainty | 40.0 | 27.4 | 40.9 | 39.1 | 29.3 | 27.1 |
| Labor costs | 15.0 | 13.7 | 27.3 | 17.4 | 16.0 | 27.1 |
| Labor shortages/difficulty hiring | 18.8 | 17.8 | 22.7 | 18.8 | 21.3 | 23.7 |
| Cost of credit/interest rates | 10.0 | 13.7 | 10.6 | 13.0 | 13.3 | 13.6 |
| Taxes and regulation | 23.8 | 23.3 | 12.1 | 11.6 | 9.3 | 6.8 |
| Other | 15.0 | 11.0 | 7.6 | 7.2 | 4.0 | 5.1 |
| None | 2.5 | 0.0 | 1.5 | 2.9 | 2.7 | 0.0 |
NOTE: 59 responses.
Survey respondents were given the opportunity to also provide comments, which can be found in the Comments tab above.
Texas Service Sector Outlook Survey
Data were collected June 16–24, and 203 Texas business executives responded to the survey.
| Sep. '25 (percent) |
Dec. '25 (percent) |
Mar. '26 (percent) |
Jun. '26 (percent) |
|||||
| Past 12 months | Next 12 months | Past 12 months | Next 12 months | Past 12 months | Next 12 months | Past 12 months | Next 12 months | |
| Wages | 3.8 | 3.4 | 3.6 | 3.3 | 3.4 | 3.0 | 3.8 | 3.5 |
| Input prices (excluding wages) | 4.2 | 3.7 | 3.7 | 3.1 | 3.7 | 3.7 | 3.9 | 3.8 |
| Selling prices | 2.4 | 2.8 | 2.2 | 2.4 | 2.3 | 2.5 | 2.4 | 2.5 |
NOTES: 189 responses. Shown are averages, calculated as trimmed means with the lowest and highest 5 percent of responses omitted.
| Mar. '25 (percent) |
Jun. '25 (percent) |
Sep. '25 (percent) |
Dec. '25 (percent) |
Mar. '26 (percent) |
Jun. '26 (percent) |
|
| Input costs/inflation | 33.1 | 29.2 | 35.3 | 39.9 | 39.1 | 47.3 |
| Level of demand/potential recession | 50.0 | 44.6 | 49.6 | 49.8 | 40.0 | 43.8 |
| Geopolitical uncertainty | 26.3 | 40.4 | 25.6 | 24.2 | 59.1 | 40.4 |
| Domestic policy uncertainty | 46.2 | 39.6 | 37.0 | 42.2 | 34.2 | 31.5 |
| Labor costs | 19.1 | 19.6 | 24.4 | 18.8 | 16.9 | 23.2 |
| Cost of credit/interest rates | 19.9 | 25.4 | 19.7 | 21.1 | 18.2 | 19.7 |
| Labor shortages/difficulty hiring | 18.2 | 19.2 | 22.7 | 18.4 | 16.4 | 18.7 |
| Taxes and regulation | 19.5 | 18.3 | 17.6 | 18.4 | 9.8 | 12.3 |
| Supply-chain disruptions | 15.3 | 12.5 | 9.2 | 7.2 | 13.8 | 7.9 |
| Other | 6.8 | 7.1 | 7.1 | 6.7 | 8.9 | 6.9 |
| None | 1.7 | 1.7 | 3.4 | 2.7 | 2.2 | 2.5 |
NOTE: 203 responses.
Survey respondents were given the opportunity to also provide comments, which can be found in the Comments tab above.
Questions regarding the Texas Business Outlook Surveys can be addressed to Emily Kerr at emily.kerr@dal.frb.org.
Sign up for our email alert to be automatically notified as soon as the latest surveys are released on the web.
Special Questions Comments
Survey participants are given the opportunity to submit comments. Some comments have been edited for grammar and clarity.