Texas Service Sector Growth Slows in October

Texas Service Sector Outlook Survey
October 27, 2020
Texas Service Sector Growth Slows in October
What’s New This Month
For this month’s survey, Texas business executives were asked supplemental questions on financing. Results for these questions from the Texas Manufacturing Outlook Survey, Texas Service Sector Outlook Survey and Texas Retail Outlook Survey have been released together. Read the special questions results.
NOTE: We have discontinued the report PDF, but the page is formatted for your printer and will look similar to the PDF previously provided. You can either print the report or save it as a PDF via the print function of your browser.
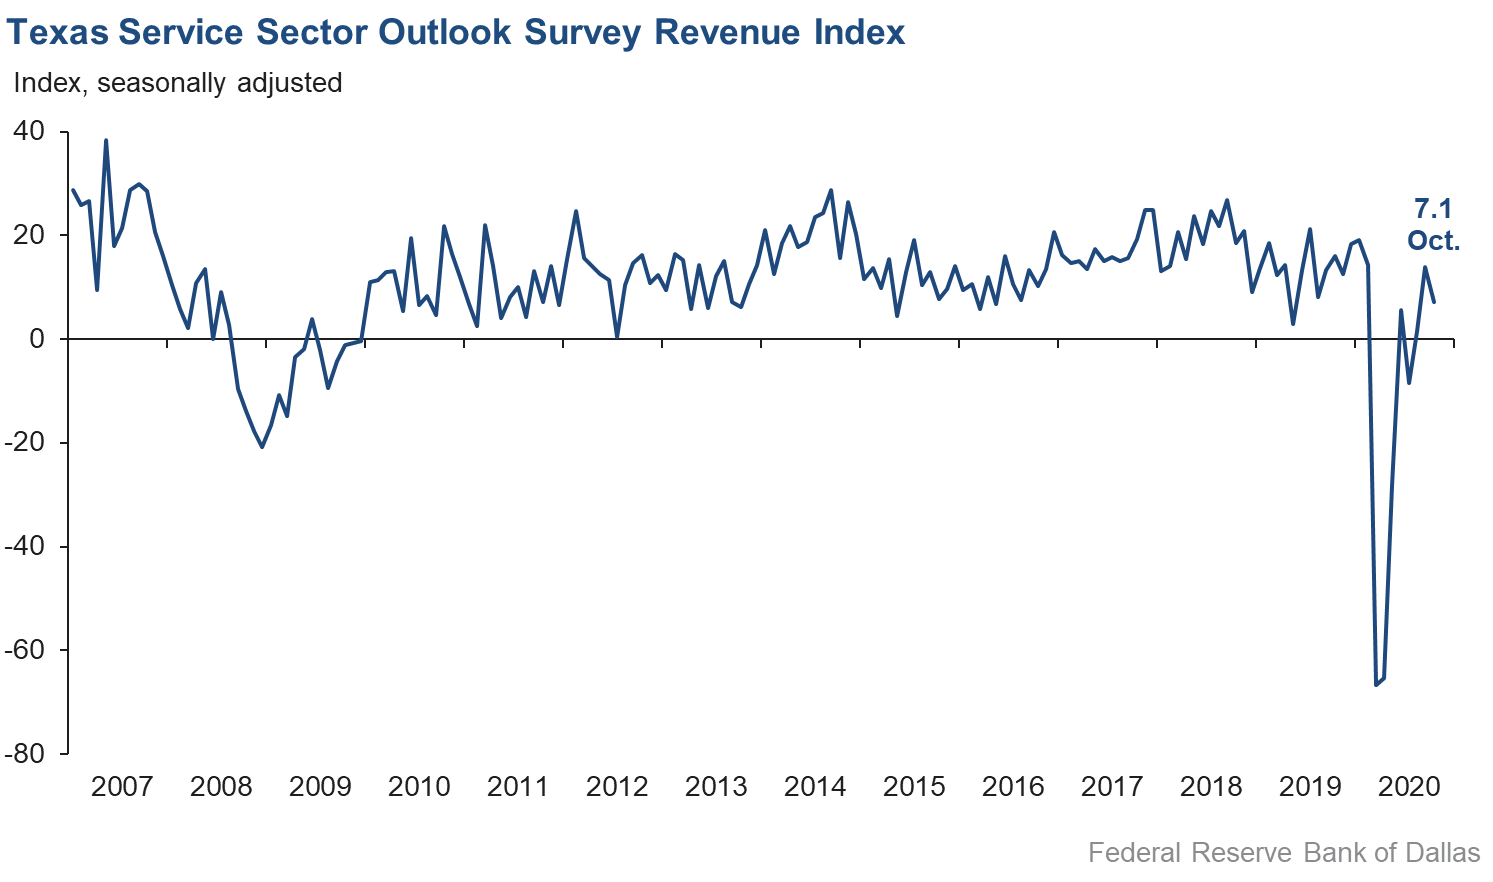
Activity in the Texas service sector grew at a reduced pace in October, according to business executives responding to the Texas Service Sector Outlook Survey. The revenue index, a key measure of state service sector conditions, fell from 14.0 in September to 7.1 in October.
Labor market indicators reflected flattening employment and slower growth in hours worked in October. The employment index fell more than two points to 0.6, while the part-time employment index dropped over five points to -1.6. Meanwhile, the hours worked index dipped from 6.6 to 5.5.
Perceptions of broader business conditions point to continued improvement compared with September. The general business activity index advanced nearly two points to 13.2—its best reading this year. The company outlook index remained positive but fell slightly from 9.7 to 7.8, with over 20 percent of respondents noting an improved outlook compared with last month. The outlook uncertainty index rose from 0.0 to 5.8.
Wage and price pressures ticked up slightly in October. The wages and benefits index rose from 7.1 to a post-pandemic high of 8.6, with about 15 percent of respondents noting increases in employee compensation compared with September. The selling price index rose nearly two points to 4.1, while the input prices index remained largely unchanged at 18.4.
Respondents’ expectations regarding future business activity were slightly more optimistic in October. The future general business activity index rose from 18.9 to 20.1, while the future revenue index increased from 31.9 to 36.3—its highest reading since February. Other indexes of future service sector activity such as employment were solidly positive, suggesting expectations of increased activity in the first half of 2021.

Texas Retail Outlook Survey
October 27, 2020
Texas Retail Sales Decelerate
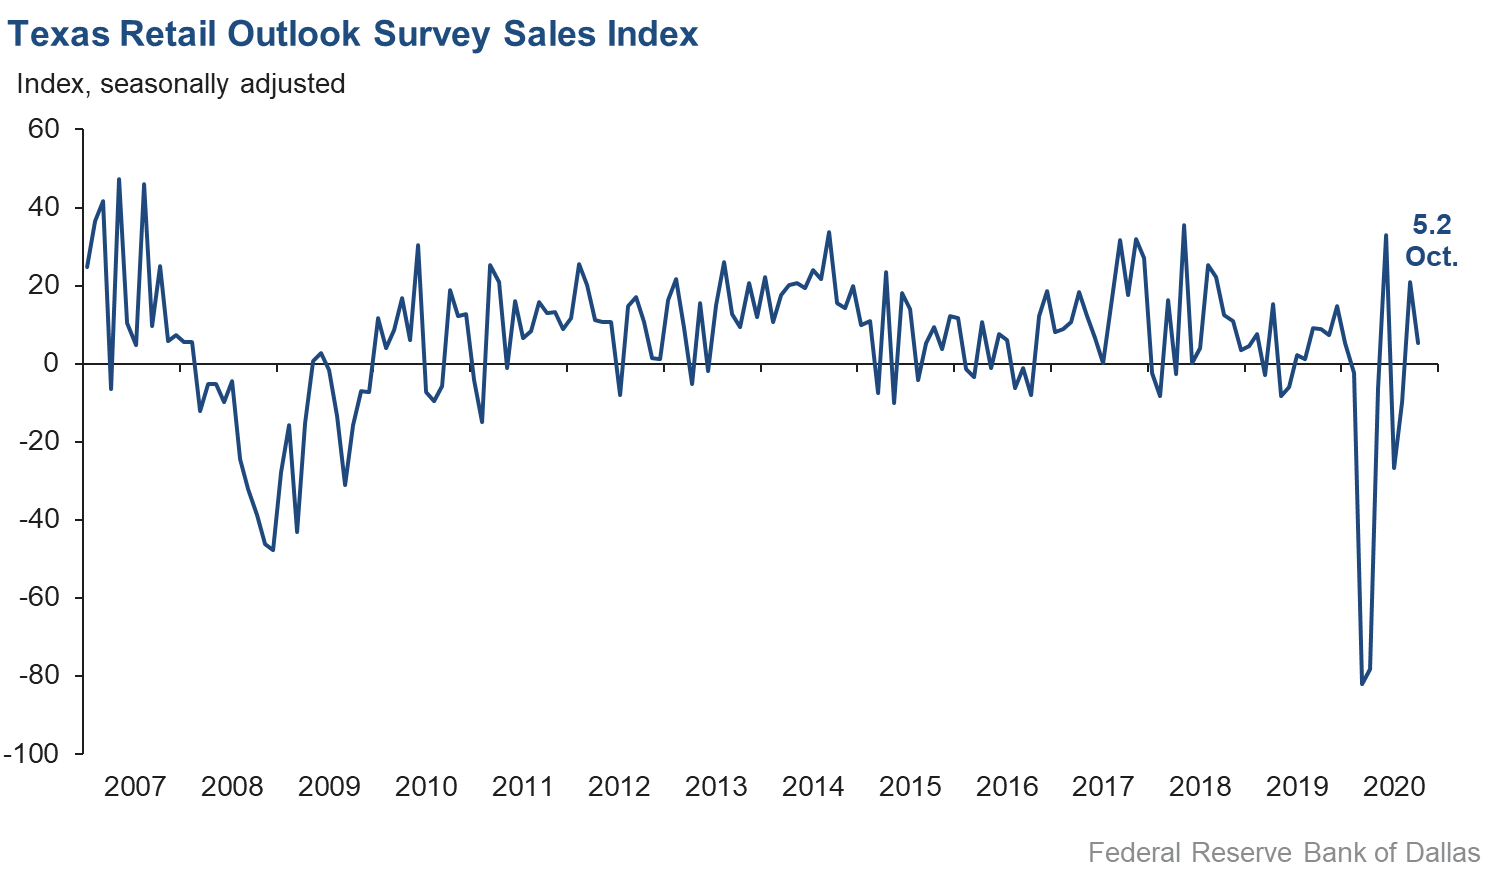
Retail sales activity grew at a slower pace in October following a surge in September, according to business executives responding to the Texas Retail Outlook Survey. The sales index, a key measure of state retail activity, fell from 20.8 to 5.2, although nearly one-quarter of respondents reported increased sales compared with September. Inventories also leveled off for the first time since the pandemic began, as the inventories index increased from -4.1 to 1.9.
Retail labor market indicators deteriorated slightly in October, with net declines in employment and a shortening in average workweek length. The employment index fell more than four points to -2.1, with the part-time index declining to -4.0. The hours worked index shed nearly eight points to -4.8.
Retailers’ perceptions of broader business conditions improved in October. The general business activity index rose over four points to 14.6, while the company outlook index advanced nearly six points to 14.8. The outlook uncertainty index fell to -2.0, suggesting that net uncertainty declined slightly compared with September.
Retail wage pressures increased, while price pressures eased in October. The wages and benefits index picked up from 7.3 to 11.4. Over 15 percent of respondents noted increased wages, while 4.2 percent reported falling wages. The selling prices index fell from 22.6 to 19.0, while the input prices index fell from 26.3 to 18.7.
Retailers’ perceptions of future activity continued to reflect optimism in October, though less so than in September. The future general business activity index slipped about three points to 21.4, while the future sales index plummeted nearly 17 points but remained positive at 26.1. Other indexes of future retail activity such as employment slipped but held positive, pointing to expectations of expanding activity over the next six months.
The Texas Retail Outlook Survey is a component of the Texas Service Sector Outlook Survey that uses information only from respondents in the retail and wholesale sectors.
Next release: December 1, 2020
|
Data were collected October 13–21, and 228 Texas service sector and 51 retail sector business executives responded to the survey. The Dallas Fed conducts the Texas Service Sector Outlook Survey monthly to obtain a timely assessment of the state’s service sector activity. Firms are asked whether revenue, employment, prices, general business activity and other indicators increased, decreased or remained unchanged over the previous month. Survey responses are used to calculate an index for each indicator. Each index is calculated by subtracting the percentage of respondents reporting a decrease from the percentage reporting an increase. When the share of firms reporting an increase exceeds the share reporting a decrease, the index will be greater than zero, suggesting the indicator has increased over the prior month. If the share of firms reporting a decrease exceeds the share reporting an increase, the index will be below zero, suggesting the indicator has decreased over the prior month. An index will be zero when the number of firms reporting an increase is equal to the number of firms reporting a decrease. Data have been seasonally adjusted as necessary. |
Texas Service Sector Outlook Survey
October 27, 2020
Historical data are available from January 2007 to the most current release month.
| Business Indicators Relating to Facilities and Products in Texas Current (versus previous month) |
||||||||
| Indicator | Oct Index | Sep Index | Change | Series Average |
Trend* | % Reporting Increase | % Reporting No Change |
% Reporting Decrease |
|
Revenue |
7.1 |
14.0 |
–6.9 |
10.8 |
3(+) |
26.2 |
54.7 |
19.1 |
|
Employment |
0.6 |
2.7 |
–2.1 |
5.9 |
2(+) |
11.5 |
77.6 |
10.9 |
|
Part–Time Employment |
–1.6 |
3.7 |
–5.3 |
1.2 |
1(–) |
4.9 |
88.6 |
6.5 |
|
Hours Worked |
5.5 |
6.6 |
–1.1 |
2.2 |
2(+) |
11.0 |
83.5 |
5.5 |
|
Wages and Benefits |
8.6 |
7.1 |
+1.5 |
13.9 |
5(+) |
14.5 |
79.6 |
5.9 |
|
Input Prices |
18.4 |
19.4 |
–1.0 |
24.8 |
6(+) |
22.7 |
73.0 |
4.3 |
|
Selling Prices |
4.1 |
2.2 |
+1.9 |
5.0 |
3(+) |
13.3 |
77.5 |
9.2 |
|
Capital Expenditures |
2.3 |
4.9 |
–2.6 |
9.7 |
2(+) |
12.7 |
76.9 |
10.4 |
| General Business Conditions Current (versus previous month) |
||||||||
| Indicator | Oct Index | Sep Index | Change | Series Average |
Trend** | % Reporting Improved | % Reporting No Change |
% Reporting Worsened |
|
Company Outlook |
7.8 |
9.7 |
–1.9 |
4.9 |
3(+) |
20.8 |
66.2 |
13.0 |
|
General Business Activity |
13.2 |
11.5 |
+1.7 |
2.7 |
3(+) |
24.9 |
63.3 |
11.7 |
| |
||||||||
| Indicator | Oct Index | Sep Index | Change | Series Average |
Trend* | % Reporting Increase | % Reporting No Change |
% Reporting Decrease |
|
Outlook Uncertainty† |
5.8 |
0.0 |
+5.8 |
12.9 |
1(+) |
19.8 |
66.3 |
14.0 |
| Business Indicators Relating to Facilities and Products in Texas Future (six months ahead) |
||||||||
| Indicator | Oct Index | Sep Index | Change | Series Average |
Trend* | % Reporting Increase | % Reporting No Change |
% Reporting Decrease |
|
Revenue |
36.3 |
31.9 |
+4.4 |
36.6 |
6(+) |
52.4 |
31.5 |
16.1 |
|
Employment |
19.4 |
19.5 |
–0.1 |
21.5 |
6(+) |
32.4 |
54.6 |
13.0 |
|
Part–Time Employment |
5.3 |
4.8 |
+0.5 |
6.3 |
3(+) |
15.0 |
75.3 |
9.7 |
|
Hours Worked |
9.1 |
9.0 |
+0.1 |
5.4 |
6(+) |
15.5 |
78.1 |
6.4 |
|
Wages and Benefits |
28.3 |
27.2 |
+1.1 |
35.6 |
6(+) |
34.6 |
59.1 |
6.3 |
|
Input Prices |
32.1 |
30.2 |
+1.9 |
43.4 |
166(+) |
38.5 |
55.1 |
6.4 |
|
Selling Prices |
19.1 |
14.5 |
+4.6 |
22.6 |
6(+) |
28.4 |
62.3 |
9.3 |
|
Capital Expenditures |
13.3 |
11.5 |
+1.8 |
23.0 |
5(+) |
25.6 |
62.0 |
12.3 |
| General Business Conditions Future (six months ahead) |
||||||||
| Indicator | Oct Index | Sep Index | Change | Series Average |
Trend** | % Reporting Improved | % Reporting No Change |
% Reporting Worsened |
|
Company Outlook |
17.6 |
20.8 |
–3.2 |
15.9 |
3(+) |
31.5 |
54.6 |
13.9 |
|
General Business Activity |
20.1 |
18.9 |
+1.2 |
12.7 |
3(+) |
33.7 |
52.7 |
13.6 |
Texas Retail Outlook Survey
October 27, 2020
Historical data are available from January 2007 to the most current release month.
| Business Indicators Relating to Facilities and Products in Texas Retail (versus previous month) |
||||||||
| Indicator | Oct Index | Sep Index | Change | Series Average |
Trend* | % Reporting Increase | % Reporting No Change |
% Reporting Decrease |
Retail Activity in Texas |
||||||||
|
Sales |
5.2 |
20.8 |
–15.6 |
5.7 |
2(+) |
23.7 |
57.7 |
18.5 |
|
Employment |
–2.1 |
2.3 |
–4.4 |
1.7 |
1(–) |
7.9 |
82.1 |
10.0 |
|
Part–Time Employment |
–4.0 |
1.7 |
–5.7 |
–2.2 |
1(–) |
6.0 |
84.0 |
10.0 |
|
Hours Worked |
–4.8 |
3.1 |
–7.9 |
–2.1 |
1(–) |
9.4 |
76.4 |
14.2 |
|
Wages and Benefits |
11.4 |
7.3 |
+4.1 |
9.1 |
3(+) |
15.6 |
80.2 |
4.2 |
|
Input Prices |
18.7 |
26.3 |
–7.6 |
18.7 |
6(+) |
24.6 |
69.5 |
5.9 |
|
Selling Prices |
19.0 |
22.6 |
–3.6 |
10.0 |
5(+) |
24.9 |
69.2 |
5.9 |
|
Capital Expenditures |
–2.2 |
–2.8 |
+0.6 |
7.4 |
8(–) |
6.5 |
84.8 |
8.7 |
|
Inventories |
1.9 |
–4.1 |
+6.0 |
2.4 |
1(+) |
28.2 |
45.4 |
26.3 |
Companywide Retail Activity |
||||||||
|
Companywide Sales |
4.9 |
6.6 |
–1.7 |
7.0 |
2(+) |
21.3 |
62.3 |
16.4 |
|
Companywide Internet Sales |
3.4 |
6.3 |
–2.9 |
6.2 |
3(+) |
14.6 |
74.2 |
11.2 |
| General Business Conditions, Retail Current (versus previous month) |
||||||||
| Indicator | Oct Index | Sep Index | Change | Series Average |
Trend** | % Reporting Improved | % Reporting No Change |
% Reporting Worsened |
|
Company Outlook |
14.8 |
8.9 |
+5.9 |
3.3 |
3(+) |
24.5 |
65.8 |
9.7 |
|
General Business Activity |
14.6 |
10.3 |
+4.3 |
–1.0 |
3(+) |
24.3 |
66.0 |
9.7 |
| Outlook Uncertainty Current (versus previous month) |
||||||||
| Indicator | Oct Index | Sep Index | Change | Series Average |
Trend* | % Reporting Increase | % Reporting No Change |
% Reporting Decrease |
|
Outlook Uncertainty† |
–2.0 |
0.0 |
–2.0 |
10.2 |
1(–) |
17.6 |
62.7 |
19.6 |
| Business Indicators Relating to Facilities and Products in Texas, Retail Future (six months ahead) |
||||||||
| Indicator | Oct Index | Sep Index | Change | Series Average |
Trend* | % Reporting Increase | % Reporting No Change |
% Reporting Decrease |
Retail Activity in Texas |
||||||||
|
Sales |
26.1 |
42.7 |
–16.6 |
31.9 |
6(+) |
48.5 |
29.0 |
22.4 |
|
Employment |
11.9 |
18.6 |
–6.7 |
11.8 |
6(+) |
25.6 |
60.7 |
13.7 |
|
Part–Time Employment |
7.6 |
5.0 |
+2.6 |
0.6 |
2(+) |
20.0 |
67.6 |
12.4 |
|
Hours Worked |
11.1 |
7.3 |
+3.8 |
2.7 |
6(+) |
20.0 |
71.1 |
8.9 |
|
Wages and Benefits |
27.6 |
24.8 |
+2.8 |
26.8 |
6(+) |
35.2 |
57.2 |
7.6 |
|
Input Prices |
28.0 |
32.7 |
–4.7 |
32.4 |
6(+) |
46.0 |
36.0 |
18.0 |
|
Selling Prices |
26.0 |
34.0 |
–8.0 |
28.5 |
6(+) |
48.0 |
30.0 |
22.0 |
|
Capital Expenditures |
14.0 |
21.8 |
–7.8 |
16.8 |
5(+) |
24.0 |
66.0 |
10.0 |
|
Inventories |
16.8 |
33.5 |
–16.7 |
8.3 |
6(+) |
37.9 |
41.1 |
21.1 |
Companywide Retail Activity |
||||||||
|
Companywide Sales |
22.6 |
38.0 |
–15.4 |
30.4 |
6(+) |
42.9 |
36.8 |
20.3 |
|
Companywide Internet Sales |
9.8 |
36.4 |
–26.6 |
21.7 |
7(+) |
24.4 |
61.0 |
14.6 |
| General Business Conditions, Retail Future (six months ahead) |
||||||||
| Indicator | Oct Index | Sep Index | Change | Series Average |
Trend** | % Reporting Improved | % Reporting No Change |
% Reporting Worsened |
|
Company Outlook |
17.7 |
27.3 |
–9.6 |
16.7 |
6(+) |
32.7 |
52.3 |
15.0 |
|
General Business Activity |
21.4 |
24.8 |
–3.4 |
12.4 |
3(+) |
36.4 |
48.6 |
15.0 |
*Shown is the number of consecutive months of expansion or contraction in the underlying indicator. Expansion is indicated by a positive index reading and denoted by a (+) in the table. Contraction is indicated by a negative index reading and denoted by a (–) in the table.
**Shown is the number of consecutive months of improvement or worsening in the underlying indicator. Improvement is indicated by a positive index reading and denoted by a (+) in the table. Worsening is indicated by a negative index reading and denoted by a (–) in the table.
†Added to survey in January 2018.
Data have been seasonally adjusted as necessary, with the exception of the outlook uncertainty index which does not yet have a sufficiently long time series to test for seasonality.
Texas Service Sector Outlook Survey
October 27, 2020
Texas Retail Outlook Survey
October 27, 2020
Texas Service Sector Outlook Survey
October 27, 2020
Comments from Survey Respondents
These comments are from respondents’ completed surveys and have been edited for publication.
Utilities
- We feel a softness in business activity.
Truck Transportation
- Companies are not getting back into the office. Relocation activity is much lower as many companies are not moving their employees around the country. Many are not making changes in their office relocations due to not working in the office.
Pipeline Transportation
- [We see] global ramifications with COVID-19 demand destruction, compounded by U.S. elections.
Support Activities for Transportation
- Our cost to provide service has increased; however, we are not able to increase our rates to cover the cost.
Warehousing and Storage
- We expect steady sailing over the next several months but expect to most likely see reduced crude exports across the entire Gulf Coast in 2021, due to the fact that few new wells are currently being drilled in the Permian. As the existing wells reduce production over time, with no new wells drilled to replace them, we will by default see lower production and lower exports, which make up the majority of our product movements. Thus, we will most likely see some retracement in our revenues. That will not, however, slow down our capital development of new assets and maintenance of our existing assets, nor do we expect to reduce head count in the coming year.
Credit Intermediation and Related Activities
- The activity for the real estate market has improved with the increase in residential and agricultural land acquisitions. There is a migration from metropolitan areas to the rural regions of Texas. This has buoyed land values, especially for smaller tracts of land less than 1,000 acres on average. Sales tax revenue continues to exceed receipts compared with last year to date.
- Federal stimulus is decreasing customer loan demand and resulting in decreased loan balances and revenue. On the other hand, loan losses are at historical lows (customer default rates are down).
- Our loan fund and our collision business are each doing very well. We are working on a large sustainability-linked bond issuance that will be meaningful. Our nonprofit continues to suffer from lack of grant funding for anything other than food or shelter in response to COVID-19. We have done some restructuring to be better able to manage it. I see very positive things on the horizon, unless the election derails it.
- We are beginning to see the effects of the lockdown on our customers, now that the federal stimulus has run its course. If the economy does not open back up soon, the damage will be far too severe to reverse quickly. If the economy is able to fully open soon, the business climate will rebound much quicker.
Securities, Commodity Contracts, and Other Financial Investments and Related Activities
- As a financial services company, we are highly impacted by changes in the investment markets. As such, we are greatly concerned with economic conditions.
- It is a tough business climate. It will probably stay that way until the whole economy picks up, especially oil and gas. Airlines and transportation are the largest users of oil and gas products.
- It feels like the social justice chaos has quieted a bit, although the upcoming election could certainly create more volatility. More [stimulus] is coming—it is just a function of timing and who gets elected. The long-term cost of that stimulus is an overhang, but the tsunami of money in the near term feels inevitable.
Insurance Carriers and Related Activities
- With COVID-19 cases spiking up in northeast Texas, more people are uncertain, which is impacting restaurants and travel, and people are getting weary of this situation. I think it has a negative effect on sentiment, which may affect the economy after the election news cycle goes away and people want to get back to "normal," whatever that is.
Real Estate
- For now, our foremost thought is to be cautious ahead of the election and just keep working and hope the government will keep the economy open; another closure would be disastrous.
- In our community, we have on the MLS [multiple listing service] 290 homes for sale and 588 agents attempting to market and sell properties. This makes for intense competition.
- With the election three weeks away, sales have slowed down. There is much concern about the election and still about the virus.
Professional, Scientific and Technical Services
- We have added additional product lines and got rid of several marginal ones.
- The outcome of the Nov. 3 election will be the main driver of my outlook on business activity. A Trump win equals disaster, while with a Biden win, there is hope.
- The political climate continues to drive demand for financial services.
- We are concerned about market disruption post-election. However, from discussions with clients and with our market outlook, we do expect strong demand in the fourth quarter, especially if there is a change in administration.
- With the election growing near, we are in a wait-and-see mode at the moment. How this is going to affect the real estate market is yet to be seen. If the Democrats win and start raising taxes on big corporations—raising the capital gains rate and income tax rate—it could be devastating to the real estate market.
- We are still seeing good collections on A/R [accounts receivable]. Billable hours are down 4 to 5 percent from last year, but rates are up a similar amount.
- The pace of activity is increasing. Demand is increasing, and our ability to communicate remotely has improved.
- Right now, the COVID-19 pandemic is spreading faster in El Paso. This impacts businesses, both from the customer side and from the manpower side. We are hoping that in six months we can have a more stable environment.
- Uncertainty regarding stimulus from the perspective of PPP [Paycheck Protection Program], infrastructure and transit is making future projections difficult. Since we work in the world of public infrastructure, all of these factors are important to us.
- Development and construction activity is picking up, especially in the residential subdivision and multifamily markets. E-commerce activity (development and construction of centers) has remained steady.
Administrative and Support Services
- We’ve seen no real changes from the September to October time frame. Our industrial customer base has remained flat for the past three months with very little future RFQs [requests for quotation] expected. Corporate aviation customers have remained constant but off from last year at 19 percent down. Commercial aviation customers have remained flat since March of this year, and we see no increase in the foreseeable future.
- The election outcome will dictate a lot regarding the six-month outlook; it is too hard to say right now.
- Labor, labor, labor; we need people. We are losing people and cannot find replacements. As long as the government is paying people not to work, guess what, they are not working. It is very frustrating.
- There has been no change in outlook between October and September. We are generally more optimistic over the near term (six-month horizon). Client activity appears to be increasing, and the number of client requests are increasing. We are uncertain if that optimism and activity are the result of historically low interest rates and the impact of stimulus or the result of sustained economic activity.
- The major uncertainty right now is the election. Once that is over, we will have better visibility into the future from a tax and economic perspective.
- Lack of support coming from D.C. is severely impacting all areas of my business, from financial to my desire to remain in business to the depression of being unable to help/keep employees.
- [Our outlook] six months from now is contingent on additional stimulus funds for small business, along with passing legislation that removes the taxability of forgiven PPP funds.
Waste Management and Remediation Services
- Demand for our product will improve when the public returns to schools, businesses, airports, stadiums, etc. Until those times, demand will remain depressed.
Educational Services
- As we move closer to a vaccine, and the more the public knows about the effects of COVID-19, the more at ease the public feels, and thus they begin to normalize life again. I have seen a lot of activity at retail outlets and strips and that makes me optimistic that we are getting back to normal. Cross your fingers!
Ambulatory Health Care Services
- Best of ecopolitical limericks: In less than a fortnight we will have election day; everyone lawyered up, so expect much disarray; awesome if our government would make a deal; under the illusion that we would heal; vaccines and the herd sadly will take us to May.
- An October surge in outpatient radiology is seen; we were impacted by storm days in September even though Houston was largely spared. [We are] currently at about 85 percent of the volume prior to COVID-19, so we are surviving but not yet thriving. We are installing a new MRI [machine] in one location.
- As mentioned last month, we have now hit the six-month overlap with our mandated shutdown in March-April-early May. Since dental hygiene patients make their six-month cleaning appointment while at their visit, we (and all dentists) are entering a period of six to eight weeks when there are no appointments on the books for regular cleanings/X-rays/doctor exams. For the typical dental practice, these type of appointments generate about one-third of revenue, and in the vast majority, over 50 percent of discoveries by the doctor of work that needs to be done. So, this will impact both October and November for most dentists.
Social Assistance
- The Texas Workforce Commission is approving every application for unemployment without review. This requires a hearing for each case, which is currently taking up 50 percent of the vice president of Human Resources’ time. Over 95 percent of these cases are denied.
Performing Arts, Spectator Sports and Related Industries
- We are worried about higher taxes and more government involvement, depending on who wins the election.
Museums, Historical Sites and Similar Institutions
- With holiday seasons, we will be increasing opening hours to accommodate school holidays. Currently, we are open 2.5 days per week. So we are nowhere near our normal seven-day-a-week schedule.
Amusement, Gambling and Recreation Industries
- In the hospitality business, the longer the pandemic goes on, whether shutdowns continue or not (perceptions are still dreary), the longer and harder it is going to be to get to any kind of normalcy, much less recovery.
Accommodation
- It's really hard to predict anything. Leisure travel has dropped off, and business travel has still not returned.
- [We have] an optimistic view to a lot of "unknowns" in terms of the variables that impact our business. In other words, "hoping for the best, preparing for the worst." With a vaccine and a ratcheting down of the politics, we could see a significant improvement in late Q1 or early Q2.
Food Services and Drinking Places
- The election seems to have a higher-than-normal importance this time around. Higher taxes and an administration that favors alternative fuels over carbon-based fuels would be a negative for the economies of our operating areas.
- We are thinking people are spending less and buying down. Sales have gone from 93 percent of last year to 85 percent. We need 700 new employees to reopen our dining rooms and can’t find them. The starting wage now at many of our stores is $12 an hour, but it is difficult to hire. Our [regional] unemployment rate is 6.7 percent.
- We are struggling to find people who want to work. High unemployment benefits are encouraging people to stay home and not work.
Repair and Maintenance
- We just see seasonal changes.
Merchant Wholesalers, Durable Goods
- The manufacturing community in North Texas continues to be plagued by depressed oil prices. Until these prices rise and stabilize to some degree, manufacturing will suffer.
- I feel good about the future, but with the increase in COVID-19 cases, I am concerned things will shut down again.
- We are seeing some commercial slowdown with small-to-large construction projects, but single-family and multifamily are still going very strong in residential. Election uncertainty seems to be adding to some of the slowdown in commercial construction. Industrial activity in oil and gas is still very slow.
Merchant Wholesalers, Nondurable Goods
- Sales have started to increase because the amount of road construction in our area has decreased, and access to our business has increased.
- As dining rooms continue to reopen and dining out continues to increase, our business continues to increase. Demand still continues to stay strong for dining out. The fourth quarter is typically our best quarter, and we expect this year to be reasonably good (within 10 percent of last year).
Motor Vehicle and Parts Dealers
- The decrease in sales for October is due to low new-vehicle inventory.
- As most business owners, we are concerned about election consequences.
- We are very concerned about the election.
- Inventories are starting to increase.
Building Material and Garden Equipment and Supplies Dealers
- Current business activity is good. Unfortunately, over the next six months, I feel that issues like the uncertainty of the pandemic, small business failures, the overall economy and election results could hurt our business going forward until this world gets back to some kind of normalcy.
Historical Data
Historical data can be downloaded dating back to January 2007.
Indexes
Download indexes for all indicators. For the definitions of all variables, see Data Definitions.
Texas Service Sector Outlook Survey |
Texas Retail Outlook Survey |
| Unadjusted | Unadjusted |
| Seasonally adjusted | Seasonally adjusted |
All Data
Download indexes and components of the indexes (percentage of respondents reporting increase, decrease, or no change). For the definitions of all variables, see Data Definitions.
Texas Service Sector Outlook Survey |
Texas Retail Outlook Survey |
| Unadjusted | Unadjusted |
| Seasonally adjusted | Seasonally adjusted |
Questions regarding the Texas Service Sector Outlook Survey can be addressed to Christopher Slijk at christopher.slijk@dal.frb.org.
Sign up for our email alert to be automatically notified as soon as the latest Texas Service Sector Outlook Survey is released on the web.