Texas Service Sector Activity Begins the Year Flat

Texas Service Sector Outlook Survey
Texas Service Sector Activity Begins the Year Flat
For this month’s survey, Texas business executives were asked supplemental questions on the impact of COVID-19, as well as the new Paycheck Protection Program. Results for these questions from the Texas Manufacturing Outlook Survey, Texas Service Sector Outlook Survey and Texas Retail Outlook Survey have been released together. Read the special questions results.
This month’s data release also includes annual seasonal factor revisions. Once per year, the Federal Reserve Bank of Dallas revises the historical data for the Texas Manufacturing Outlook Survey after calculating new seasonal adjustment factors. Annual seasonal revisions result in slight changes in the seasonally adjusted series. Read more information on seasonal adjustment.
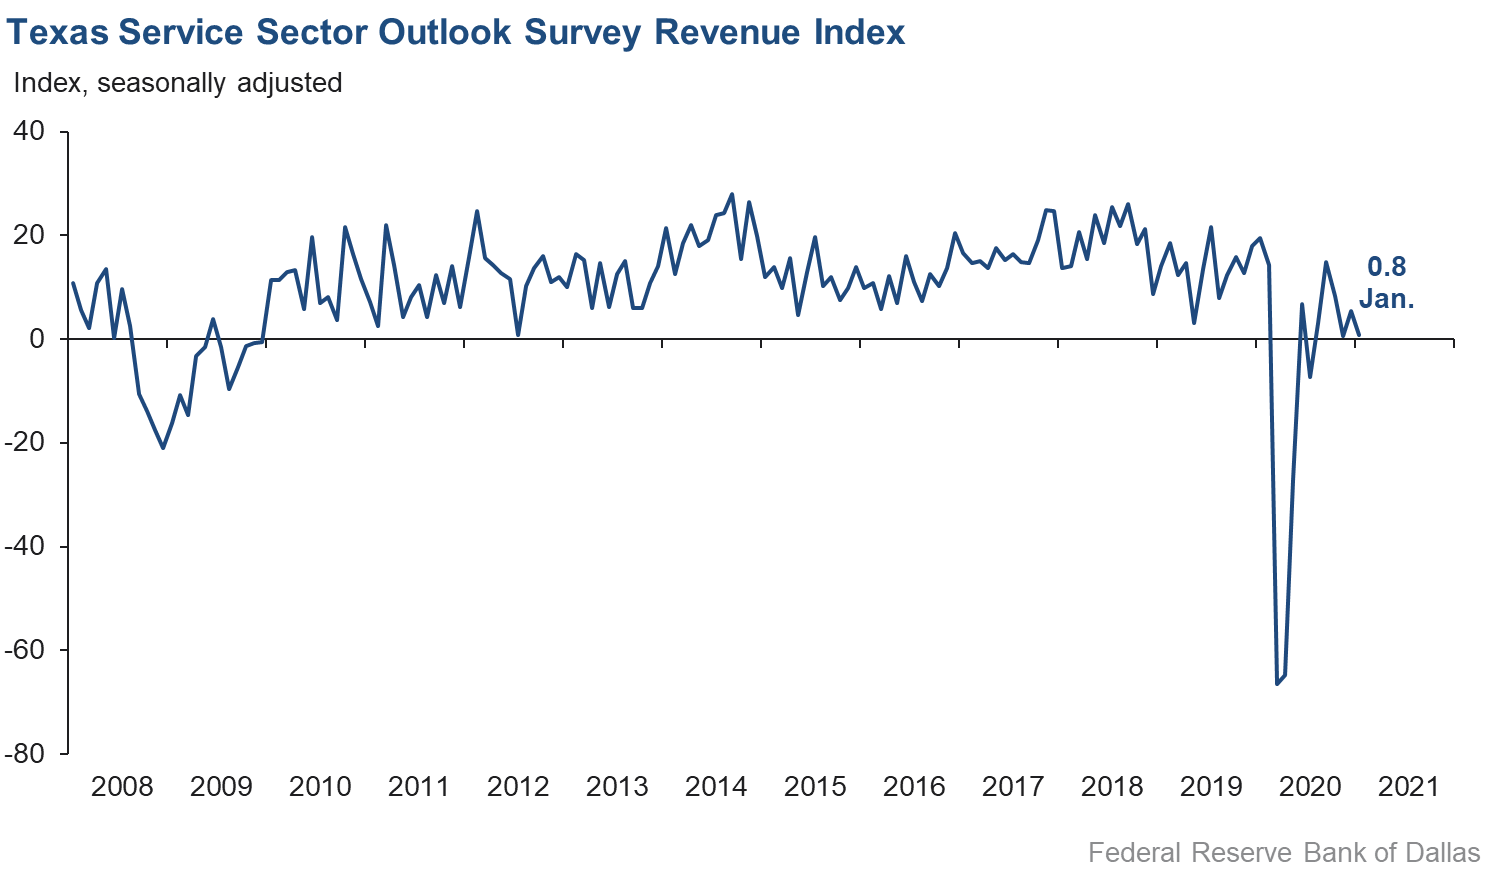
Activity in the Texas service sector was roughly flat in January, according to business executives responding to the Texas Service Sector Outlook Survey. The revenue index, a key measure of state service sector conditions, fell from 5.5 in December to 0.8 in January, indicating a flattening out of activity.
Labor market indicators suggest slower employment growth and little change in the hours worked in January. The employment index declined over four points to 1.6, while the part-time employment index was mostly unchanged at 0.6. The hours worked index was similarly flat at 1.6.
Perceptions of broader business conditions held steady compared with December. The general business activity index was roughly unchanged at -1.2, while the company outlook index dipped slightly from 2.3 to 1.0. The outlook uncertainty index rose slightly to 6.4.
Price pressures remained steady in January, while wage pressures increased. The selling prices index and input prices index were stable from December at 6.2 and 22.1, respectively. The wages and benefits index rose three points to 11.9, its highest value in nearly a year.
Respondents’ expectations regarding future business activity were slightly less optimistic compared with December. The future general business activity index fell two points to 23.2, while the future revenue index slipped nearly four points to 38.2, though still well above its 2020 average. Other indexes of future service sector activity such as employment declined but remained firmly positive, suggesting expectations of stronger activity in the first half of the year.

Texas Retail Outlook Survey
Texas Retail Sales Stable
Retail sales activity flattened out in January, according to business executives responding to the Texas Retail Outlook Survey. The sales index, a key measure of state retail activity, fell from 2.9 to -1.0, with nearly 30 percent of respondents noting decreased sales compared with December. Inventories declined, with the inventory index falling over four points to -2.9.
Retail labor market indicators suggest a slight uptick in employment and workweek length compared with December. The employment index ticked up to 1.5, while the part-time index slipped from 3.0 to 1.7. The hours worked index rose nearly five points to 1.7, pointing to slight improvement in employee working hours.
Retailers’ perceptions of broader business conditions were approximately the same in January as the end of 2020. The general business activity index rebounded over 11 points to -0.4, while the company outlook index was mostly unchanged at -1.9. The outlook uncertainty index rose about four points to 3.9, suggesting some net increase in respondents’ uncertainty.
Retail price and wage pressures eased slightly in January. The wages and benefits index slipped from 7.1 to 5.3, with nearly 15 percent of contacts noting increased wages, compared with 9 percent reporting declines. The selling prices index declined over three points to 19.8, while the input prices index slipped just slightly from 36.3—its highest level since 2018—to 35.1.
Despite softness in recent activity, retailers relayed optimism for the future in January. The future general business activity index remained elevated at 20.8, while the future sales index slipped slightly from 32.6 in December to 29.3 in January. Other indexes of future retail activity such as employment were mixed but remained positive, pointing to expectations of a solid rebound in 2021.
The Texas Retail Outlook Survey is a component of the Texas Service Sector Outlook Survey that uses information only from respondents in the retail and wholesale sectors.
Next release: February 23, 2021
Data were collected January 12–20, and 230 Texas service sector and 52 retail sector business executives responded to the survey. The Dallas Fed conducts the Texas Service Sector Outlook Survey monthly to obtain a timely assessment of the state’s service sector activity. Firms are asked whether revenue, employment, prices, general business activity and other indicators increased, decreased or remained unchanged over the previous month.
Survey responses are used to calculate an index for each indicator. Each index is calculated by subtracting the percentage of respondents reporting a decrease from the percentage reporting an increase. When the share of firms reporting an increase exceeds the share reporting a decrease, the index will be greater than zero, suggesting the indicator has increased over the prior month. If the share of firms reporting a decrease exceeds the share reporting an increase, the index will be below zero, suggesting the indicator has decreased over the prior month. An index will be zero when the number of firms reporting an increase is equal to the number of firms reporting a decrease. Data have been seasonally adjusted as necessary.
Texas Service Sector Outlook Survey
Historical data are available from January 2007 to the most current release month.
| Business Indicators Relating to Facilities and Products in Texas Current (versus previous month) | ||||||||
| Indicator | Jan Index | Dec Index | Change | Series Average | Trend* | % Reporting Increase | % Reporting No Change | % Reporting Decrease |
Revenue | 0.8 | 5.5 | –4.7 | 10.7 | 6(+) | 24.5 | 51.9 | 23.7 |
Employment | 1.6 | 5.7 | –4.1 | 5.9 | 6(+) | 10.7 | 80.2 | 9.1 |
Part–Time Employment | 0.6 | 0.9 | –0.3 | 1.2 | 2(+) | 5.9 | 88.7 | 5.3 |
Hours Worked | 1.6 | 1.8 | –0.2 | 2.2 | 5(+) | 9.5 | 82.6 | 7.9 |
Wages and Benefits | 11.9 | 8.9 | +3.0 | 13.8 | 8(+) | 15.6 | 80.7 | 3.7 |
Input Prices | 22.1 | 22.2 | –0.1 | 24.8 | 9(+) | 24.9 | 72.3 | 2.8 |
Selling Prices | 6.2 | 6.6 | –0.4 | 5.0 | 6(+) | 15.4 | 75.3 | 9.2 |
Capital Expenditures | 4.3 | 3.0 | +1.3 | 9.6 | 5(+) | 13.5 | 77.3 | 9.2 |
| General Business Conditions Current (versus previous month) | ||||||||
| Indicator | Jan Index | Dec Index | Change | Series Average | Trend** | % Reporting Improved | % Reporting No Change | % Reporting Worsened |
Company Outlook | 1.0 | 2.3 | –1.3 | 4.9 | 6(+) | 17.6 | 65.8 | 16.6 |
General Business Activity | –1.2 | –2.1 | +0.9 | 2.7 | 3(–) | 17.3 | 64.2 | 18.5 |
| Indicator | Jan Index | Dec Index | Change | Series Average | Trend* | % Reporting Increase | % Reporting No Change | % Reporting Decrease |
Outlook Uncertainty† | 6.4 | 5.2 | +1.2 | 12.7 | 4(+) | 20.6 | 65.2 | 14.2 |
| Business Indicators Relating to Facilities and Products in Texas Future (six months ahead) | ||||||||
| Indicator | Jan Index | Dec Index | Change | Series Average | Trend* | % Reporting Increase | % Reporting No Change | % Reporting Decrease |
Revenue | 38.2 | 42.1 | –3.9 | 36.7 | 9(+) | 51.6 | 35.0 | 13.4 |
Employment | 22.0 | 32.1 | –10.1 | 21.6 | 9(+) | 33.9 | 54.2 | 11.9 |
Part–Time Employment | 9.0 | 8.9 | +0.1 | 6.3 | 8(+) | 12.7 | 83.6 | 3.7 |
Hours Worked | 10.8 | 12.4 | –1.6 | 5.5 | 9(+) | 13.8 | 83.2 | 3.0 |
Wages and Benefits | 37.8 | 34.1 | +3.7 | 35.6 | 9(+) | 40.4 | 56.9 | 2.6 |
Input Prices | 37.6 | 38.5 | –0.9 | 43.3 | 169(+) | 42.6 | 52.3 | 5.0 |
Selling Prices | 24.4 | 28.8 | –4.4 | 22.7 | 9(+) | 31.6 | 61.2 | 7.2 |
Capital Expenditures | 23.4 | 24.3 | –0.9 | 22.9 | 8(+) | 29.7 | 64.0 | 6.3 |
| General Business Conditions Future (six months ahead) | ||||||||
| Indicator | Jan Index | Dec Index | Change | Series Average | Trend** | % Reporting Improved | % Reporting No Change | % Reporting Worsened |
Company Outlook | 23.2 | 23.3 | –0.1 | 16.1 | 6(+) | 34.0 | 55.1 | 10.8 |
General Business Activity | 23.2 | 25.2 | –2.0 | 12.9 | 6(+) | 34.0 | 55.2 | 10.8 |
Historical data are available from January 2007 to the most current release month.
| Business Indicators Relating to Facilities and Products in Texas Retail (versus previous month) | ||||||||
| Indicator | Jan Index | Dec Index | Change | Series Average | Trend* | % Reporting Increase | % Reporting No Change | % Reporting Decrease |
| Retail Activity in Texas | ||||||||
Sales | –1.0 | 2.9 | –3.9 | 5.6 | 1(–) | 28.4 | 42.2 | 29.4 |
Employment | 1.5 | 0.8 | +0.7 | 1.7 | 2(+) | 9.1 | 83.3 | 7.6 |
Part–Time Employment | 1.7 | 3.0 | –1.3 | –2.1 | 2(+) | 5.0 | 91.7 | 3.3 |
Hours Worked | 1.7 | –3.1 | +4.8 | –2.1 | 1(+) | 11.4 | 78.9 | 9.7 |
Wages and Benefits | 5.3 | 7.1 | –1.8 | 9.0 | 6(+) | 14.1 | 77.1 | 8.8 |
Input Prices | 35.1 | 36.3 | –1.2 | 18.9 | 9(+) | 35.5 | 64.1 | 0.4 |
Selling Prices | 19.8 | 23.2 | –3.4 | 10.2 | 8(+) | 32.1 | 55.5 | 12.3 |
Capital Expenditures | –1.9 | 1.5 | –3.4 | 7.3 | 1(–) | 8.2 | 81.7 | 10.1 |
Inventories | –2.9 | 1.4 | –4.3 | 2.4 | 1(–) | 22.1 | 53.0 | 25.0 |
| Companywide Retail Activity | ||||||||
Companywide Sales | 8.1 | 7.3 | +0.8 | 7.0 | 2(+) | 30.4 | 47.3 | 22.3 |
Companywide Internet Sales | 1.8 | 7.4 | –5.6 | 6.1 | 2(+) | 20.8 | 60.2 | 19.0 |
| General Business Conditions, Retail Current (versus previous month) | ||||||||
| Indicator | Jan Index | Dec Index | Change | Series Average | Trend** | % Reporting Improved | % Reporting No Change | % Reporting Worsened |
Company Outlook | –1.9 | –1.1 | –0.8 | 3.3 | 2(–) | 13.0 | 72.2 | 14.9 |
General Business Activity | –0.4 | –11.6 | +11.2 | –1.0 | 3(–) | 16.3 | 67.0 | 16.7 |
| Outlook Uncertainty Current (versus previous month) | ||||||||
| Indicator | Jan Index | Dec Index | Change | Series Average | Trend* | % Reporting Increase | % Reporting No Change | % Reporting Decrease |
Outlook Uncertainty† | 3.9 | 0.0 | +3.9 | 9.9 | 1(+) | 15.4 | 73.1 | 11.5 |
| Business Indicators Relating to Facilities and Products in Texas, Retail Future (six months ahead) | ||||||||
| Indicator | Jan Index | Dec Index | Change | Series Average | Trend* | % Reporting Increase | % Reporting No Change | % Reporting Decrease |
| Retail Activity in Texas | ||||||||
Sales | 29.3 | 32.6 | –3.3 | 31.9 | 9(+) | 46.9 | 35.5 | 17.6 |
Employment | 15.2 | 20.2 | –5.0 | 11.8 | 9(+) | 25.4 | 64.5 | 10.2 |
Part–Time Employment | 11.1 | 0.6 | +10.5 | 0.7 | 6(+) | 13.2 | 84.7 | 2.1 |
Hours Worked | 1.1 | 0.6 | +0.5 | 2.6 | 9(+) | 8.4 | 84.3 | 7.3 |
Wages and Benefits | 37.8 | 35.7 | +2.1 | 27.1 | 9(+) | 40.9 | 56.0 | 3.1 |
Input Prices | 36.0 | 53.0 | –17.0 | 32.6 | 9(+) | 42.0 | 52.0 | 6.0 |
Selling Prices | 24.0 | 47.0 | –23.0 | 28.7 | 9(+) | 32.0 | 60.0 | 8.0 |
Capital Expenditures | 26.0 | 20.0 | +6.0 | 16.9 | 8(+) | 30.0 | 66.0 | 4.0 |
Inventories | 34.0 | 14.5 | +19.5 | 8.6 | 9(+) | 46.4 | 41.2 | 12.4 |
| Companywide Retail Activity | ||||||||
Companywide Sales | 31.3 | 31.0 | +0.3 | 30.4 | 9(+) | 44.7 | 42.0 | 13.4 |
Companywide Internet Sales | 39.5 | 33.3 | +6.2 | 21.8 | 10(+) | 47.4 | 44.7 | 7.9 |
| General Business Conditions, Retail Future (six months ahead) | ||||||||
| Indicator | Jan Index | Dec Index | Change | Series Average | Trend** | % Reporting Improved | % Reporting No Change | % Reporting Worsened |
Company Outlook | 25.2 | 24.5 | +0.7 | 16.8 | 9(+) | 36.4 | 52.4 | 11.2 |
General Business Activity | 20.8 | 20.3 | +0.5 | 12.6 | 6(+) | 33.6 | 53.6 | 12.8 |
*Shown is the number of consecutive months of expansion or contraction in the underlying indicator. Expansion is indicated by a positive index reading and denoted by a (+) in the table. Contraction is indicated by a negative index reading and denoted by a (–) in the table.
**Shown is the number of consecutive months of improvement or worsening in the underlying indicator. Improvement is indicated by a positive index reading and denoted by a (+) in the table. Worsening is indicated by a negative index reading and denoted by a (–) in the table.
†Added to survey in January 2018.
Data have been seasonally adjusted as necessary, with the exception of the outlook uncertainty index which does not yet have a sufficiently long time series to test for seasonality.
Texas Service Sector Outlook Survey
Texas Retail Outlook Survey
Texas Service Sector Outlook Survey
Comments from Survey Respondents
These comments are from respondents’ completed surveys and have been edited for publication.
- The general elections and now the transition in leadership of the elected officials have caused more uncertainty in the business climate.
- We are seeing signs of improved activity.
- With the election of Joe Biden, everything is uncertain. Taxes going up, regulations increasing, the Green New Deal and spending like a drunken sailor does not make for a rosy future.
- Challenges from COVID-19-related local and global effect uncertainties remain, but the outlook continues to be encouraging for 2021.
- Uncertainty about revenue and purchasing decisions has increased especially in light of our prospects' concerns about increased regulation. Uncertainty about the economic outlook has caused our company to scrutinize any new hiring.
- Government stimulus decreases our revenue.
- There is a great deal of concern about future tax consequences for businesses and individuals. The impact of the government assistance programs on inflation and the potential increase in interest rates could impact the cost of doing business. These concerns create more uncertainty.
- We see continued pressure on declining retail activity (restaurants/services/consumer spending, hospitality and business travel). Demand for construction (land development, industrial/flex, single-family, multifamily) is still strong.
- We still worry about the increases in material costs for customers; pricing affordability is compromised.
- [These are] tough markets and conditions.
- We have 25 separate job openings in our company right now. We have been voted best place to work for 13 years, have a great culture, fair pay, five weeks PTO [paid time off], and yet we receive less than two applications a day per role right now. Prior to COVID, we received 500–1,200 applications a month. How does one explain that? This is including a large volume of outreach we do. We specifically highlight the opportunity for retail, restaurant and hospitality employees to transition into our industry, but there is not a flood of candidates as you would expect with the news you read. Maybe my mind is not clear but the picture painted on the news and the experience I see through recruiting do not match. I would argue there is low unemployment in white-collar jobs among the people that actually want to work, especially in Dallas, San Antonio and Houston. Our Phoenix office does not have as much difficulty recruiting. We have also seen a massive change in salary expectations. We just lost a solid property manager in San Antonio who went to do data entry for $65,000 a year. Our staff interviewed a salesperson whose pay was $95,000. They also interviewed a vice president from a local construction company that had been in charge of one little piece of their benefits program, and she made $250,000. There is very high pressure on the system related to pay and what is acceptable work. This is our company’s No. 1 challenge. The stories of horrible unemployment don't seem to match with the reality of the marketplace. Or, in this environment, the unemployed are content to remain as such.
- Our biggest concern is the lack of residential housing available for sale. Buyer demand significantly outstrips supply. Lack of subcontractors and labor are a huge drag on local builders to ramp up production to levels that would positively impact the housing shortage we are experiencing. Low interest rates are driving buyer demand, but lack of inventory is choking down transaction flow.
- The lack of effective distribution of the COVID vaccine is slowing the reopening of many tenants or limiting their ability to return to more normal activity. This needs to be a much higher priority and needs a much greater amount of coordination.
- The surge in the virus and the attack on the U.S. Capitol caused concern to buyers. There is a lot of uncertainty again. I am positive. I feel that with more vaccinations, people will begin to move forward again.
- [I am worried about] the pandemic, the Oil Patch Bust, a self-induced economic recession/depression, a divisive election that is going to be divisive for a long, long time and the inflation beast, which is already present–food, gas and utilities. Manufacturer supplies and supply lines are in disarray. Over 70 million Americans don't trust government and the media. I think at least half of the American psyche (the intelligent half) is so angry and damaged that you can just write off the decade of the 20s. They don't intend to participate in anything—elections, economy, politics or commerce.
- As a leader in the live events industry, our 40+-year-old company and many other companies like us are without real income for over 10 months now. We don't see a return until third quarter 2021, AND cash is becoming a bigger issue daily for all of us.
- The vaccine is taking too long to get out. This and the political unrest are stalling recovery. We need to get the vaccine distributed, cases of COVID-19 down and people back in their offices to realize a significant change.
- The misinformation spread via social media and directly from political leaders has created two sets of facts and realities, which have made leading and inspiring teams on a local level incredibly difficult. Small businesses have enough on their plates trying to get through this pandemic. We need our leaders to cut the politics and help us win against the virus and against misinformation.
- Now that the vaccine has finally been approved and is being administered, we feel the commercial real estate market will begin to improve. As long as interest rates remain low, we believe we will see a 20 percent jump in our revenue over 2020. That being said, if our new administration raises the capital gain's rate and corporate rates too high, the economy may slow to recession levels. We will know a lot more in the next six to eight months.
- The Jan. 6 Capitol violence and messaging of future violence creates uncertainty as to how the economy will perform.
- There is so much uncertainty, yet land development and corporate relocations to Texas and expansion continue. Interest rates being low helps significantly. There is concern about health insurance premiums in 2021 and cost of benefits.
- We had a strong 2020 because we had several contracts already secured. However, we are experiencing a much weaker business development pipeline as nonprofits are being much more conservative with their spending and determining that planning and capacity-building can wait.
- Both construction activity and services for new construction are steady. Projects are associated with residential land development (subdivisions) and warehouses. There is a limited amount of new apartments and no retail or office.
- The insurrection at the Capitol on Jan. 6 has increased my uncertainty about the future.
- There have been permanent losses to the travel experience with the permanent closure of so many restaurants, attractions and small businesses that make up the destination.
- Hiring and the need for help recruiting professional talent slowed in mid-December and has not yet picked up with the new year. We are hoping to see improvement with increased distribution of the vaccine(s). Currently, we are recruiting for mid-level positions in health care and some return of mid-level [positions] in manufacturing and commercial real estate.
- [There is] Continued uncertainty with respect to underlying economic factors: (a) infection and death rates related to COVID-19, (b) pending distribution of vaccines, (c) impact of stimulus 2.0 (or 3.0), (d) favorable impact of low interest rates and improving energy prices and (e) unknowns relating to domestic unrest/insurgency.
- The overall feeling is of general relief. Maybe the past six-plus months of craziness will stop or at least slow down enough to concentrate on the important things. The aircraft sector has increased in commercial and corporate aircraft inspections, both through utilization rates and calendar items being complied with again. The industrial sector overall has been increasing, with the only holdout still being heavy oilfield-related products.
- The political and social instability in our country is causing a negative outlook for business.
- Political instability and the change in administrations aren’t exactly helping business confidence right now.
- Passage of the most recent COVID-19 funding bill and release of an improved state budget forecast have both helped our situation.
- As of January 2021, health care providers are getting a better understanding of COVID-19’s impact on health care business operations and management of patients and services. There is, therefore, some degree of confidence and clarity on a way to move forward. Not yet clear on the degree of the ramp-up of the business due to new variations of COVID-19 surfacing at this point in January.
- Monthly limerick and pondering: Transition in power leaves some investors stressed and afraid; doctors burning out as too many they are unable to persuade; vaccine works against spike protein; Fed may soon find it is time to wean; as sadly, many novices are treating stocks as a penny arcade.
- January typically slows down due to large patient copays and deductibles.
- We are peaking with COVID activity right now. With the ongoing vaccine rollout, I am increasingly confident of a return to normal six months into the future. That will decrease our activity level but likely reduce total cost and improve operating performance. These are very unusual times.
- We need additional labor. We are down 80 employees—or 20 percent—and are seeing a record-low number of applications. We expect that high unemployment benefits and stimulus are keeping many out of the job market. We need better policy.
- The late-December surge has caused cancellation of almost all meetings and weddings. Our city has closed our public buildings, convention center and the Alamodome to any public events through January, canceling at least three multihotel groups and a public event. January, February and the first half of March will be especially difficult.
- The current situation has everything to do with the spike in COVID-19 and our city’s decision to close our city-owned convention center for January.
- The risk of Democrat labor reforms, especially a nationwide minimum wage, is a serious issue for our restaurants.
- I am still waiting for [our partner’s] corporate office to authorize me to go back to operate my hot dog carts outside their stores; those represent 60 percent of my revenues.
- Restaurant ... caterer. What more is there to say?
- COVID-19 has hampered our business and our industry materially.
- We are concerned about the new administration taxing small business and what the new policies will do to the consumer.
- The unstable economic situation prevents people from spending on nonessentials at this time.
- Six months from now would represent early summer 2021, which in 2020 saw significant COVID-related funding begin to trickle down from the federal government, largely for housing assistance in the nonprofit sector. That is the primary reason for an expected decrease in revenue for the six-month outlook.
- Everyone we do business with is worried about the new administration’s implementing regulations, open borders taking jobs and a possible tax increase. I think everyone seems to have a wait-and-see attitude before making large purchases right now, and I believe that will be the case for a while.
- COVID is still weighing heavily on the restaurant industry. As an industry, a lot of concepts have pivoted to take-out, and that has been a bright spot. I'm also aware of some ghost kitchens that are also driving new revenue streams for established brands. If the vaccine gets better penetration into the general public, I think the anxiety level will fall. Obviously, the warmer months have lessened the spread of COVID (looking back on 2020), so the combination of warmer months, vaccine, increased herd immunity and (unfortunately) sicker people dying will lessen the future spread. That will ultimately allow people to return to dining out, and my industry (and my business) will be stronger than before.
- We see retail business holding steady despite significant increases in COVID-19 infections.
- We have COVID-19 concerns.
- There will be changes taking place at the end of the first quarter with the sale of approximately 20–25 percent of the business.
- We expect the first quarter to be soft and each quarter to improve, with the strength of the market being in the last half and a solid fourth quarter. COVID-19 continues to present significant concerns and problems. OEMs (original equipment manufacturers) are challenged to provide consistent and/or adequate new-vehicle inventory, especially in segments where new products for 2021 are introduced. Impact of election? Control? Regulation? Health care? Taxes? Let's see what happens.
Historical Data
Historical data can be downloaded dating back to January 2007.
Indexes
Download indexes for all indicators. For the definitions of all variables, see Data Definitions.
Texas Service Sector Outlook Survey |
Texas Retail Outlook Survey |
| Unadjusted | Unadjusted |
| Seasonally adjusted | Seasonally adjusted |
All Data
Download indexes and components of the indexes (percentage of respondents reporting increase, decrease, or no change). For the definitions of all variables, see Data Definitions.
Texas Service Sector Outlook Survey |
Texas Retail Outlook Survey |
| Unadjusted | Unadjusted |
| Seasonally adjusted | Seasonally adjusted |
Questions regarding the Texas Service Sector Outlook Survey can be addressed to Christopher Slijk at christopher.slijk@dal.frb.org.
Sign up for our email alert to be automatically notified as soon as the latest Texas Service Sector Outlook Survey is released on the web.