Texas Service Sector Activity Grows Slightly

Texas Service Sector Outlook Survey
Texas Service Sector Activity Grows Slightly
For this month’s survey, Texas business executives were asked supplemental questions on the impact of COVID-19. Results for these questions from the Texas Manufacturing Outlook Survey, Texas Service Sector Outlook Survey and Texas Retail Outlook Survey have been released together. Read the special questions results.
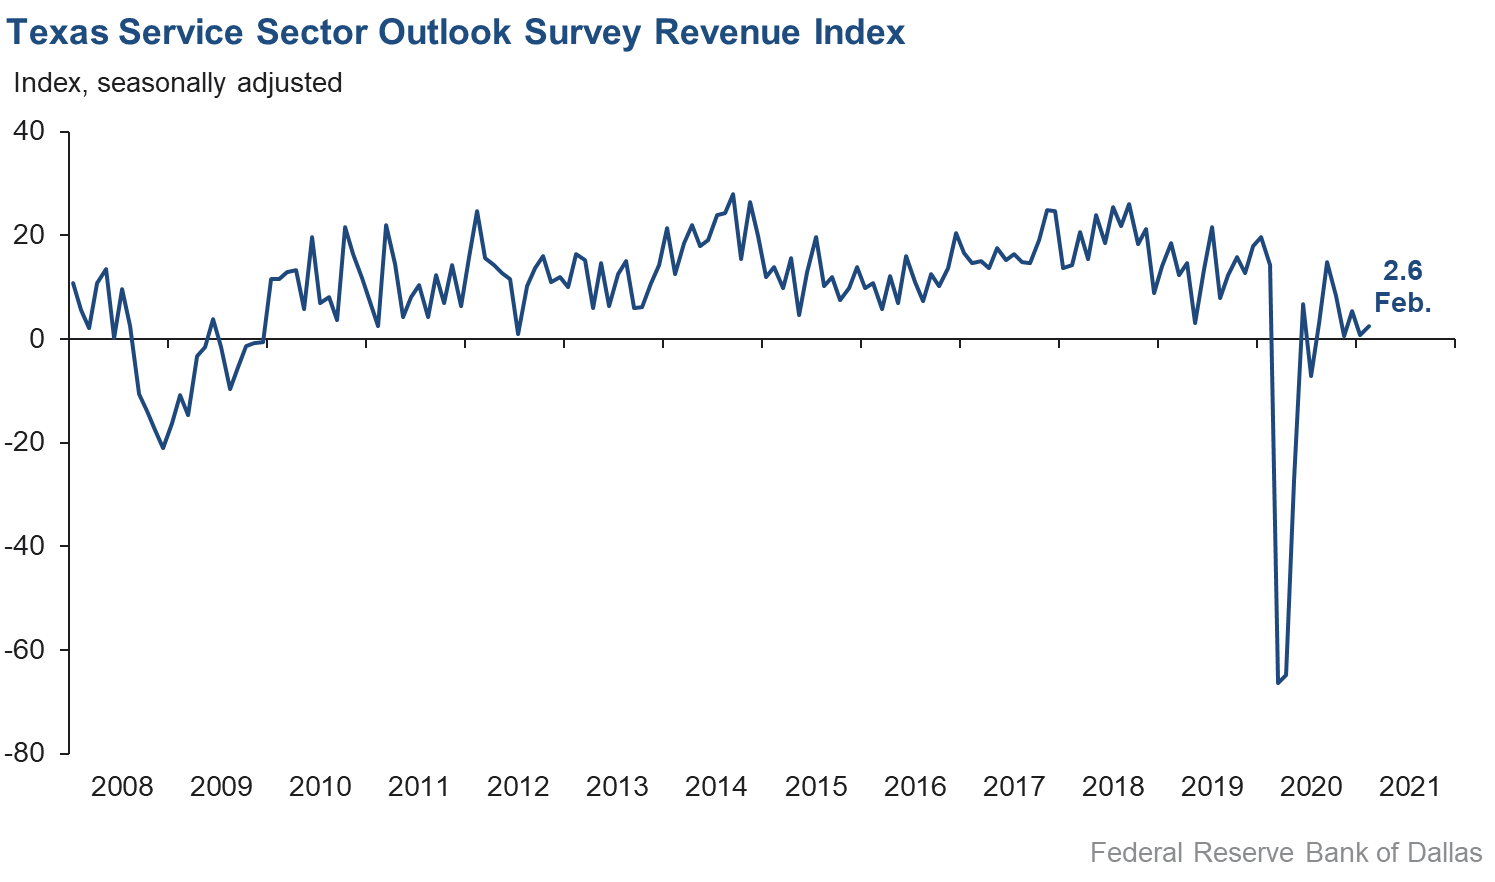
Activity in the Texas service sector increased slightly in February, according to business executives responding to the Texas Service Sector Outlook Survey. The revenue index, a key measure of state service sector conditions, picked up from 0.8 in January to 2.6 in February.
Labor market indicators suggest slight gains in employment and average hours worked in February. The employment index added about one point to rise to 2.7, while the part-time employment index was roughly flat at 1.3. The hours worked index rose from 1.6 to 3.3, with nearly 11 percent reporting lengthening employees’ hours.
Perceptions of broader business conditions improved compared with January. The general business activity index rebounded into positive territory, rising over six points to 5.0, while the company outlook index improved from 1.0 to 2.7—its best reading since last October. The outlook uncertainty index declined from 6.4 in January to 1.7 in February, and the capital expenditures index rose to a one-year high of 7.0.
Price pressures rose in February while wage pressures remained stable. The selling prices index rose over three points to 9.4, while the input prices index rose from 22.1 to 24.4—both reaching their highest readings since before the COVID-19 pandemic. The wages and benefits index held mostly flat at 12.5, with 17 percent of respondents reporting higher labor costs compared with January.
Respondents’ expectations regarding future business activity were increasingly optimistic compared with January. The future general business activity index increased to a three-year high of 27.7, while the future revenue index advanced over eight points to 46.3. Other indexes of future service sector activity such as employment and capital expenditures also rose, suggesting an acceleration in activity over the next six months.

Texas Retail Outlook Survey
Texas Retail Sales Continue to Hold Steady
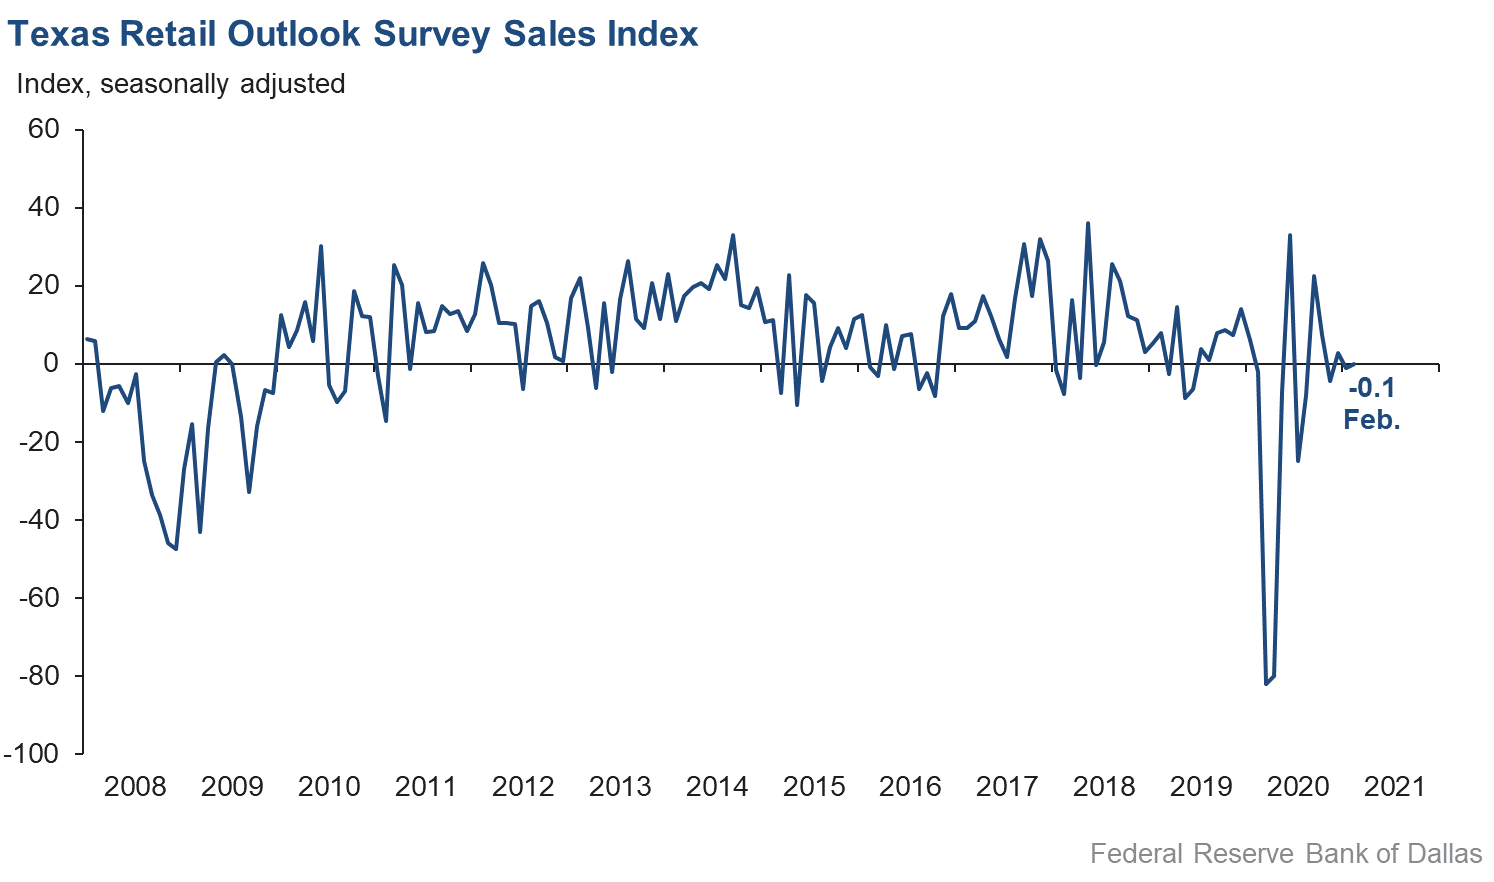
Retail sales activity remained flat in February, according to business executives responding to the Texas Retail Outlook Survey. The sales index, a key measure of state retail activity, was roughly unchanged at -0.1, with about one-half of respondents noting some change in sales compared with January—responses were evenly split between those noting increases and those seeing decreases. Inventories posted an increase, with the inventories index rising from -2.9 to 2.1.
Retail labor market indicators weakened, with employment and average workweek length falling compared with January. The employment index slipped from 1.5 to -2.0, while the part-time index declined from 1.7 to -2.2. The hours worked index plunged 12 points to -10.3, its weakest reading since last August.
Retailers’ perceptions of broader business conditions worsened in February. The general business activity index weakened from -0.4 to -3.5, while the company outlook index shed nearly five points to -6.8—its lowest reading since May 2020. The outlook uncertainty index was basically unchanged at 4.3.
Retailers saw significant increases in price pressures and slight increases in wage pressures in February. The selling prices index registered an 18-point hike to 37.7—an all-time high since the survey’s inception in 2007. The input prices index slipped about three points to 32.2, though this remains well above last year’s average. The wages and benefits index increased slightly from 5.3 to 7.1.
Retailers continued to note optimism for future activity despite recent turbulence. The future general business activity index surged from 20.8 to 30.6, while the future sales index rose to a five-month high of 37.6. Other indexes of future retail activity such as employment remained firmly positive, suggesting a strengthening in activity as the year goes on.
The Texas Retail Outlook Survey is a component of the Texas Service Sector Outlook Survey that uses information only from respondents in the retail and wholesale sectors.
Next release: March 30, 2021
Data were collected February 9–17, and 205 Texas service sector and 47 retail sector business executives responded to the survey. The Dallas Fed conducts the Texas Service Sector Outlook Survey monthly to obtain a timely assessment of the state’s service sector activity. Firms are asked whether revenue, employment, prices, general business activity and other indicators increased, decreased or remained unchanged over the previous month.
Survey responses are used to calculate an index for each indicator. Each index is calculated by subtracting the percentage of respondents reporting a decrease from the percentage reporting an increase. When the share of firms reporting an increase exceeds the share reporting a decrease, the index will be greater than zero, suggesting the indicator has increased over the prior month. If the share of firms reporting a decrease exceeds the share reporting an increase, the index will be below zero, suggesting the indicator has decreased over the prior month. An index will be zero when the number of firms reporting an increase is equal to the number of firms reporting a decrease. Data have been seasonally adjusted as necessary.
Texas Service Sector Outlook Survey
Historical data are available from January 2007 to the most current release month.
| Business Indicators Relating to Facilities and Products in Texas Current (versus previous month) | ||||||||
| Indicator | Feb Index | Jan Index | Change | Series Average | Trend* | % Reporting Increase | % Reporting No Change | % Reporting Decrease |
Revenue | 2.6 | 0.8 | +1.8 | 10.7 | 7(+) | 26.4 | 49.8 | 23.8 |
Employment | 2.7 | 1.6 | +1.1 | 5.9 | 7(+) | 14.1 | 74.6 | 11.4 |
Part–Time Employment | 1.3 | 0.6 | +0.7 | 1.2 | 3(+) | 8.3 | 84.7 | 7.0 |
Hours Worked | 3.3 | 1.6 | +1.7 | 2.2 | 6(+) | 10.9 | 81.5 | 7.6 |
Wages and Benefits | 12.5 | 11.9 | +0.6 | 13.8 | 9(+) | 16.9 | 78.7 | 4.4 |
Input Prices | 24.4 | 22.1 | +2.3 | 24.8 | 10(+) | 27.5 | 69.4 | 3.1 |
Selling Prices | 9.4 | 6.2 | +3.2 | 5.0 | 7(+) | 17.9 | 73.5 | 8.5 |
Capital Expenditures | 7.0 | 4.3 | +2.7 | 9.5 | 6(+) | 14.5 | 78.0 | 7.5 |
| General Business Conditions Current (versus previous month) | ||||||||
| Indicator | Feb Index | Jan Index | Change | Series Average | Trend** | % Reporting Improved | % Reporting No Change | % Reporting Worsened |
Company Outlook | 2.7 | 1.0 | +1.7 | 4.8 | 7(+) | 18.3 | 66.1 | 15.6 |
General Business Activity | 5.0 | –1.2 | +6.2 | 2.7 | 1(+) | 21.1 | 62.9 | 16.1 |
| Indicator | Feb Index | Jan Index | Change | Series Average | Trend* | % Reporting Increase | % Reporting No Change | % Reporting Decrease |
Outlook Uncertainty† | 1.7 | 6.4 | –4.7 | 12.4 | 5(+) | 17.0 | 67.7 | 15.3 |
| Business Indicators Relating to Facilities and Products in Texas Future (six months ahead) | ||||||||
| Indicator | Feb Index | Jan Index | Change | Series Average | Trend* | % Reporting Increase | % Reporting No Change | % Reporting Decrease |
Revenue | 46.3 | 38.2 | +8.1 | 36.7 | 10(+) | 57.0 | 32.3 | 10.7 |
Employment | 28.8 | 22.0 | +6.8 | 21.6 | 10(+) | 36.4 | 56.0 | 7.6 |
Part–Time Employment | 6.3 | 9.0 | –2.7 | 6.3 | 9(+) | 14.1 | 78.1 | 7.8 |
Hours Worked | 6.7 | 10.8 | –4.1 | 5.5 | 10(+) | 12.3 | 82.1 | 5.6 |
Wages and Benefits | 33.5 | 37.8 | –4.3 | 35.6 | 10(+) | 38.5 | 56.4 | 5.0 |
Input Prices | 36.2 | 37.6 | –1.4 | 43.3 | 170(+) | 39.9 | 56.4 | 3.7 |
Selling Prices | 23.8 | 24.4 | –0.6 | 22.7 | 10(+) | 30.8 | 62.2 | 7.0 |
Capital Expenditures | 26.0 | 23.4 | +2.6 | 23.0 | 9(+) | 31.1 | 63.8 | 5.1 |
| General Business Conditions Future (six months ahead) | ||||||||
| Indicator | Feb Index | Jan Index | Change | Series Average | Trend** | % Reporting Improved | % Reporting No Change | % Reporting Worsened |
Company Outlook | 26.9 | 23.2 | +3.7 | 16.1 | 7(+) | 39.0 | 48.8 | 12.1 |
General Business Activity | 27.7 | 23.2 | +4.5 | 13.0 | 7(+) | 37.5 | 52.7 | 9.8 |
Historical data are available from January 2007 to the most current release month.
| Business Indicators Relating to Facilities and Products in Texas Retail (versus previous month) | ||||||||
| Indicator | Feb Index | Jan Index | Change | Series Average | Trend* | % Reporting Increase | % Reporting No Change | % Reporting Decrease |
| Retail Activity in Texas | ||||||||
Sales | –0.1 | –1.0 | +0.9 | 5.6 | 2(–) | 23.9 | 52.1 | 24.0 |
Employment | –2.0 | 1.5 | –3.5 | 1.7 | 1(–) | 8.2 | 81.6 | 10.2 |
Part–Time Employment | –2.2 | 1.7 | –3.9 | –2.1 | 1(–) | 3.7 | 90.4 | 5.9 |
Hours Worked | –10.3 | 1.7 | –12.0 | –2.1 | 1(–) | 4.7 | 80.3 | 15.0 |
Wages and Benefits | 7.1 | 5.3 | +1.8 | 9.0 | 7(+) | 17.0 | 73.1 | 9.9 |
Input Prices | 32.2 | 35.1 | –2.9 | 19.0 | 10(+) | 36.6 | 59.0 | 4.4 |
Selling Prices | 37.7 | 19.8 | +17.9 | 10.4 | 9(+) | 44.9 | 47.9 | 7.2 |
Capital Expenditures | 9.5 | –1.9 | +11.4 | 7.3 | 1(+) | 13.5 | 82.5 | 4.0 |
Inventories | 2.1 | –2.9 | +5.0 | 2.4 | 1(+) | 26.2 | 49.8 | 24.1 |
| Companywide Retail Activity | ||||||||
Companywide Sales | –3.5 | 8.1 | –11.6 | 6.9 | 1(–) | 23.9 | 48.7 | 27.4 |
Companywide Internet Sales | –3.9 | 1.8 | –5.7 | 6.0 | 1(–) | 17.8 | 60.5 | 21.7 |
| General Business Conditions, Retail Current (versus previous month) | ||||||||
| Indicator | Feb Index | Jan Index | Change | Series Average | Trend** | % Reporting Improved | % Reporting No Change | % Reporting Worsened |
Company Outlook | –6.8 | –1.9 | –4.9 | 3.2 | 3(–) | 8.4 | 76.4 | 15.2 |
General Business Activity | –3.5 | –0.4 | –3.1 | –1.0 | 4(–) | 14.6 | 67.3 | 18.1 |
| Outlook Uncertainty Current (versus previous month) | ||||||||
| Indicator | Feb Index | Jan Index | Change | Series Average | Trend* | % Reporting Increase | % Reporting No Change | % Reporting Decrease |
Outlook Uncertainty† | 4.3 | 3.9 | +0.4 | 9.8 | 2(+) | 12.8 | 78.7 | 8.5 |
| Business Indicators Relating to Facilities and Products in Texas, Retail Future (six months ahead) | ||||||||
| Indicator | Feb Index | Jan Index | Change | Series Average | Trend* | % Reporting Increase | % Reporting No Change | % Reporting Decrease |
| Retail Activity in Texas | ||||||||
Sales | 37.6 | 29.3 | +8.3 | 31.9 | 10(+) | 51.7 | 34.2 | 14.1 |
Employment | 16.5 | 15.2 | +1.3 | 11.9 | 10(+) | 24.5 | 67.5 | 8.0 |
Part–Time Employment | 8.9 | 11.1 | –2.2 | 0.7 | 7(+) | 16.8 | 75.3 | 7.9 |
Hours Worked | 0.5 | 1.1 | –0.6 | 2.6 | 10(+) | 10.0 | 80.5 | 9.5 |
Wages and Benefits | 35.6 | 37.8 | –2.2 | 27.1 | 10(+) | 40.4 | 54.8 | 4.8 |
Input Prices | 44.5 | 36.0 | +8.5 | 32.7 | 10(+) | 46.7 | 51.1 | 2.2 |
Selling Prices | 40.0 | 24.0 | +16.0 | 28.7 | 10(+) | 44.4 | 51.1 | 4.4 |
Capital Expenditures | 20.0 | 26.0 | –6.0 | 16.9 | 9(+) | 26.7 | 66.7 | 6.7 |
Inventories | 36.0 | 34.0 | +2.0 | 8.8 | 10(+) | 46.0 | 44.0 | 10.0 |
| Companywide Retail Activity | ||||||||
Companywide Sales | 34.4 | 31.3 | +3.1 | 30.4 | 10(+) | 49.9 | 34.7 | 15.5 |
Companywide Internet Sales | 33.3 | 39.5 | –6.2 | 21.9 | 11(+) | 44.4 | 44.4 | 11.1 |
| General Business Conditions, Retail Future (six months ahead) | ||||||||
| Indicator | Feb Index | Jan Index | Change | Series Average | Trend** | % Reporting Improved | % Reporting No Change | % Reporting Worsened |
Company Outlook | 38.7 | 25.2 | +13.5 | 16.9 | 10(+) | 49.0 | 40.7 | 10.3 |
General Business Activity | 30.6 | 20.8 | +9.8 | 12.7 | 7(+) | 41.2 | 48.3 | 10.6 |
*Shown is the number of consecutive months of expansion or contraction in the underlying indicator. Expansion is indicated by a positive index reading and denoted by a (+) in the table. Contraction is indicated by a negative index reading and denoted by a (–) in the table.
**Shown is the number of consecutive months of improvement or worsening in the underlying indicator. Improvement is indicated by a positive index reading and denoted by a (+) in the table. Worsening is indicated by a negative index reading and denoted by a (–) in the table.
†Added to survey in January 2018.
Data have been seasonally adjusted as necessary, with the exception of the outlook uncertainty index which does not yet have a sufficiently long time series to test for seasonality.
Texas Service Sector Outlook Survey
Texas Retail Outlook Survey
Texas Service Sector Outlook Survey
Comments from Survey Respondents
These comments are from respondents’ completed surveys and have been edited for publication.
- The anti-oil-and-gas sentiment in Washington is having an effect on our business and will definitely continue to negatively affect it.
- I do believe the economy is doing better.
- I am very surprised about the weakness of the grid and other infrastructure revealed by the current meteorological event. We will need to understand what will be done to address this for future significant and unusual events.
- The actions of the Biden administration are doing nothing but increasing our costs. The uncertainty of what they will do next makes it hard to plan.
- We are seeing severe impacts to energy production due to the winter storm.
- The significant weather events have significantly impacted our business over the short term.
- While we are expecting oil flowing out of the Permian to decrease as the year goes along, we have been expecting that for several months now and have yet to see it. We continue to monitor but are prepared to continue spending capital and maintenance dollars even during the dip that should reverse itself in 2022.
- COVID-19 continues to be a throttle on "time and difficulty to build new relations remotely" and "time to close business opportunities." The two factors are connected to some extent.
- There's a bit more activity with sales prospects this month. Hopefully, this will turn into actual purchases in the coming months. Competition for top talent continues to increase and is difficult to find, attract and retain.
- We are concerned over the direction the current administration is moving. There is an expectation of increased regulation and taxes. We anticipate overhead to increase, which may result in eliminating some employees and benefits. The second round of PPP [Paycheck Protection Program] has been utilized by more individuals and businesses, especially farmers and ranchers in our rural markets. The battle to stay current on cybersecurity continues to be a constant evolving challenge. Incidents of fraud continue to increase.
- Long-term rates in the commercial mortgage market have not increased materially over the last few months, notwithstanding the increasing yield for the 10-year Treasury, resulting in a borrower perception that it is a good time to borrow. Based on historical commercial mortgage activity five and 10 years ago, we anticipate an increase in refinancing due to maturity events relative to loans originated during the prior years mentioned.
- Unless we get past the COVID partial shutdowns soon, small businesses will continue to fail, leaving a long-term effect on local economies.
- Lack of consistent power is creating workflow issues for us this week.
- We are seeing significant wage pressure. Employees are being hunted by industry competitors and companies outside our industries. We are seeing anywhere from 5 to 25 percent increases being offered by other companies to lure our employees away. We have had to increase wages 5 to 15 percent to retain employees and be able to recruit new employees.
- I am hopeful with the vaccine rollout and indications of lower hospitalizations that some normalcy may occur by midyear.
- As more and more vaccines are given, there is a more positive feeling among my staff and employees.
- [There is] no way this administration and its socialist agenda is good for the business world—at least us small businesses.
- I do not expect any improvement in the energy sector project consulting business until 2022. Energy companies will be slow to move based on the improvement in oil and gas prices that we have recently seen. Wind and solar will also not increase until the oil and gas price economics make wind and solar more economical.
- February is generally a slow month for us in terms of revenue.
- The response to COVID is still with us. The slow rate of vaccinations has hurt us, and the transfer of power in the government has slowed all activity. Top that with the frigid temperatures, and nothing is happening.
- Now that the election is over and the number of COVID-19 cases is beginning to slow, we feel like the commercial real estate market should begin to recover in the second half of the year. The residential market remains strong, but if inventories continue to diminish, it could create issues for that market in the second half of the year. All in all, our outlook is positive for the next two years.
- Transactional lawyers started feeling more optimistic in the fourth quarter, and that is continuing. As restrictions on businesses and gatherings diminish, we will see more hours from litigators. Meanwhile, counter-cyclical practice areas remain strong.
- Activity in office and warehouse construction remains strong.
- With so much consolidation and continued restrictions in travel and getting back to the office, my clients have been halved (mainly through being acquired or business failure). My business does not have the ability to create demand in our industry for some time, and when the economy does rebound, there will be far fewer potential clients to compete for.
- Underlying economic and business conditions and trends appear to be improving. We seem to be gaining traction economically, and sentiment is positive.
- We suspect that government policy will directly affect the economy. We cannot afford a $15-per-hour minimum wage. We do not currently have any workers at minimum wage. We pay significantly higher than that. However, a $15 minimum wage will cause significant hardship for our company. Fuel prices are on the rise. This too is a hardship. COVID restrictions have caused hardships.
- Our number of airline tickets has increased (15 percent).
- Momentum for job growth and increased hiring seem to have stalled. Clients are slow to hire, taking longer to make decisions and lengthening time to pay invoices. [Employees for] Lower-level roles are being hired but not managerial and executive roles.
- The winter storm has curtailed our operations for more than four days, halting our production of finished goods, stopping pickups at our suppliers and keeping our employees at home. Broken water pipes in our plant also add to the lost revenue suffered and increased expense with repairing damages caused by the water and potential spoilage of our finished goods.
- I am very nervous about our expanding budget deficit. At some point, interest rates are going to start climbing, and that’s going to hurt. The proposed minimum wage increase also worries me because the potential exists to price lower-wage labor out of the market. You could also see a rise in price (inflation) to offset the wage increase. The net effect is we would still be in the same place.
- [We are] In business but staying at 15 to 20 percent below last year’s volume fairly consistently; hopefully, demand begins to ramp up the next two to three months, or we will have to trim payroll. We did not qualify for the second round of PPP unfortunately, which would have made a huge difference.
- The Dallas Fed has been our regional sage; GME [Gamestop], BTC [Bitcoin], Au [gold] and others they can gauge; COVID, climate change and ISIS; yet another unexpected crisis; hoping moving those levers, our pain will assuage!
- We have increased capital expenditures tied to facility renovations and moves of one-stop centers. Revenue in the form of state/federal funding has increased due to the COVID-19 focus on meeting demand for workforce development assistance. The Biden administration is also expected to have a stronger commitment toward labor market safety nets and skills development.
- We are starting to be able to hire a number of entry-level employees after six months of challenges. Further, traffic in our stores is close to last year’s levels.
- Our community has been able to obtain shots and has set the example of how to do it. Even with this, people are still wearing masks and all the news [tells us] to wait as no one knows when the government guidelines will be lifted. There is too much uncertainty.
- We are a hotel. As we look forward, the third quarter gives us reason for optimism in that we have significant group business on our books. The question is if it will "stick" or will groups cancel as we get closer to the dates of the meeting. Only time (and the inoculation process) will tell us.
- The February and March booking pace is showing signs of slow improvement. Business continues to be primarily on weekends and made up of leisure travelers. Groups continue to cancel events due to COVID fears and travel restrictions.
- Staffing remains to be our No. 1 concern. We cannot hire/train enough qualified candidates to appropriately run our stores.
- We are still waiting the authorization to reopen my push carts to sell hot dogs at some of [our corporate partners] who still do not allow us to operate.
- Our community’s reaction to the impact of COVID-19 has lagged behind other, larger communities. 2020 allowed us to hold steady. It is catching up to us in 2021.
- The increase in oil prices is improving the outlook of oil and gas manufacturers in North Texas.
- Being in construction, when a president immediately shuts down jobs and places stronger restrictions on travel, it's going to hurt my business. COVID-19 was bad for many businesses, but the Biden effect is worse for us.
- We see runaway price increases in all commodities. Farmers will benefit from increase in cotton, corn and soybeans. Ranchers will be pinched by large increases in feed cost. Inputs to farmers, i.e., fertilizer, are also having large price jumps. All capital construction projects are rebidding due to large price increases in lumber and steel. Price increases are happening so fast I cannot raise retail prices fast enough to keep up. Margins are suffering.
- We will lose a week of sales to the winter storm in Texas, which will be costly.
- We export to Latin American restaurants, so we took a significant hit when Peru closed their restaurants in late January because of a COVID surge. We aren't seeing COVID shutdowns in other markets, so that volume remains steady. We expect conditions to improve over time, and guests will return to dining in.
- New-vehicle inventories remain low due to supplier issues with the manufacturers.
- General business conditions concerns [are driven by] COVID-19 and weather, combined with below-average inventory levels and parts delays.
- The sale of the company will be completed in early second quarter.
- Business in the building materials product lines is booming. Growth is limited at this time due to limited supply. Prices and demand are strong.
- If the $15 per hour minimum wage passes, we will raise all our retail pricing.
- Although we are excited to have added new business in the past 45 days, we are still seeing somewhat slower sales in existing customers. We still anticipate some improvements in existing business during February as consumer confidence may increase as a result of the vaccine rollout, but we must act as if improvements won't come in order to maintain a lower operating cost if there are further downturns.
Historical Data
Historical data can be downloaded dating back to January 2007.
Indexes
Download indexes for all indicators. For the definitions of all variables, see Data Definitions.
Texas Service Sector Outlook Survey |
Texas Retail Outlook Survey |
| Unadjusted | Unadjusted |
| Seasonally adjusted | Seasonally adjusted |
All Data
Download indexes and components of the indexes (percentage of respondents reporting increase, decrease, or no change). For the definitions of all variables, see Data Definitions.
Texas Service Sector Outlook Survey |
Texas Retail Outlook Survey |
| Unadjusted | Unadjusted |
| Seasonally adjusted | Seasonally adjusted |
Questions regarding the Texas Service Sector Outlook Survey can be addressed to Christopher Slijk at christopher.slijk@dal.frb.org.
Sign up for our email alert to be automatically notified as soon as the latest Texas Service Sector Outlook Survey is released on the web.