Texas Service Sector Expansion Moderates in August

Texas Service Sector Outlook Survey
Texas Service Sector Expansion Moderates in August
For this month’s survey, Texas business executives were asked supplemental questions on the labor market, revenue restraints, and the resurgence of the pandemic. Results for these questions from the Texas Manufacturing Outlook Survey, Texas Service Sector Outlook Survey and Texas Retail Outlook Survey have been released together. Read the special questions results.
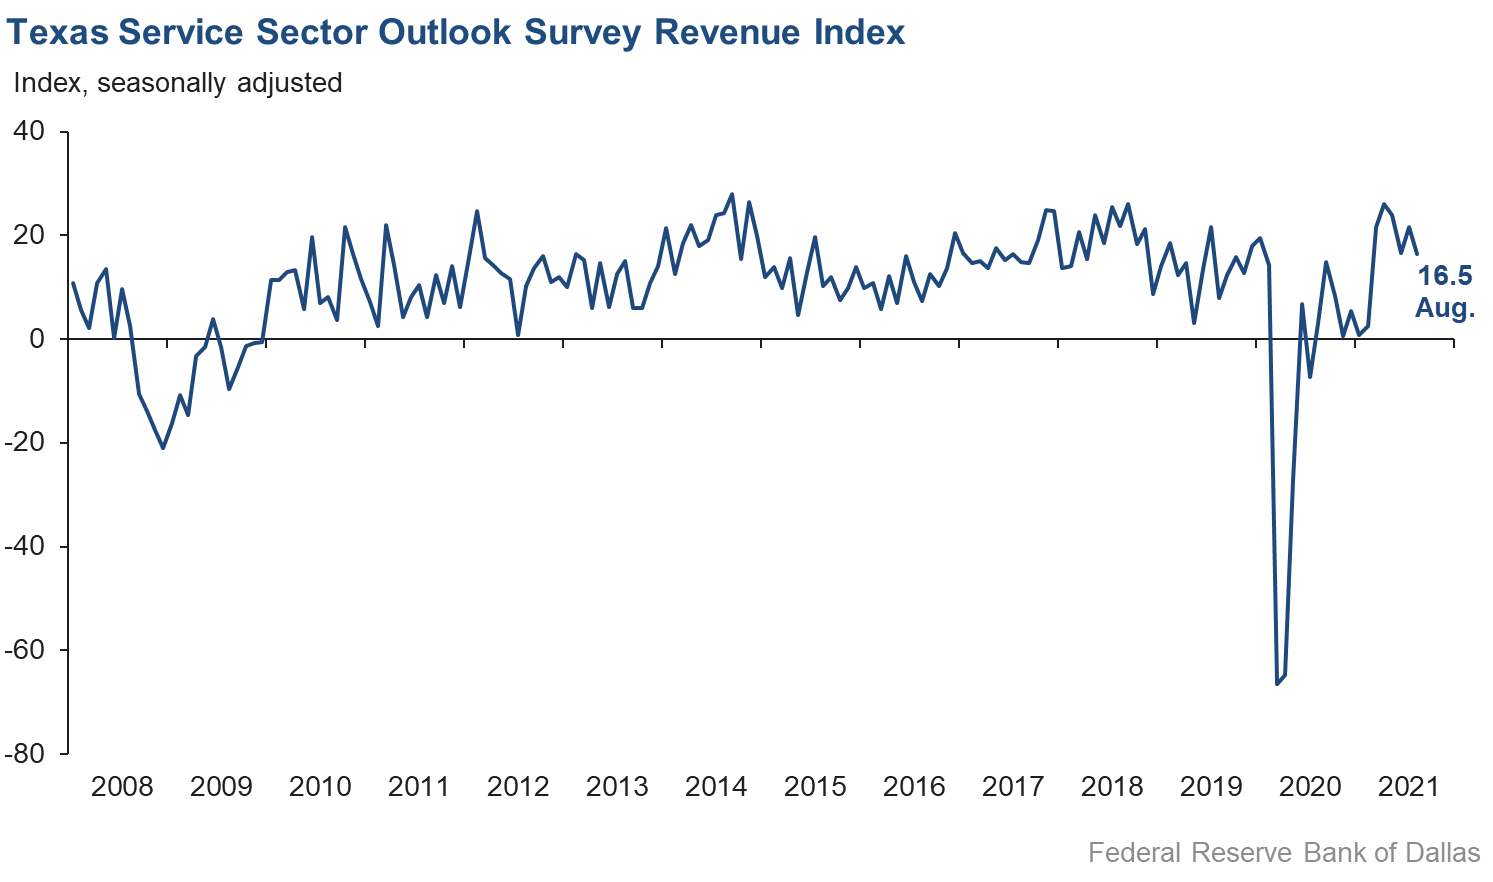
The pace of growth in the Texas service sector slowed in August, according to business executives responding to the Texas Service Sector Outlook Survey. The revenue index, a key measure of state service sector conditions, fell from 21.7 in July to 16.5 in August.
Despite broad-based hiring difficulties, labor market indicators improved in August, with an acceleration in hiring and lengthening of hours worked. The employment index rose from 13.5 to 17.6, its best reading since 2007, with nearly a quarter of respondents noting increased employment this month. The hours worked index increased to a three-month high of 11.5.
Perceptions of broader business conditions were sharply less optimistic than in July. The general business activity index plunged nearly 28 points to 5.4, its weakest reading since February. The company outlook index fell nearly 20 points to 5.1, while the outlook uncertainty index surged from 6.6 to 20.4—its highest level since July 2020.
Price pressures remained highly elevated in August, while wage pressures surged. The wages and benefits index increased from 27.2 to a record high of 32.6. The selling prices index declined from 24.4 to 20.8, while the input prices index was unchanged at 41.9.
Respondents’ expectations regarding future business activity moderated in August, with optimism continuing to wane. The future general business activity index fell from 37.5 to 23.0, while the future revenue index fell over seven points to 44.7. Other future service sector activity indexes such as employment and capital expenditures also pulled back, though they remain suggestive of continued growth going into 2022.

Texas Retail Outlook Survey
Texas Retail Sales Grow at Fastest Pace Since April
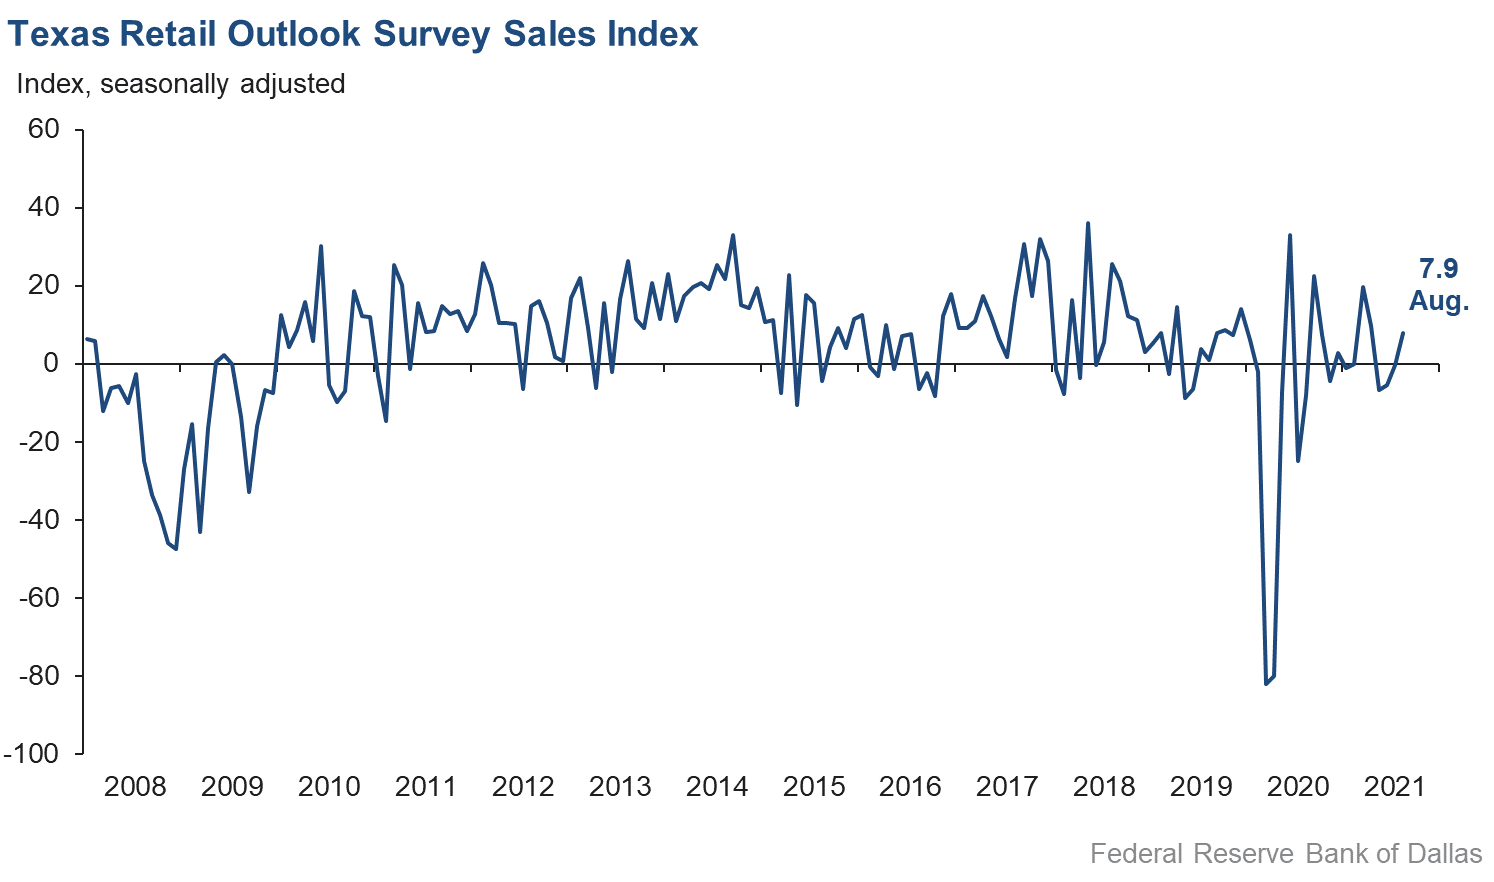
Retail sales activity expanded in August after several months of weakness, according to business executives responding to the Texas Retail Outlook Survey. The sales index, a key measure of state retail activity, improved from -0.2 in July to 7.9 in August. Inventories saw continued drawdowns, with the inventories index unchanged at -6.4.
Retail labor market indicators improved modestly in August, with employment increasing and average employee hours worked lengthening. The employment index rebounded to positive territory, rising from -0.7 to 2.4, while the hours worked index improved from -2.6 to 4.6.
Retailers’ perceptions of broader business conditions were much more mixed this month compared with July. The general business activity index weakened over seven points to 8.5, while the company outlook index plunged into negative territory at -1.7. The outlook uncertainty index inched up slightly to 16.7, its highest level since November.
Retail price pressures continued to ease in August, while wage pressures increased notably. The selling prices index declined from 42.9 to 39.7, while the input prices index shed over 10 points to 41.3. The wages and benefits index increased from 15.8 to 24.2, its highest reading since the beginning of the pandemic.
Despite recent concerns surrounding the resurgence in COVID-19 cases, retailers remained mostly optimistic regarding expected business conditions going into 2022. The future general business activity index dipped slightly from 24.1 to 22.0, while the future sales index fell more substantially, declining from 58.9 to 45.9—though holding above its 12-month average. Other indexes of future retail activity such as employment weakened but point to continued growth through the rest of this year.
The Texas Retail Outlook Survey is a component of the Texas Service Sector Outlook Survey that uses information only from respondents in the retail and wholesale sectors.
Next release: September 28, 2021
Data were collected August 17-25, and 279 Texas service sector business executives, of which 44 were retailers, responded to the survey. The Dallas Fed conducts the Texas Service Sector Outlook Survey monthly to obtain a timely assessment of the state’s service sector activity. Firms are asked whether revenue, employment, prices, general business activity and other indicators increased, decreased or remained unchanged over the previous month.
Survey responses are used to calculate an index for each indicator. Each index is calculated by subtracting the percentage of respondents reporting a decrease from the percentage reporting an increase. When the share of firms reporting an increase exceeds the share reporting a decrease, the index will be greater than zero, suggesting the indicator has increased over the prior month. If the share of firms reporting a decrease exceeds the share reporting an increase, the index will be below zero, suggesting the indicator has decreased over the prior month. An index will be zero when the number of firms reporting an increase is equal to the number of firms reporting a decrease. Data have been seasonally adjusted as necessary.
Texas Service Sector Outlook Survey
Historical data are available from January 2007 to the most current release month.
| Business Indicators Relating to Facilities and Products in Texas Current (versus previous month) | ||||||||
| Indicator | Aug Index | Jul Index | Change | Series Average | Trend* | % Reporting Increase | % Reporting No Change | % Reporting Decrease |
Revenue | 16.5 | 21.7 | –5.2 | 11.0 | 13(+) | 36.5 | 43.6 | 20.0 |
Employment | 17.6 | 13.5 | +4.1 | 6.2 | 13(+) | 23.7 | 70.3 | 6.1 |
Part–Time Employment | 6.1 | 8.3 | –2.2 | 1.3 | 9(+) | 10.3 | 85.5 | 4.2 |
Hours Worked | 11.5 | 8.5 | +3.0 | 2.5 | 12(+) | 16.4 | 78.7 | 4.9 |
Wages and Benefits | 32.6 | 27.2 | +5.4 | 14.3 | 15(+) | 35.2 | 62.2 | 2.6 |
Input Prices | 41.9 | 42.0 | –0.1 | 25.3 | 16(+) | 44.1 | 53.7 | 2.2 |
Selling Prices | 20.8 | 24.4 | –3.6 | 5.6 | 13(+) | 25.9 | 69.0 | 5.1 |
Capital Expenditures | 16.1 | 20.7 | –4.6 | 9.7 | 12(+) | 22.1 | 71.9 | 6.0 |
| General Business Conditions Current (versus previous month) | ||||||||
| Indicator | Aug Index | Jul Index | Change | Series Average | Trend** | % Reporting Improved | % Reporting No Change | % Reporting Worsened |
Company Outlook | 5.1 | 25.0 | –19.9 | 5.4 | 13(+) | 21.6 | 61.9 | 16.5 |
General Business Activity | 5.4 | 33.3 | –27.9 | 3.6 | 7(+) | 24.3 | 56.8 | 18.9 |
| Indicator | Aug Index | Jul Index | Change | Series Average | Trend* | % Reporting Increase | % Reporting No Change | % Reporting Decrease |
Outlook Uncertainty† | 20.4 | 6.6 | +13.8 | 10.8 | 3(+) | 31.5 | 57.5 | 11.1 |
| Business Indicators Relating to Facilities and Products in Texas Future (six months ahead) | ||||||||
| Indicator | Aug Index | Jul Index | Change | Series Average | Trend* | % Reporting Increase | % Reporting No Change | % Reporting Decrease |
Revenue | 44.7 | 52.1 | –7.4 | 37.3 | 16(+) | 55.3 | 34.1 | 10.6 |
Employment | 36.9 | 41.9 | –5.0 | 22.2 | 16(+) | 42.3 | 52.3 | 5.4 |
Part–Time Employment | 13.7 | 16.7 | –3.0 | 6.6 | 15(+) | 19.3 | 75.1 | 5.6 |
Hours Worked | 14.1 | 14.9 | –0.8 | 5.8 | 16(+) | 18.6 | 76.9 | 4.5 |
Wages and Benefits | 48.7 | 52.7 | –4.0 | 36.0 | 16(+) | 50.3 | 48.1 | 1.6 |
Input Prices | 47.8 | 51.6 | –3.8 | 43.4 | 176(+) | 50.7 | 46.5 | 2.9 |
Selling Prices | 33.0 | 37.4 | –4.4 | 23.1 | 16(+) | 37.5 | 58.0 | 4.5 |
Capital Expenditures | 27.6 | 32.0 | –4.4 | 23.2 | 15(+) | 33.0 | 61.6 | 5.4 |
| General Business Conditions Future (six months ahead) | ||||||||
| Indicator | Aug Index | Jul Index | Change | Series Average | Trend** | % Reporting Improved | % Reporting No Change | % Reporting Worsened |
Company Outlook | 20.8 | 31.3 | –10.5 | 16.8 | 13(+) | 32.1 | 56.6 | 11.3 |
General Business Activity | 23.0 | 37.5 | –14.5 | 13.9 | 13(+) | 35.3 | 52.4 | 12.3 |
Historical data are available from January 2007 to the most current release month.
| Business Indicators Relating to Facilities and Products in Texas Retail (versus previous month) | ||||||||
| Indicator | Aug Index | Jul Index | Change | Series Average | Trend* | % Reporting Increase | % Reporting No Change | % Reporting Decrease |
| Retail Activity in Texas | ||||||||
Sales | 7.9 | –0.2 | +8.1 | 5.5 | 1(+) | 29.3 | 49.4 | 21.4 |
Employment | 2.4 | –0.7 | +3.1 | 1.8 | 1(+) | 12.5 | 77.4 | 10.1 |
Part–Time Employment | 3.5 | 8.0 | –4.5 | –1.9 | 6(+) | 9.7 | 84.1 | 6.2 |
Hours Worked | 4.6 | –2.6 | +7.2 | –2.0 | 1(+) | 10.4 | 83.8 | 5.8 |
Wages and Benefits | 24.2 | 15.8 | +8.4 | 9.4 | 13(+) | 29.6 | 65.0 | 5.4 |
Input Prices | 41.3 | 51.8 | –10.5 | 20.0 | 16(+) | 46.6 | 48.1 | 5.3 |
Selling Prices | 39.7 | 42.9 | –3.2 | 11.5 | 15(+) | 49.4 | 40.9 | 9.7 |
Capital Expenditures | 12.6 | 23.8 | –11.2 | 7.7 | 7(+) | 17.9 | 76.8 | 5.3 |
Inventories | –6.4 | –6.4 | 0.0 | 2.0 | 6(–) | 21.2 | 51.2 | 27.6 |
| Companywide Retail Activity | ||||||||
Companywide Sales | 16.9 | 5.1 | +11.8 | 7.0 | 6(+) | 36.0 | 44.9 | 19.1 |
Companywide Internet Sales | 7.1 | 1.4 | +5.7 | 5.9 | 2(+) | 21.9 | 63.3 | 14.8 |
| General Business Conditions, Retail Current (versus previous month) | ||||||||
| Indicator | Aug Index | Jul Index | Change | Series Average | Trend** | % Reporting Improved | % Reporting No Change | % Reporting Worsened |
Company Outlook | –1.7 | 11.8 | –13.5 | 3.6 | 1(–) | 12.0 | 74.3 | 13.7 |
General Business Activity | 8.5 | 15.8 | –7.3 | –0.1 | 6(+) | 23.7 | 61.1 | 15.2 |
| Outlook Uncertainty Current (versus previous month) | ||||||||
| Indicator | Aug Index | Jul Index | Change | Series Average | Trend* | % Reporting Increase | % Reporting No Change | % Reporting Decrease |
Outlook Uncertainty† | 16.7 | 14.9 | +1.8 | 8.8 | 3(+) | 26.2 | 64.3 | 9.5 |
| Business Indicators Relating to Facilities and Products in Texas, Retail Future (six months ahead) | ||||||||
| Indicator | Aug Index | Jul Index | Change | Series Average | Trend* | % Reporting Increase | % Reporting No Change | % Reporting Decrease |
| Retail Activity in Texas | ||||||||
Sales | 45.9 | 58.9 | –13.0 | 32.6 | 16(+) | 53.9 | 38.1 | 8.0 |
Employment | 33.2 | 42.0 | –8.8 | 12.7 | 16(+) | 39.9 | 53.4 | 6.7 |
Part–Time Employment | 25.5 | 15.3 | +10.2 | 1.3 | 13(+) | 27.0 | 71.5 | 1.5 |
Hours Worked | 18.7 | 15.1 | +3.6 | 2.9 | 16(+) | 23.5 | 71.7 | 4.8 |
Wages and Benefits | 52.1 | 54.9 | –2.8 | 27.8 | 16(+) | 52.4 | 47.3 | 0.3 |
Input Prices | 45.5 | 59.1 | –13.6 | 33.3 | 16(+) | 52.3 | 40.9 | 6.8 |
Selling Prices | 39.5 | 48.8 | –9.3 | 29.3 | 16(+) | 48.8 | 41.9 | 9.3 |
Capital Expenditures | 25.5 | 29.6 | –4.1 | 17.5 | 15(+) | 30.2 | 65.1 | 4.7 |
Inventories | 22.7 | 39.4 | –16.7 | 9.8 | 16(+) | 37.1 | 48.5 | 14.4 |
| Companywide Retail Activity | ||||||||
Companywide Sales | 53.3 | 55.8 | –2.5 | 31.1 | 16(+) | 58.2 | 36.9 | 4.9 |
Companywide Internet Sales | 44.8 | 43.8 | +1.0 | 22.6 | 17(+) | 47.4 | 50.0 | 2.6 |
| General Business Conditions, Retail Future (six months ahead) | ||||||||
| Indicator | Aug Index | Jul Index | Change | Series Average | Trend** | % Reporting Improved | % Reporting No Change | % Reporting Worsened |
Company Outlook | 36.8 | 35.4 | +1.4 | 17.6 | 16(+) | 40.5 | 55.8 | 3.7 |
General Business Activity | 22.0 | 24.1 | –2.1 | 13.4 | 13(+) | 37.1 | 47.7 | 15.1 |
*Shown is the number of consecutive months of expansion or contraction in the underlying indicator. Expansion is indicated by a positive index reading and denoted by a (+) in the table. Contraction is indicated by a negative index reading and denoted by a (–) in the table.
**Shown is the number of consecutive months of improvement or worsening in the underlying indicator. Improvement is indicated by a positive index reading and denoted by a (+) in the table. Worsening is indicated by a negative index reading and denoted by a (–) in the table.
†Added to survey in January 2018.
Data have been seasonally adjusted as necessary, with the exception of the outlook uncertainty index which does not yet have a sufficiently long time series to test for seasonality.
Texas Service Sector Outlook Survey
Texas Retail Outlook Survey
Texas Service Sector Outlook Survey
Comments from Survey Respondents
These comments are from respondents’ completed surveys and have been edited for publication.
- The [COVID-19] Delta variant and the continued shutdowns of company facilities have increased the uncertainty of business.
- [We have] some concern about the Delta virus.
- The Delta COVID-19 variant adds a level of uncertainty on the impact on our customers' business, primarily emergency medical services and tourism. The low level of vaccinations also is most likely the cause of increased community and family transmissions [among] employees.
- Inflation, COVID starting again, the Afghanistan debacle, our southern border being overrun and parts for our business being constantly on backorder due to the COVID shutdowns; all this doesn't make for a very bright future.
- Key is COVID’s impact on global demand for crude oil.
- We have finally been able to fully staff our teams, although we are still in the training phase with one-fourth of our staff.
- Cotton season has started, and the harvest looks good.
- We believe we're overall in a period of relative stability, though we are seeing a short-term decline in crude oil exports due to financial conditions within that market. Prices remain higher than a year ago for our inputs, such as construction materials, and we expect those to remain high for the upcoming six months, though we do believe them ultimately transitory..
- It seems some government/industry budgets are currently more uncertain, which delays placing orders. Things also move slower when face-to-face meetings are less likely due to COVID Delta and other related issues for product/service demand. Hopefully, this will be a short-term issue.
- The COVID Delta variant, of course [is a concern].
- Costs for salaries, benefits and third-party services continue to increase at a double-digit pace (on an annual basis). The cost of technical talent is the key driver. We're trying to absorb these costs where possible, but pricing to our clients will need to increase soon, which could, in turn, negatively impact our prospects' purchasing decisions for our services.
- Most banks are seeing the last of their PPP [Paycheck Protection Program] loan fees going to revenue and [things] getting back to normal in the finance industry. What is not normal is the second threat of a COVID pandemic. Initially, the biggest concern is keeping staff healthy and working around the mandate dilemmas of masks and vaccinations. The economic outlook will now depend on the outcome of the second coming of COVID.
- [There is] increased uncertainty primarily related to COVID hospital increases and overall concerns regarding continued spread.
- [We are experiencing a] lack of access to candidates.
- Labor market turmoil has decreased activity in the oil and gas industry. COVID-19 has created tough times.
- The rise of the Delta variant has definitely dampened activity. We expect August and possibly September activity to be down 25–50 percent.
- Labor costs are rising in all sectors. Supply-chain issues are still slowing our economy.
- COVID is making people nervous to start new projects, go out to eat and putting schools on edge. I see Gov. [Greg] Abbott tested positive today, so his philosophy of no mandates is not helping curtail this virus. Here we go again.
- Lumber prices dropping has helped a great deal. [Some sellers] stopping sales to multifamily has hurt.
- The current change in our company's outlook is a little undecided until we have a better understanding of the Delta variant and how it may affect the economy. People are nervous again about COVID.
- Wage pressure is driving costs to provide services up. Vendor and manufacturer supply lines, along with inflation, are driving selling prices up. We cannot increase capital expenditures because we can’t get anything from our manufacturers to sell.
- We’ve had to step on the brakes on steady growth projection due to the spike in the Delta variant. We are experiencing absenteeism and/or having to revert back to the work-from-home scenario due to positive exposure, quarantine and closing of daycare centers and schools.
- The Delta variant and conflicting governmental entities' directives are adding confusion.
- With the spike in the Delta variant, we have seen a couple of cases postponed due to COVID. Earlier in the year, that was not the case, and courts anticipated a general increase in trials. As case numbers rise and school starts, we are seeing traces of hesitancy. If they continue, we expect additional trials to postpone again. Trials are the bulk of our billable fees.
- Even with the surge of the Delta variant, our business has continued to improve. I don't know if I have ever seen a more aggressive real estate market than we are witnessing now. We will see how or if this new surge will affect this market over the next couple of months.
- We are interviewing candidates for mid-level and advanced administrative positions. Most applicants are already gainfully employed and are trying to upgrade their wages. Their current wages and expectations are on average 20 percent higher than pre-COVID wages.
- COVID, the Delta variant, has once again disrupted the business climate. Also, the global semiconductor crisis has had a serious impact on our volumes.
- The resurgence of the COVID-19 virus creates increased uncertainty again.
- We are still experiencing supply-chain issues and have the largest backlog ever in our history of goods, which have been ordered by customers but which are now taking between 30 to 120 days to deliver when we used to deliver most goods in one to two weeks.
- COVID-19 continues to affect business production with unvaccinated employees being out because of illness or exposure (mostly lower-level employees).
- We continue to remain busy and grow. Our seasonal slower period is about to come into play, but we haven't seen it yet—maybe another two weeks.
- The COVID masking/restriction confusion between the federal, state and local government and school districts is causing a lot of confusion about what is coming next. Our customers are concerned with the next "shoe" to fall before investing in major outlays of materials for machining operations. Our aviation customers' commercial side is flying but with reduced inspection intervals. Our aviation customers—corporate flight departments—are not wanting to invest, trade up or down for aircraft. So the mentality of just holding onto what we got now appears to be the status quo at this time. Oil and heavy industry are slow, and we do not see an increase for them until late this year at the soonest. Military activities are up; because of utilization rates, we do not see this remaining past the end of September.
- Despite COVID-19 variants, business activity remains strong and is improving. We have no clients that are reflecting a downturn in activity but see more staffing issues and product shortages.
- The Delta surge has put the brakes on luxury travel with the return of additional restrictions.
- Skyrocketing Delta variant impact, lax vaccination rates, politics taking priority over welfare—all are impacting travel, business, meetings and events.
- We are experiencing cost-push inflation, and my concern is that it's not transitory. I am afraid we are going to experience inflationary pressure in future years that the Fed won't be able to combat with the tools at its disposal.
- We have raised wages 45 percent in six months and can't get enough workers. We are falling behind on production and are looking to more automation to make up the difference. We went from $8.50 to $10.50 to $12.50 per hour and really need to go to $14.50 but will lose money doing the work. We are 100–115 workers short in Lamar County, Texas, and are rethinking our business strategy given our situation. Free money from the U.S. government has hurt the work ethic and caused real inflation.
- The uncertainty around COVID-19 variants and vaccine hesitancy remains, but we are hopeful that a current increase in vaccination interest will persist and base our forecasts on that assumption.
- We are seeing a prolonged decrease in volume since June of about 10–15 percent. This is likely related to the COVID-19 surge in combination with summer slowdown.
- The new COVID surge is driving high volumes and exorbitant marginal cost. There's no question that revenues are rising, but uncontrollable labor and supply costs may outstrip them.
- Labor shortages continue, even with increasing wages. The costs of all goods and services are increasing, and supply chains are fractured.
- Immediate-term revenues are being impacted by the Delta variant.
- The surge in Delta-variant cases is causing cancellations to group travel and delays in companies restarting business travel. The duration of the current wave is an unknown that is impacting our bookings into October.
- With the Delta variant, our business seems to have slowed considerably (more than I would have anticipated). Is this a blip or the beginning of another round of group cancellations? I believe the Labor Day weekend will be incredibly telling.
- August is Houston Restaurant Weeks, which brings in a lot of business. When September comes, things will drop. We can’t hire employees. No one came back to offices when the Delta variant kicked up. Kids going back to school was supposed to be the catalyst to get everyone back to offices. It wasn’t.
- The Delta surge has stopped return to office and business travel, which are vital to our business. Until that changes, prospects remain diminished. Hiring employees remains very difficult and limits the amount of business we are able to accommodate.
- Things have improved from hiring better candidates and an upswing in revenue. The fear at the doorstep of what will happen in this next wave of COVID is lingering. The mask mandate returned last week, and we felt the change in sales. Though we are not where we were two years ago, we are getting closer to those numbers. E-commerce is a big part of our revenue stream, and I don't anticipate that changing ever in the future.
- Cancellations are increasing. We are experiencing supply-chain disruptions and a lack of skilled employees looking for work.
- The supply chain is still a major concern, along with costs associated with commodities.
- Finding people that want to work has me worried.
- The Delta variant has thrown off our recovery.
- Employing the right people has never been harder. Recruiting is an incredible challenge.
- Inflation is crazy right now. Just by producing more fuel, it would create thousands of jobs, lower gas prices and create more opportunity. It's crazy how a pandemic and terrible policies combined will wipe out a generation of business owners.
- We had increased sales, but the city recently instituted another mask mandate. This has led to uncertainty of the effect on decreased sales.
- The COVID Delta variant is starting to be concerning.
- Disruptions with the supply chain have greatly impacted sales in a negative way. Our business suffers from a dramatic shortage of inventory, therefore reducing vehicle sales. Replacement parts needed for repairs continue to be unavailable because of supply-chain issues as well.
- Inventories remain in short supply.
- Too many issues are beyond our control. [They are] very concerning. Please don't increase prime interest rates in the near future. Economy is fragile. Supply chain is inconsistent. You can't hire people. COVID and virus issues are serious. What is the long-term impact?
- The chip shortage continues to greatly impact our inventory levels. Selling prices and margins are at record highs due to low supply and high demand.
- We are needing to hire sales consultants, lube techs and technicians.
- Supply-chain issues are having a negative impact on our business.
Historical Data
Historical data can be downloaded dating back to January 2007.
Indexes
Download indexes for all indicators. For the definitions of all variables, see Data Definitions.
Texas Service Sector Outlook Survey |
Texas Retail Outlook Survey |
| Unadjusted | Unadjusted |
| Seasonally adjusted | Seasonally adjusted |
All Data
Download indexes and components of the indexes (percentage of respondents reporting increase, decrease, or no change). For the definitions of all variables, see Data Definitions.
Texas Service Sector Outlook Survey |
Texas Retail Outlook Survey |
| Unadjusted | Unadjusted |
| Seasonally adjusted | Seasonally adjusted |
Questions regarding the Texas Service Sector Outlook Survey can be addressed to Emily Kerr at emily.kerr@dal.frb.org.
Sign up for our email alert to be automatically notified as soon as the latest Texas Service Sector Outlook Survey is released on the web.