Employment by Federal Reserve District
June 2026
The Federal Reserve Bank of Dallas produces estimates of monthly payroll employment by Federal Reserve District. These data are now available to the public and will be updated monthly.
The 50 states and the District of Columbia are divided among 12 Federal Reserve districts. With the exception of the Twelfth District, headquartered in San Francisco, each Federal Reserve District contains portions of some states. The Dallas Fed, or Eleventh District, comprises all of Texas, southern New Mexico and northern Louisiana. Although the Bureau of Labor Statistics produces monthly payroll employment data for states, it is not possible to construct Federal Reserve District payroll employment from state-level data alone. The Dallas Fed has developed a method of estimating payroll employment by Federal Reserve District.
To construct Federal Reserve District employment, jobs in D.C. and the 36 states that fall entirely in one Federal Reserve District are assigned to the appropriate district. Employment in each of the 14 states that fall in more than one Federal Reserve District is divided up using weights generated from monthly county employment data from the Current Employment and Wages program (CEW). For example, in December 2010, 19.7 percent of Louisiana’s employment was in the Eleventh Federal Reserve District and 80.3 percent was in the Sixth District [1].
Table 1 shows the estimated level of employment by Federal Reserve District as of June 2026, and Chart 1 shows the same information as shares of total U.S. employment.
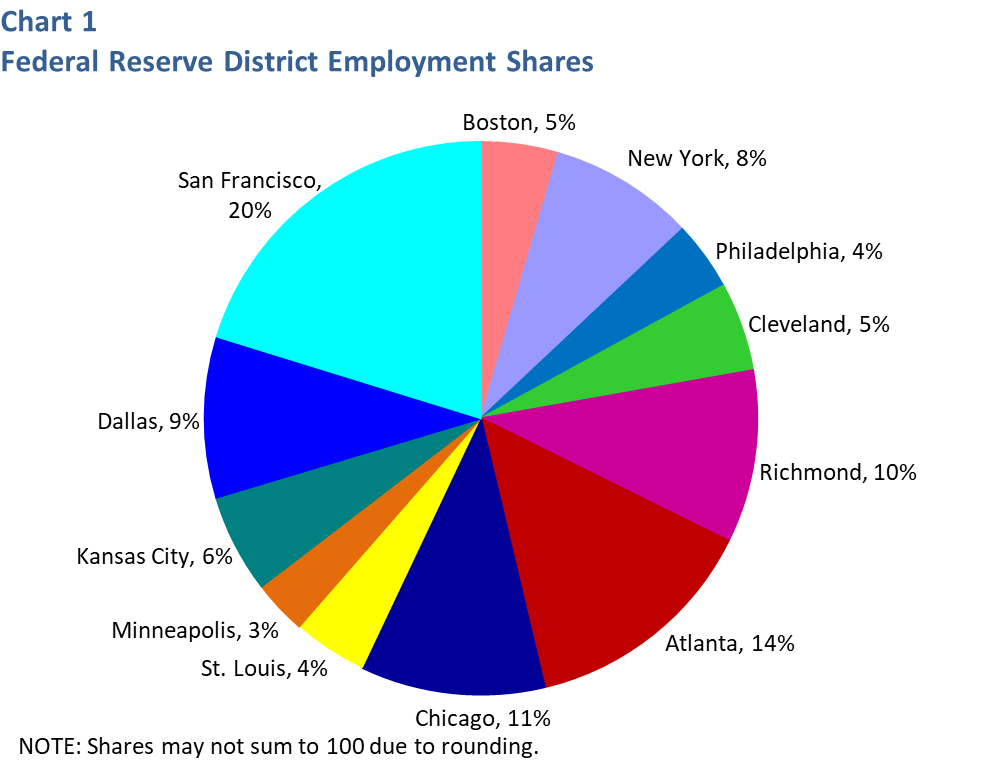
| Table 1: Payroll Employment by Federal Reserve District June 2026 | ||
| District | Employment (thousands) | 1 Boston | 7,185.1 |
| 2 New York | 13,504.3 | |
| 3 Philadelphia | 6,407.6 | |
| 4 Cleveland | 8,206.4 | |
| 5 Richmond | 15,947.3 | |
| 6 Atlanta | 22,180.4 | |
| 7 Chicago | 17,011.5 | |
| 8 St. Louis | 6,896.1 | |
| 9 Minneapolis | 5,037.4 | |
| 10 Kansas City | 9,144.8 | |
| 11 Dallas | 15,108.2 | |
| 12 San Francisco | 32,307.9 | |
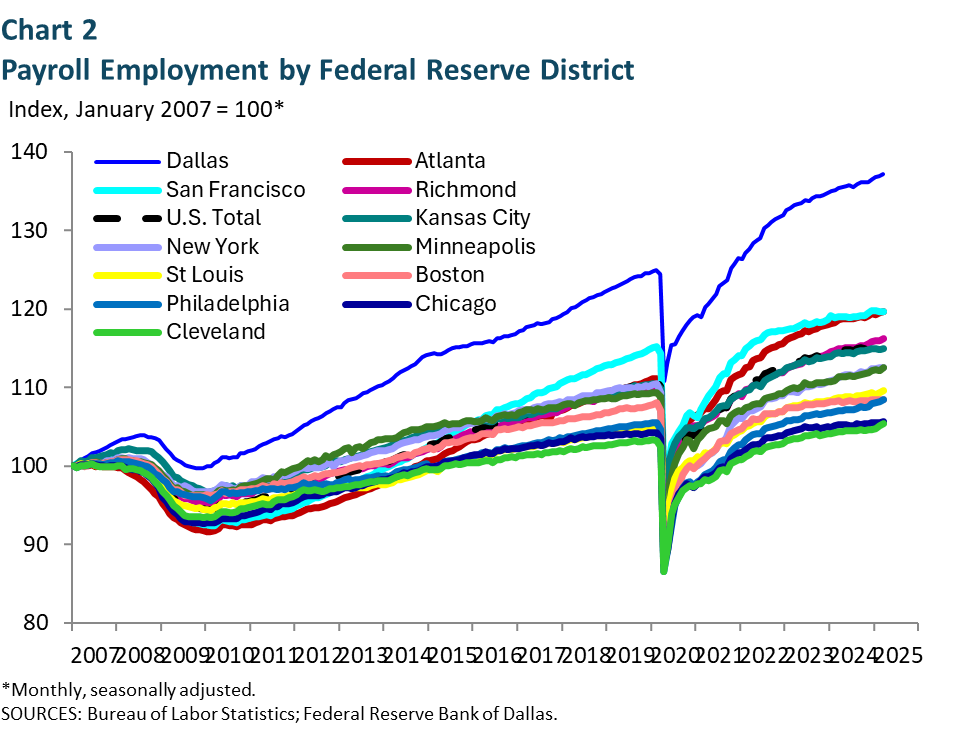
Chart 2 shows payroll employment for the U.S. and each Federal Reserve District, indexed to 100 in January 2007. Chart 2 shows payroll employment for the U.S. and each Federal Reserve District, indexed to 100 in January 2007. The employment downturn that began in early 2020 is readily apparent, as is the COVID recovery that followed. Although all Federal Reserve districts reflect the recession and following recovery, the progression of that recovery varies across the 12 districts.
Note
- County employment data from the Covered Employment and Wages program lag the state payroll data by several months. In months when the county employment data have not yet been released, we use the most recent weights available.