
Breakeven oil prices underscore shale’s impact on the market
The oil price that companies need to profitably drill new wells has closely tracked prices for long-dated oil futures in recent years. The emergence of U.S. shale production seems to be playing a large role in anchoring long-term oil prices.
The breakeven price—the price of oil needed to profitably drill a new well—is of great interest because it provides information on how activity in the oil sector might adjust if oil prices move dramatically. Its relevance has only grown over the past decade with the emergence of shale oil in the United States. Shale has a shorter lead time between drilling and production relative to offshore exploration and other traditional oil projects, making it more responsive to oil price movements.
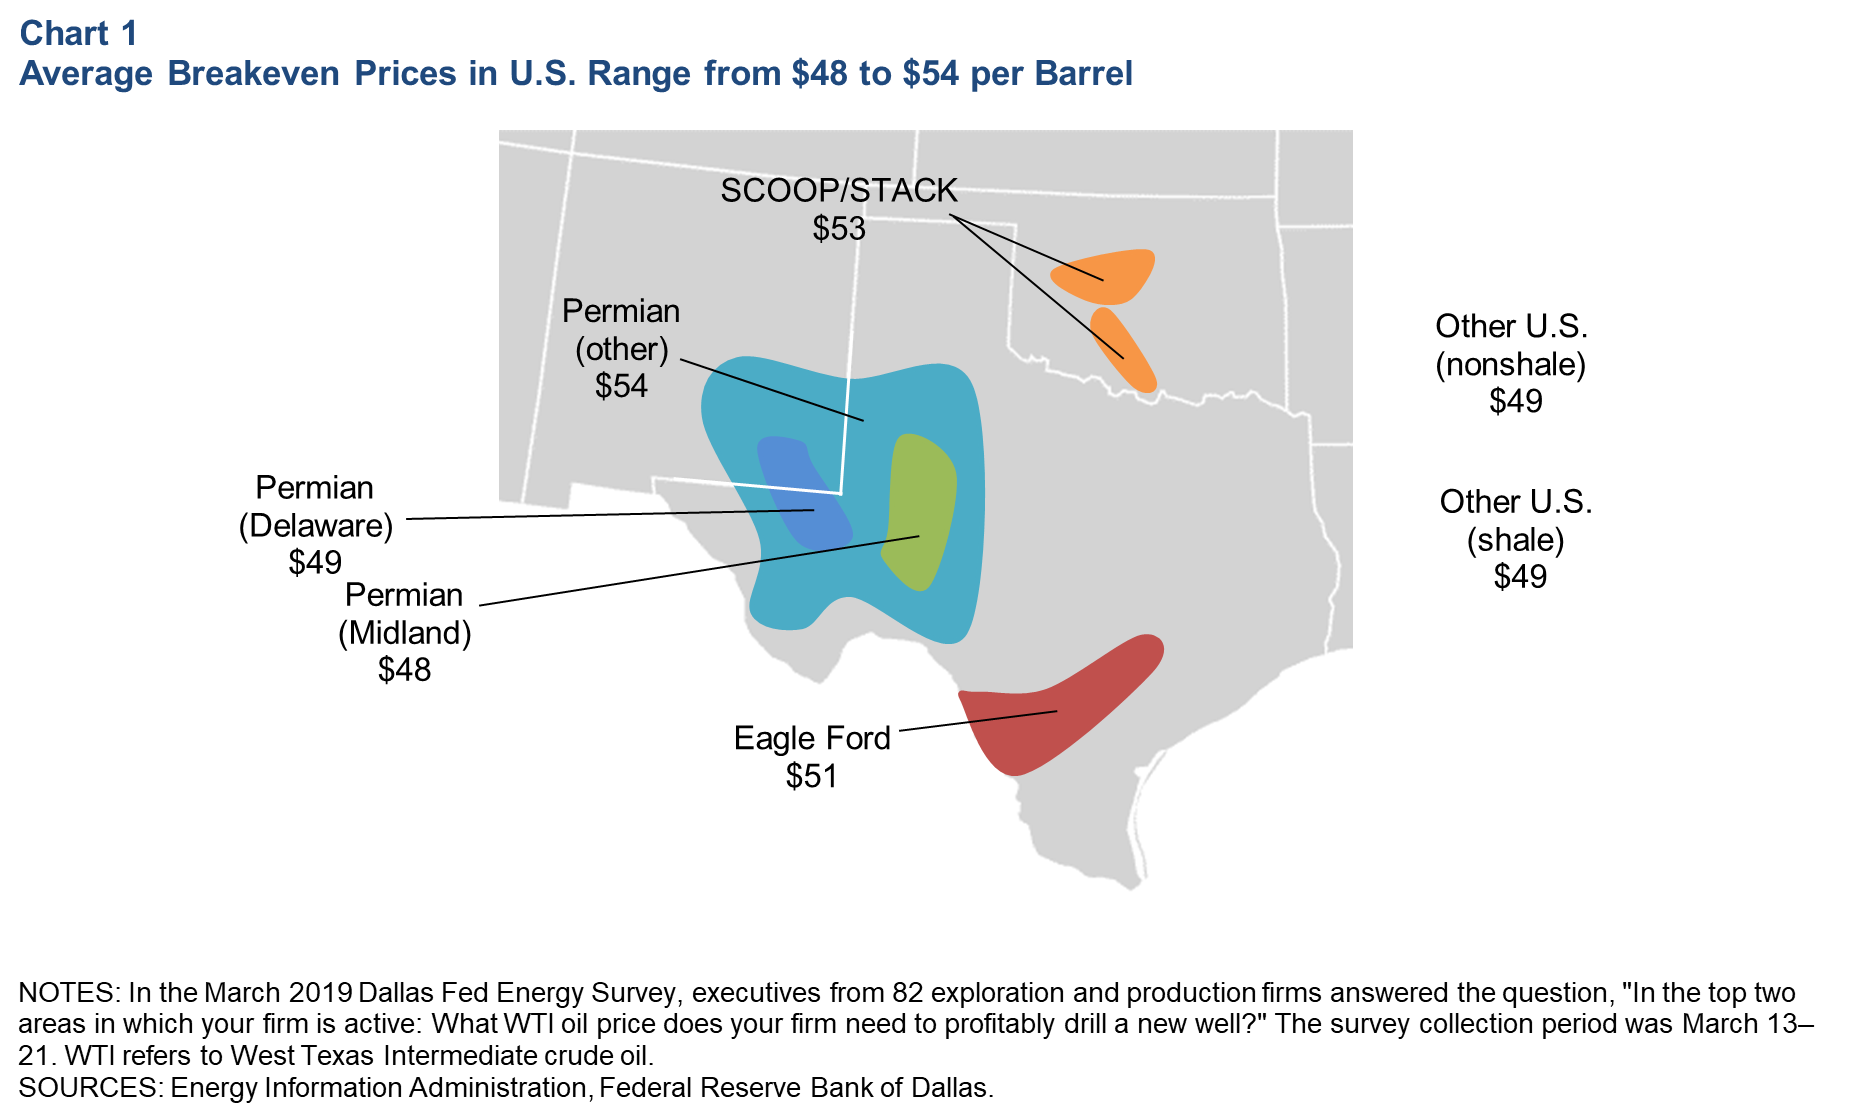
The average breakeven price of oil has fallen 4 percent (or $2 per barrel) over the past year, to $50 per barrel, according to the latest Dallas Fed Energy Survey. The $50 top-line figure masks some important differences. Areas such as the Midland and Delaware basins in the Permian Basin, hotbeds of shale activity, are routinely lower on average than other locations (Chart 1). There is also variability among operators; within the Permian Basin, for example, individual responses to the most recent survey ranged from $23 to $70.
Not all basins created equal
A recurring feature of Dallas Fed Energy Survey breakeven prices is wide variation in responses, both across and within areas. The survey does not specifically define “profitable,” which introduces a human element that could contribute to some of the variation. More important is the reality that some areas are “sweet” spots, with lower costs and wells that are more productive.
One way to see this more concretely is to consider model-based breakeven prices produced by energy consulting firms. These models often allow one to vary assumptions about drilling costs, production levels and other factors among areas. Similar to the Dallas Fed survey results, model-based breakeven prices often show wide variability within and across areas.
For example, Bloomberg New Energy Finance’s breakeven prices in the Permian range from $46 per barrel in Loving County to $87 per barrel in Reagan County. The wide variability is largely driven by the quality of the rock, with wells in Loving County typically producing at higher rates and lower costs relative to Reagan County.
Breakevens track long-dated crude oil futures
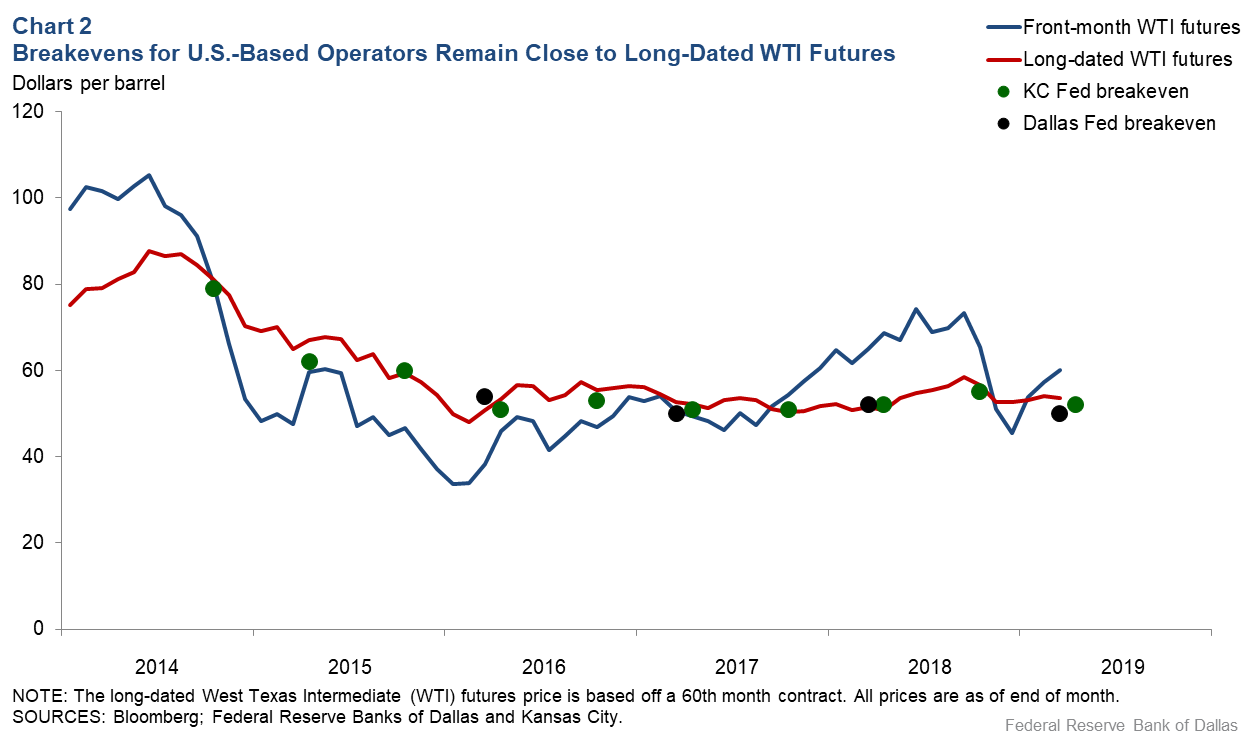
A futures contract is a binding agreement to buy or sell a specific commodity for delivery on a specific date in the future. When we refer to the long-dated futures price, we mean the price of oil for delivery five years in the future.
With that in mind, there is a very close and interesting connection between average breakeven prices and the long-dated West Texas Intermediate futures contract (Chart 2). This is true not only for the Dallas Fed Energy Survey, but also for the Federal Reserve Bank of Kansas City’s energy survey.
How should we interpret the long-dated futures price of oil? In theory, if the oil market were perfectly competitive, the long-dated futures price should equal the marginal cost of supply—the cost of producing one additional unit—needed to meet long-run demand.
In reality, while it is true that most producers in the oil market are price takers—they produce a small amount of oil relative to global supply and their product has minimal differentiation—the oil market is not perfectly competitive: OPEC can add or withhold production because it operates with spare capacity. Nonetheless, there is still good reason to believe the long-dated futures price will have a close connection with the marginal cost of supply.
Shale flattens oil cost curve, anchors futures prices
Rising U.S. shale production—likely to be a major source of incremental supply in coming years—has significantly affected the marginal cost of supply, providing a plausible link between the Dallas Fed average breakeven price and the long-dated futures price.
Horizontal drilling and hydraulic fracturing have made accessible significant amounts of oil reserves previously considered uneconomical to develop. Moreover, production costs for those reserves have declined dramatically over the past 10 years. More generally, companies have sought to lower costs associated with other, more traditional onshore and offshore oil holdings. As a result, larger quantities of oil are economical to produce at much lower prices than would have been possible before.
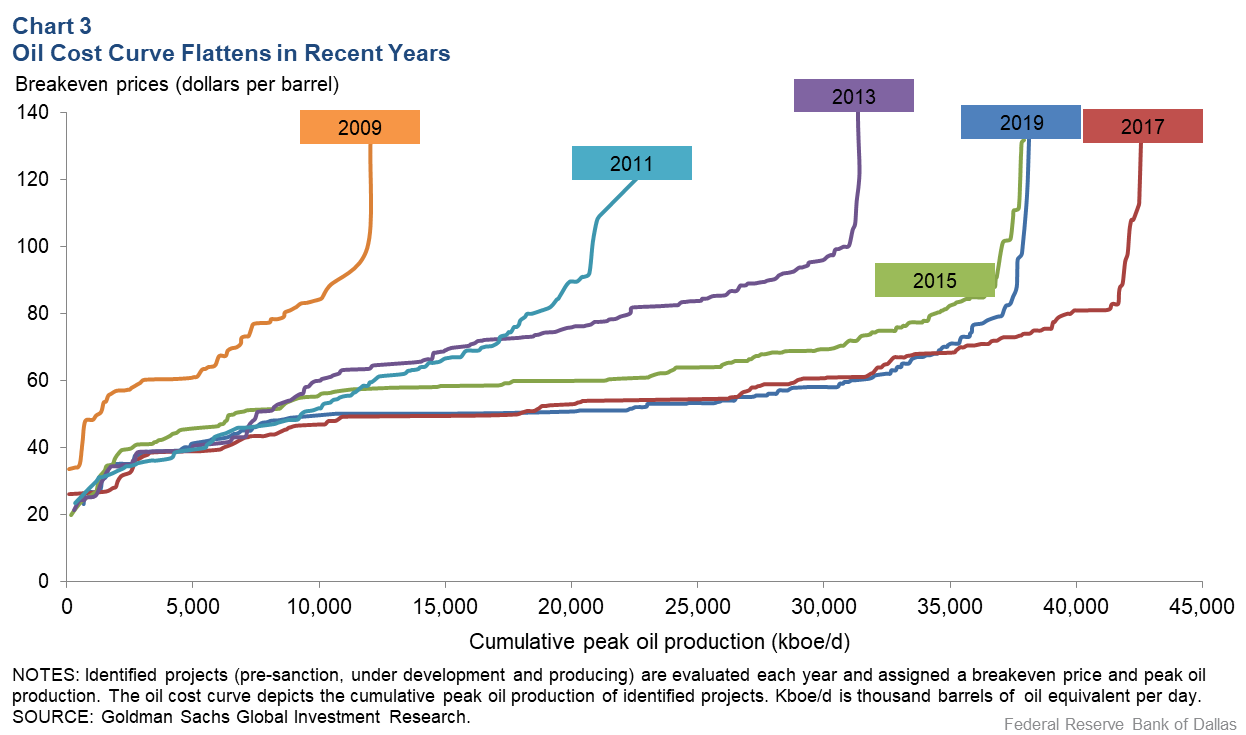
Recently evolving oil cost curves illustrate this development. An oil cost curve tries to provide information on how much extra supply could be forthcoming at a given price of oil. Usually the price of oil is shown on the left-hand axis. If the curve is upwardly steep, very high oil prices are needed to bring relatively small amounts of new production. A flat curve suggests the opposite.
Over the past 10 years, oil cost curves have moved from being very steep to having a long, flat portion between $50 and $60 as the industry has added resources and as costs have declined (Chart 3). In other words, shale production means there is a much larger amount of supply that can be called into action given a much smaller price increase than in the past.
While market participants may differ on how much oil is available at a given price, they are all aware of the overall trends. These represent strong forces that should keep long-dated futures prices from rising too high or falling too low. Similarly, breakeven prices reported by Dallas Fed Energy Survey participants reflect the principal trends involving the marginal cost of supply in the oil market.
Given current market prices, U.S. shale production will continue growing this year. Indeed, a recent report by the International Energy Agency highlighted that shale production is likely to be a major driver over the next five years. This does not rule out the possibility of major oil price movements, but it does point to a strong tendency that oil prices will be range bound in the near future.
The breakeven price survey results were updated in the first quarter 2020—which included the price collapse and coronavirus crisis—and were published March 26 along with a discussion of responses.
About the Authors

Michael Plante
Plante is a senior research economist in the Research Department at the Federal Reserve Bank of Dallas.

Kunal Patel
Patel is an associate economist in the Research Department at the Federal Reserve Bank of Dallas.
The views expressed are those of the authors and should not be attributed to the Federal Reserve Bank of Dallas or the Federal Reserve System.