Energy Indicators

February 2020
The coronavirus is taking a bite out of oil markets, with oil prices the first week of February down $8–$9 per barrel from January averages. Oil and gas jobs continued to decline through the end of 2019, while employment in refining and chemicals industries improved year over year. Refiner margins weakened at the end of 2019, and polymer prices on the Gulf Coast increased slightly in January amid a two-year downward trend.
Energy prices
Average Brent crude oil spot prices slipped in January to $64 from $67 in December 2019 (Chart 1). While prices had weakened in early January as the outlook for global consumption waivered, late-month developments surrounding the coronavirus outbreak in China have substantially reined in expectations for global commodities demand, dragging prices down. In the week ending Feb. 7, Brent averaged $55, with U.S. prices following suit. Magellan East Houston was $61 in January and averaged $53 the week of Feb. 7. West Texas Intermediate crude (WTI) was $58 in January and $51 the week of Feb. 7.
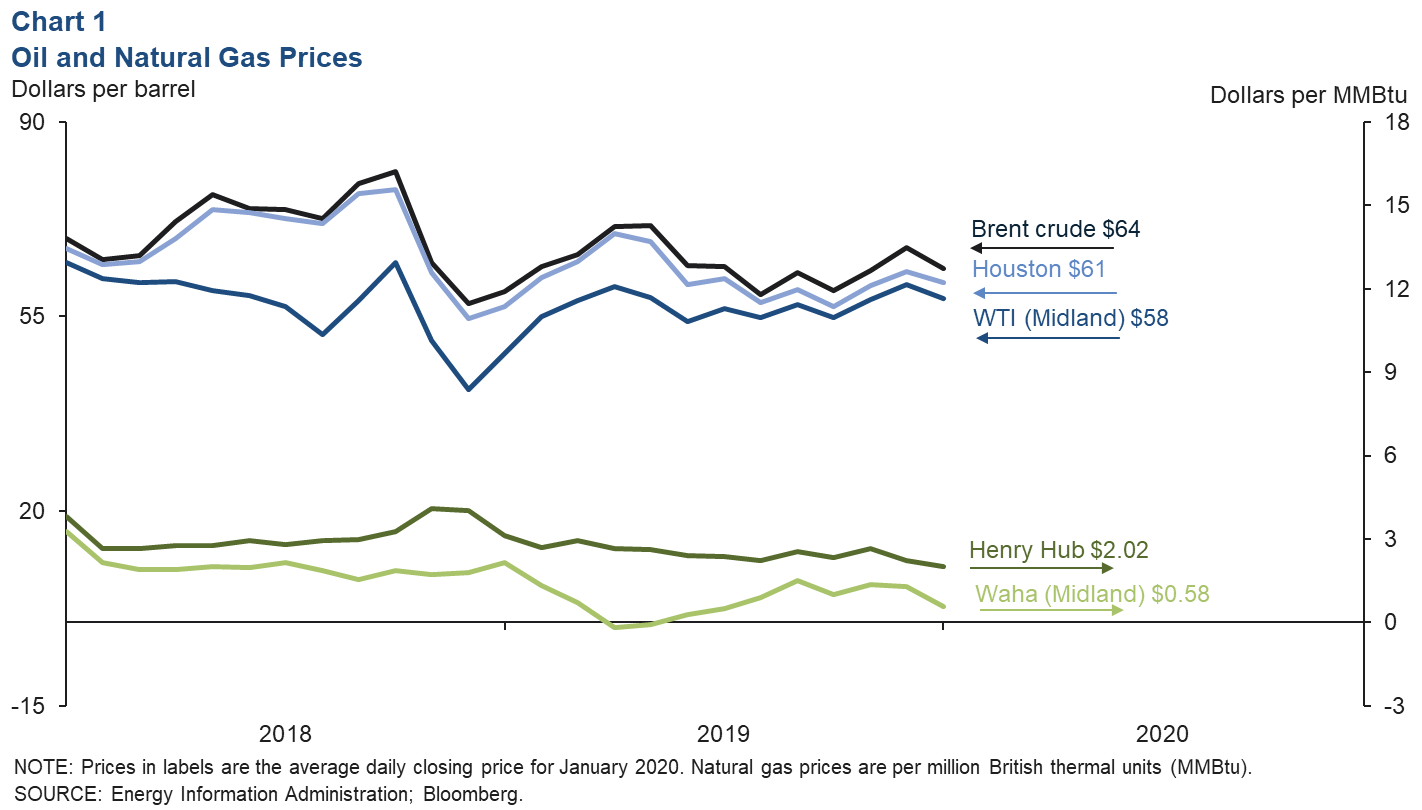
Natural gas priced at Henry Hub averaged $2.02 per million British thermal units (MMBtu) in January, extending a steady erosion as mild winter weather moderated demand and ample supplies propped up storage. Seasonally adjusted weekly inventories showed a sharp increase in late January, and Asian liquefied natural gas benchmarks fell due to demand concerns centered on the coronavirus. This dynamic will keep downward pressure on natural gas prices.
Rising production and limited takeaway capacity continue to hamper natural gas priced in West Texas. Benchmark Waha averaged 58 cents in January, down from $1.27 in December, and closed as low as 13 cents at the end of the month.
Oil and gas jobs
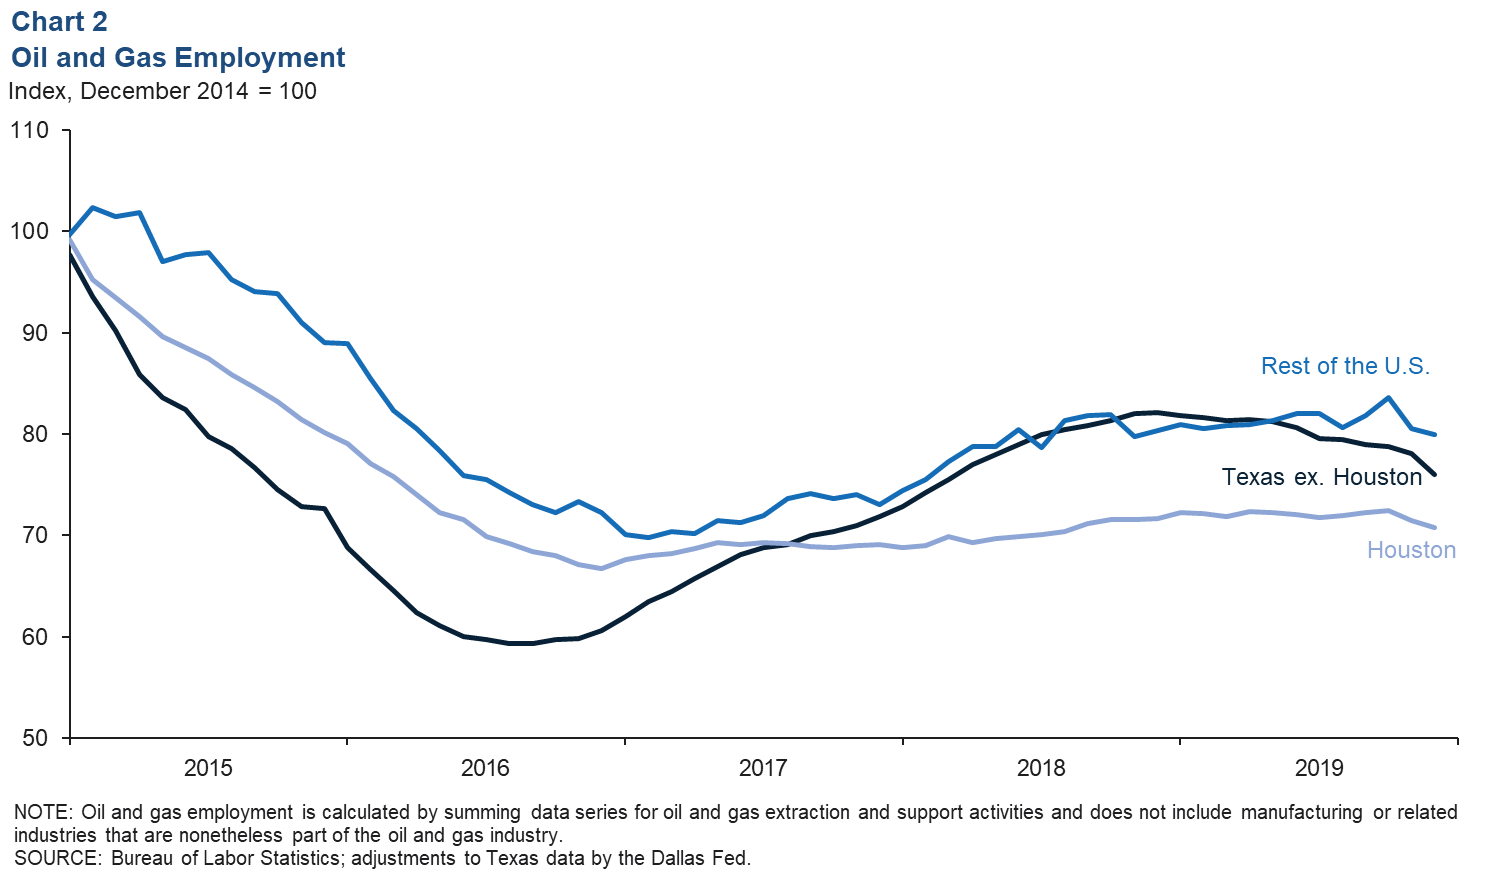
Upstream energy jobs—the sum of oil and gas extraction (mostly exploration and production firms) and support activities for mining (mostly oilfield services firms)—drifted down in the second half of 2019, particularly in Texas (Chart 2). Mining jobs in Houston (the industry headquarters), having only modestly recovered from the effects of the oil bust in 2015–16, fell 1.2 percent from December 2018 to December 2019. The rest of Texas (excluding Houston) saw a more-pronounced decline, dropping 7.5 percent over the year, with losses centered on the services side of the business. Mining jobs in the rest of the United States (excluding Texas) have effectively been flat since mid-2018.
Oil and gas manufacturing jobs
Job growth in 2019 was healthier across downstream or hydrocarbon processing sectors, which in aggregate grew 1.2 percent year over year in the U.S. These industries process crude oil, natural gas liquids, methane and other inputs into products such as gasoline, plastic resins, tires, fertilizers and pharmaceuticals. Texas outpaced the rest of the U.S. across sectors, particularly petroleum and coal products manufacturing, which grew 3.3 percent in Texas while contracting elsewhere in the U.S. (Chart 3).
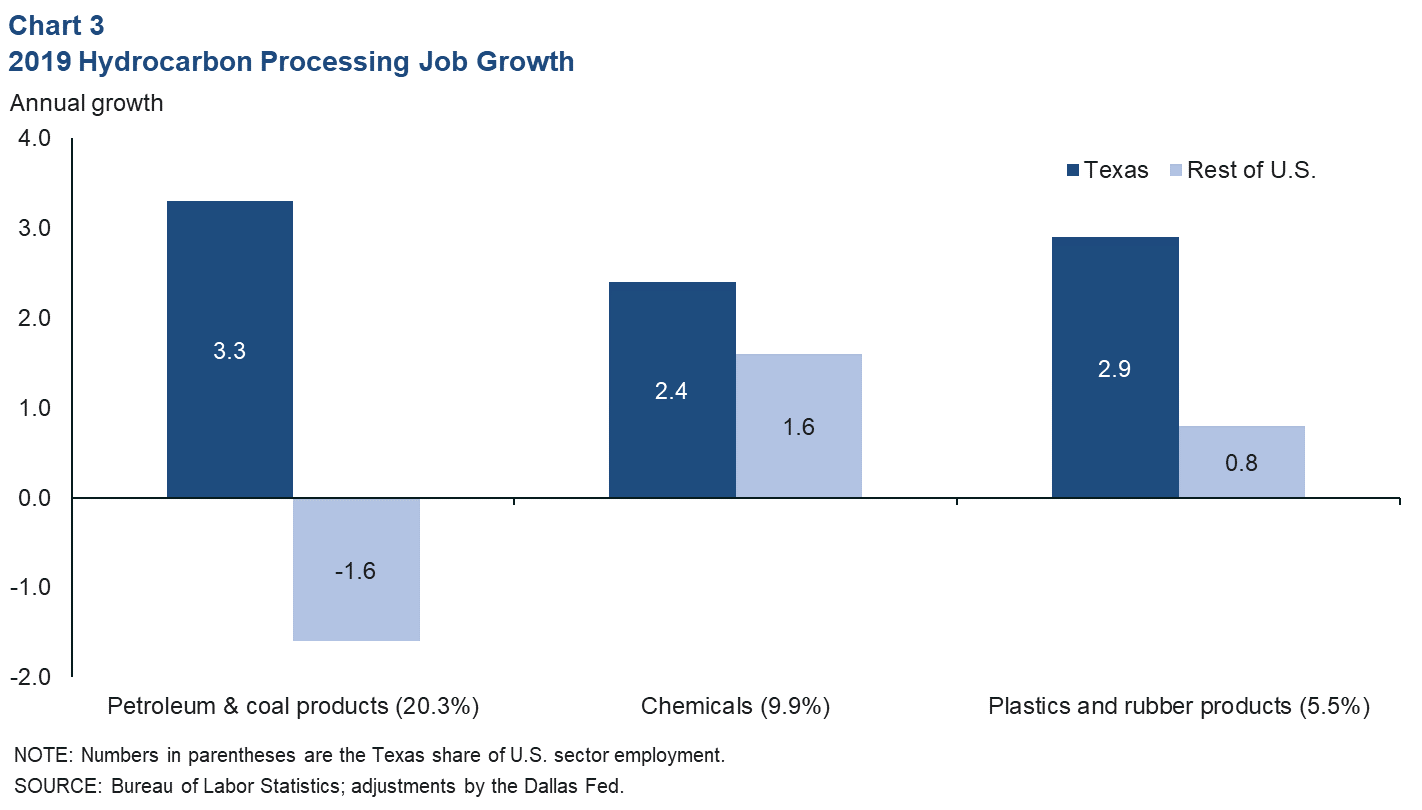
Texas chemical and plastics product manufacturing jobs outpaced the rest of the U.S. last year. The state is receiving the lion’s share of a decade of capital investment by the chemical industry as firms race to convert surging raw materials output from U.S. shale basins into products aimed at export markets.
Refiner margins
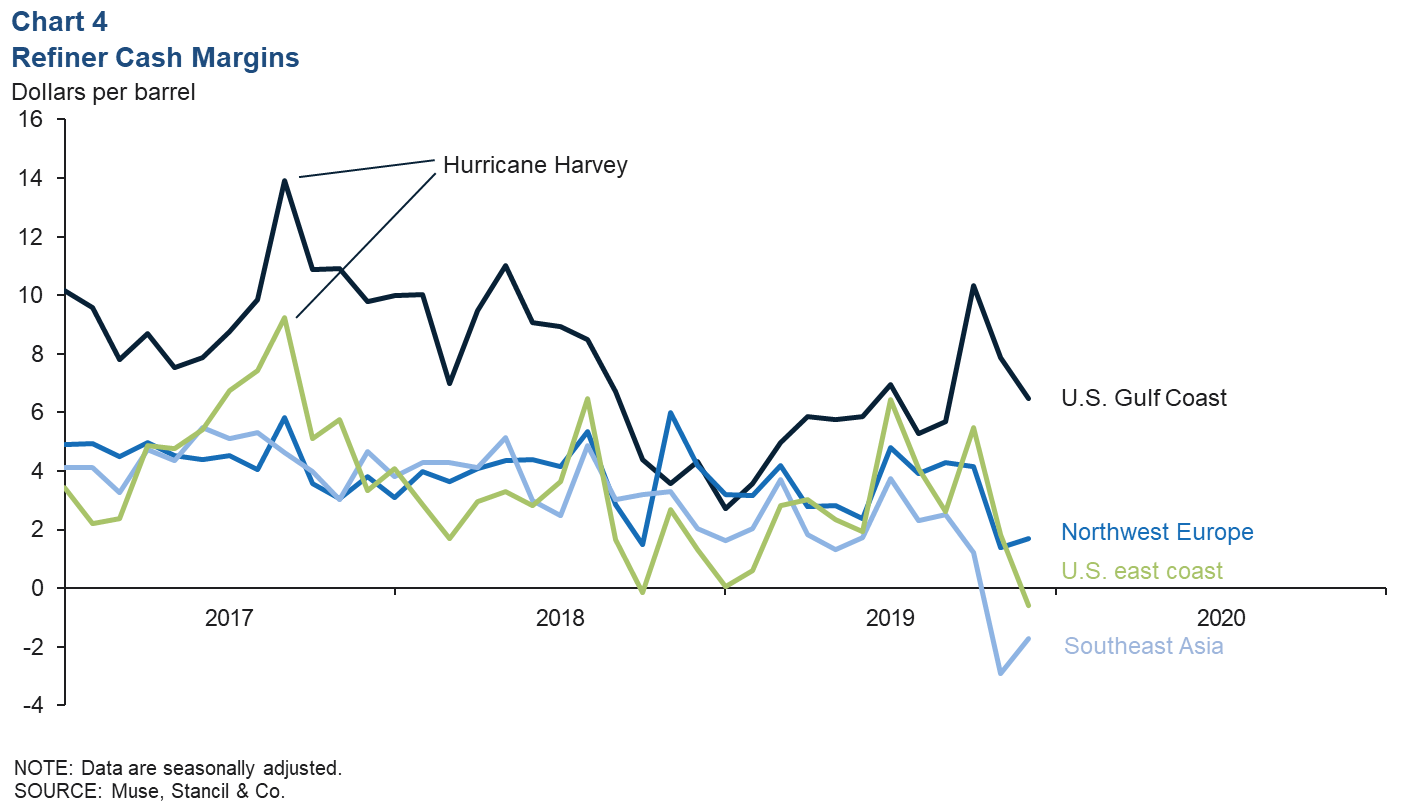
Refiner margins dipped toward the end of 2019, as rising global production capacity, an uncertain outlook for global demand and increasing U.S. inventories of products like gasoline and distillates ate into refiner profits in fourth quarter 2019 (Chart 4).
Fuel oil prices
Prices for fuel oils that contain higher amounts of sulfur (3.5 percent sulfur fuel oil) fell relative to benchmark Brent crude in 2019, particularly in the second half of the year (Chart 5). Demand for higher-sulfur fuel oil has been in decline thanks to a global shipping industry regulation, dubbed IMO2020, which limited the amount of sulfur maritime vessels were allowed to burn in their fuel starting Jan. 1, 2020. Some ships with scrubbers to remove the sulfur from their exhaust are exempt from the rule, but that option is limited to larger vessels.
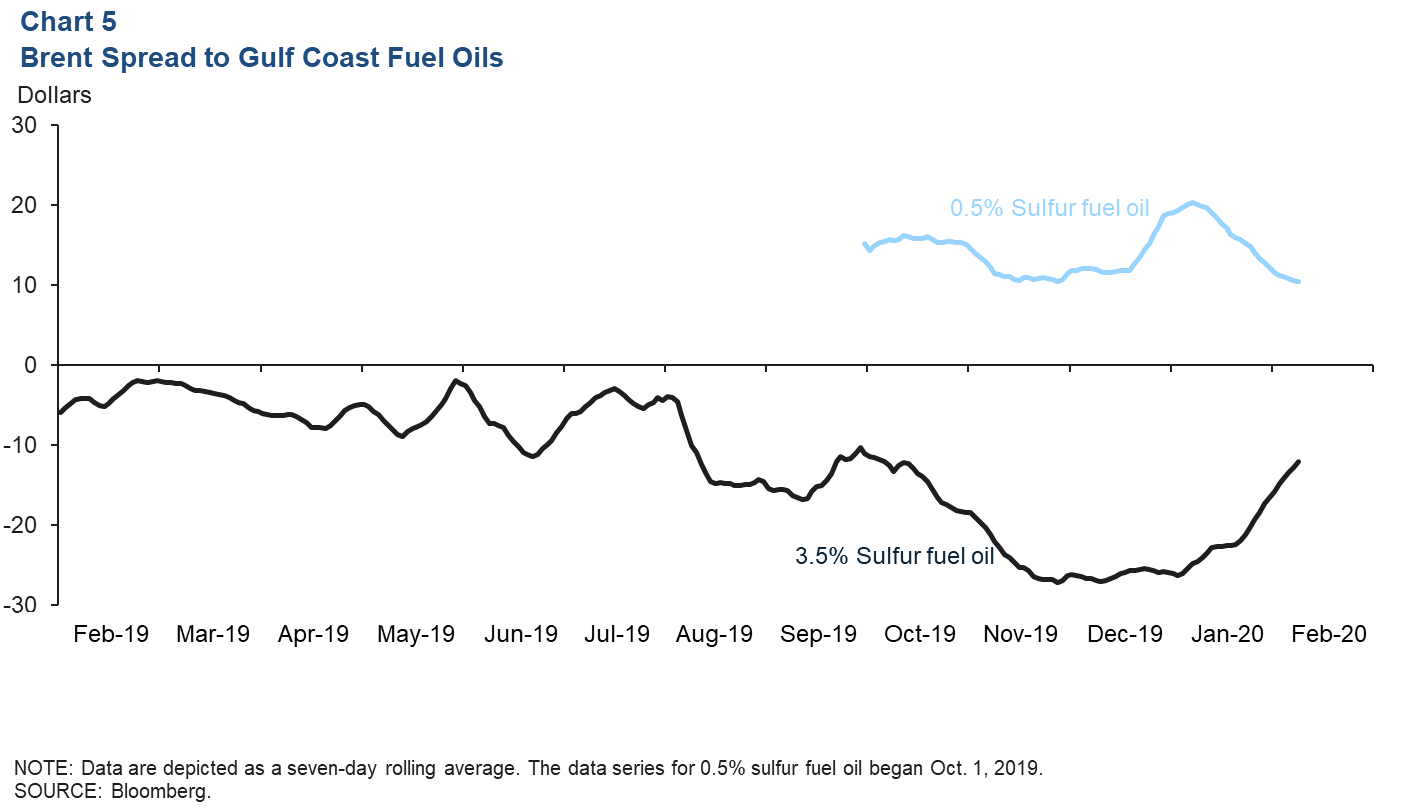
IMO2020 propped up demand for lower-sulfur alternatives, which could either be burned without violating the mandate or be more readily blended with other low-sulfur oils or distillates to produce compliant fuels. Data for 0.5 percent sulfur fuel oil showed the product trading at a substantial premium to Brent at the start of the year thanks to the mandate. However, low-sulfur fuel oil prices have weakened recently as the coronavirus has impacted shipping demand.
Plastic resins
Ethane is co-produced with natural gas from oil and gas wells and is used as a raw material for the production of ethylene, a versatile intermediate molecule involved in the production of many different petrochemical products. Shale gas production has substantially boosted ethane supplies the past eight years and kept the material’s price at or near historical lows most of that time. The feedstock cost of ethane—the price adjusted for the yield of ethylene from processing it—edged down to 6.3 cents per pound in January 2020 (Chart 6).
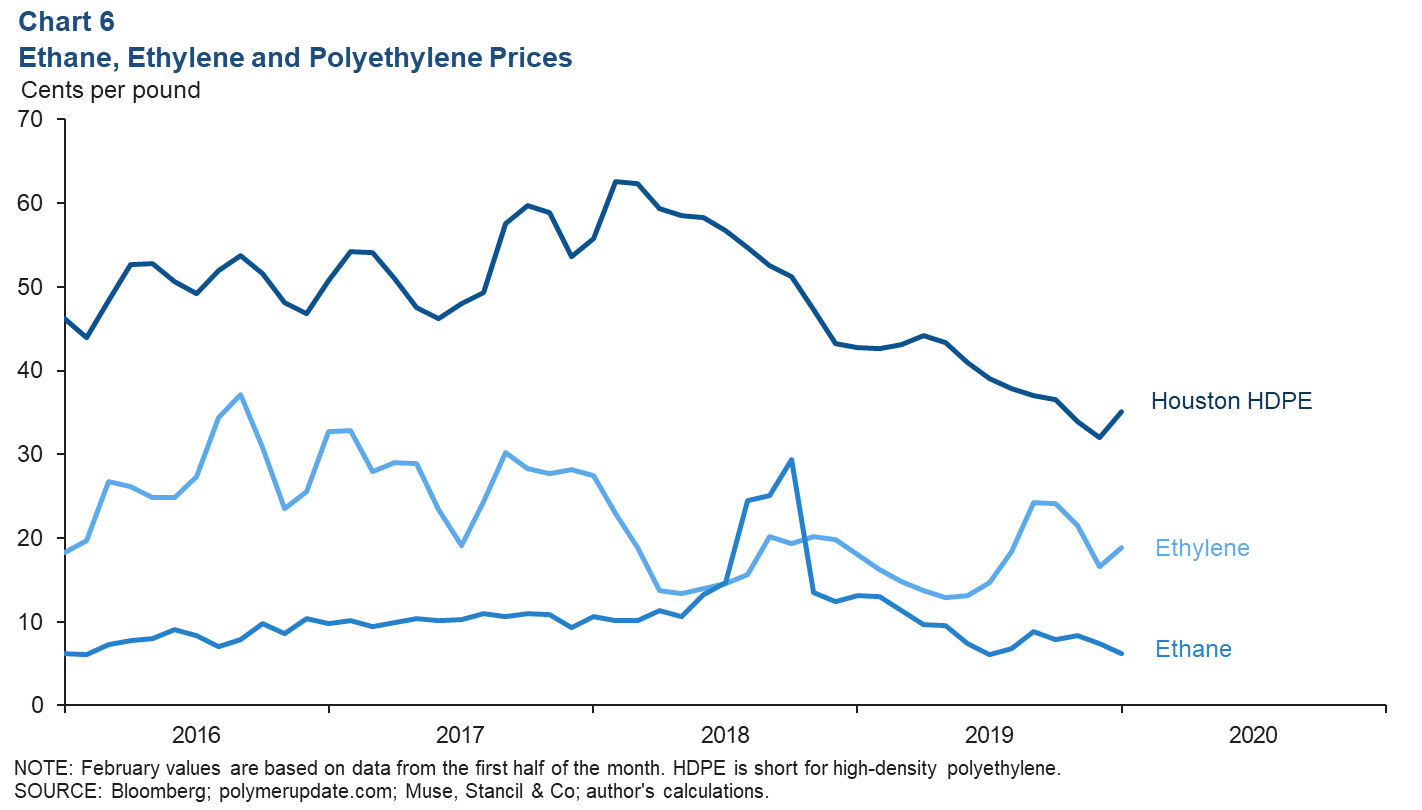
The price of ethylene has also been on a general downward trend as a surge in new chemical plants substantially increased supplies on the Gulf Coast. Prices rose in late 2019 due to a number of unplanned outages, heavy seasonal maintenance and delayed startups of new production facilities. Pipeline-delivered ethylene averaged 18.8 cents per pound in January.
One of the main uses of intermediate ethylene is the production of polyethylene—a plastic used in a wide array of consumer products. Its prices have been under pressure from rising capacity in the U.S. and Asia, tariffs on exports and slower global demand growth. Lower oil prices have also played a role in pushing down polymer prices as many ethylene plants around the world rely on oil byproducts for raw material instead of ethane. In January, Gulf Coast high-density polyethylene firmed slightly to 35.2 cents per pound.
About Energy Indicators
Questions can be addressed to Jesse Thompson at jesse.thompson@dal.frb.org. Energy Indicators is released monthly and can be received by signing up for an email alert. For additional energy-related research, please visit the Dallas Fed’s energy home page.