Energy Indicators

April 7, 2020
Note: Some of the data included in this release precede the coronavirus (COVID-19) outbreak in the U.S.
The U.S. oil industry already had a significant preexisting condition in the form of receding access to capital when the coronavirus (COVID-19) added to its ills. Activity was slowing, and oil and gas employment was contracting. The combined effect of negative shocks to demand and a positive shock to production has driven crude oil well below sustainable levels for many producers, presaging a steep decline in drilling activity. Weekly estimates of production were holding through late March, but inventories of motor fuel and crude oil were rising precipitously.
Employment
U.S. oil and gas jobs (the sum of employment in oil and gas extraction and in support activities for oil and gas operations) fell an annualized 7.4 percent (7,900 jobs) over the three months ending in February 2020. Texas jobs fell by a relatively shallow 0.5 percent (300), while the rest of the U.S. saw a decline of 15.5 percent (7,600) (Chart 1).
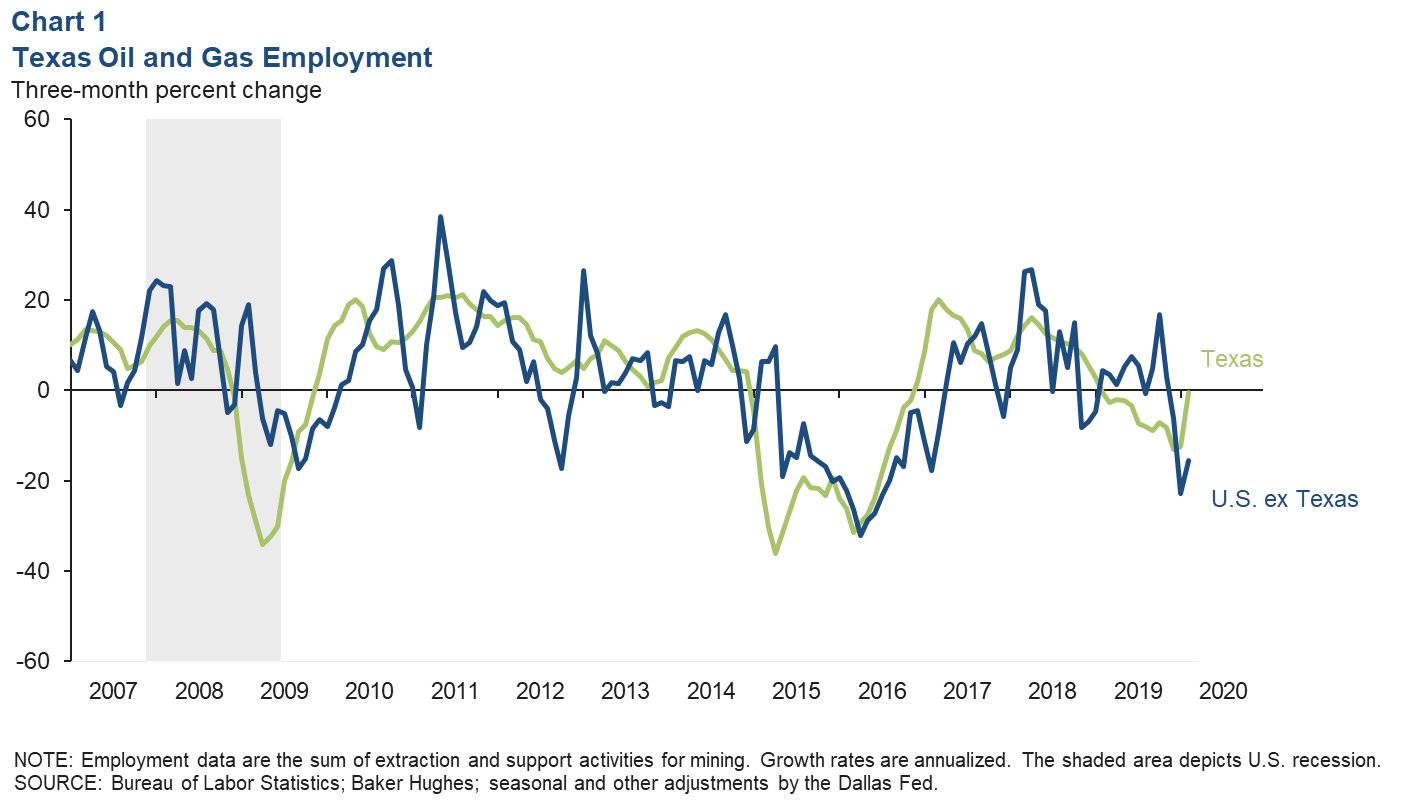
Challenges raising capital had forced many firms to cut back on planned expenditures, staff and contractors at the end of 2019. With the bulk of these declines occurring in December and January, the data suggest industry layoffs were abating as the new budget year got underway. This accounting does not include impacts to manufacturing, professional services, trucking or other subsectors that are significant parts of the supply chain for oil and gas operations.
Inventories
The U.S. gasoline days of supply (the volume of inventories divided by estimates of current consumption) rose to 27.9 in the last week of March on a seasonally adjusted basis. That’s the highest inventory level since September 2017 and the highest relative to its five-year rolling average since January 2017 (Chart 2). This surge was driven mainly by a drop in consumption due to much of the U.S. population staying home to avoid spreading COVID-19.
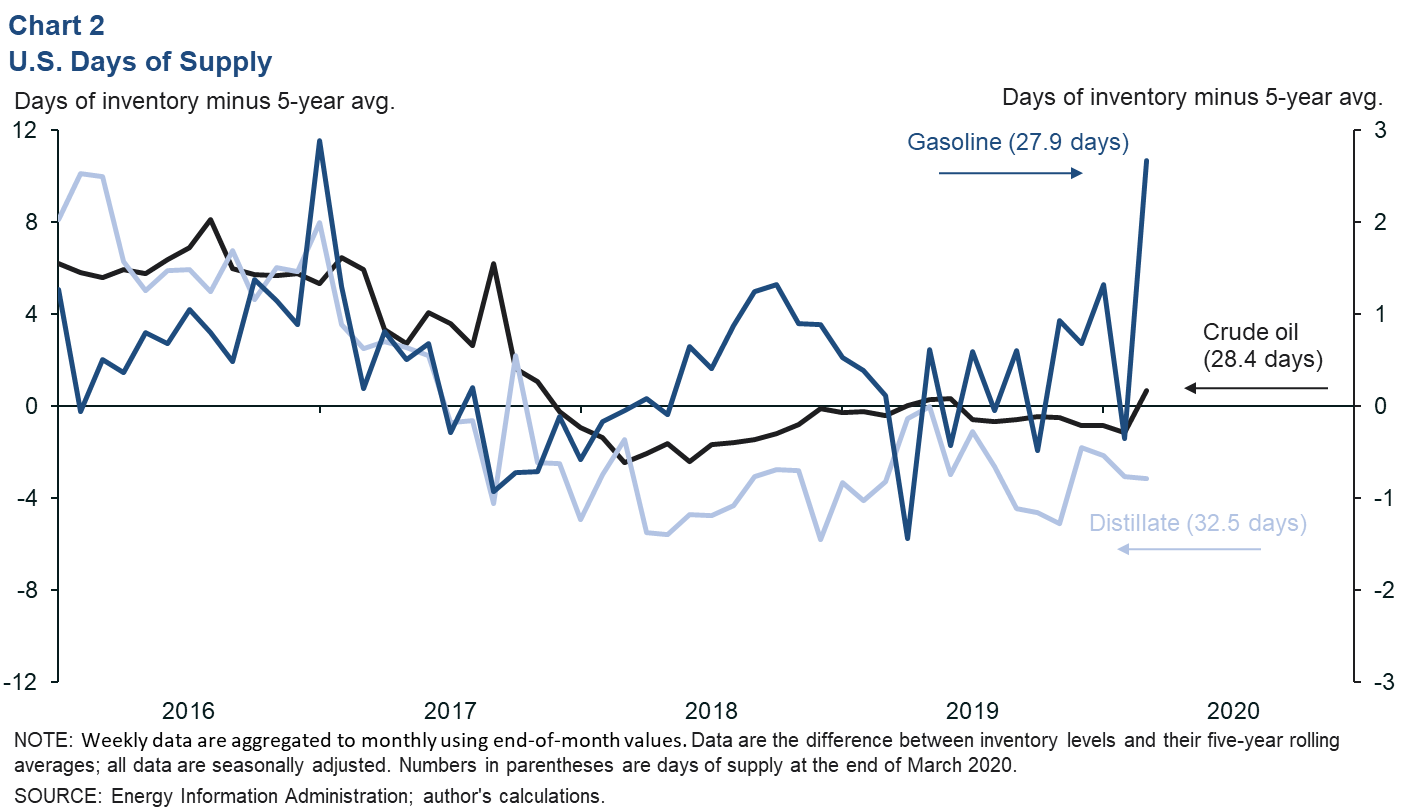
Crude oil inventories also got a boost in March. From February 28 to March 27, the seasonally adjusted days of crude supply (the level of commercial stocks of crude divided by the amount of crude input to refineries) increased by 1.9 days, the largest such increase on record outside of operational disruptions associated with hurricanes. The cause was the combination of a large drop in crude oil input to refineries and an increase of 6.7 million barrels of crude in commercial stocks.
Prices
Oil prices collapse amid falling demand, rising supply
After easing in January and February, prices for crude oil collapsed in March under the weight of falling demand as large swaths of the global economy shut down due to efforts to contain COVID-19. Further pressure on the market was brought to bear when an agreement among OPEC, Russia and several others (OPEC-plus) fell apart, resulting in increased production—principally from Saudi Arabia—and lower contract prices. This one-two punch sent the average price of Brent crude down from $55 per barrel in February to $34 in March. Brent closed at $26 on March 31 (Chart 3). West Texas Intermediate (WTI) crude priced in Midland (closer to the prices that Permian oil producers receive) fell by nearly half to average $28 in March. It ended March at $14.
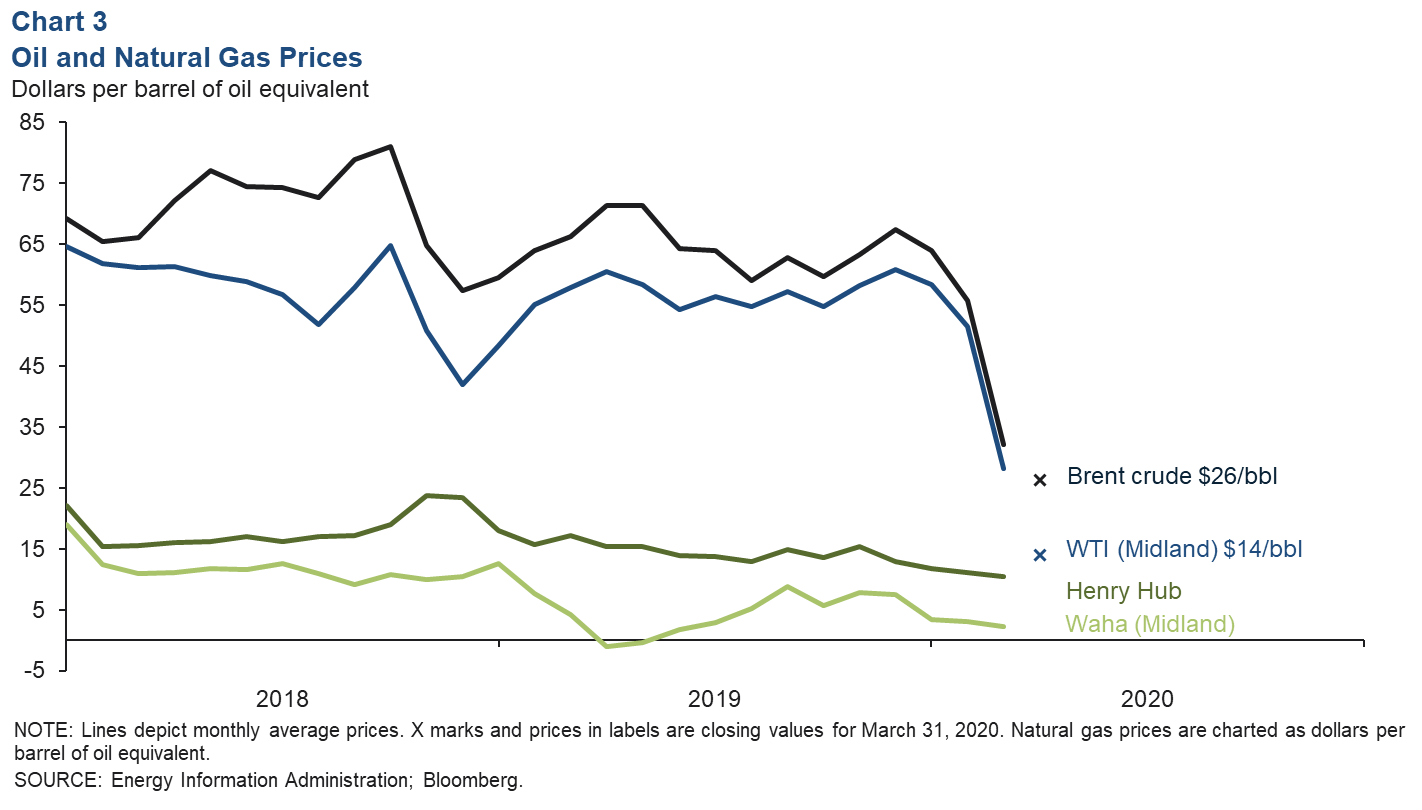
Price differentials also rose. Having oscillated around $2.32 the past two years, the discount from Brent to Houston (Magellan East) opened up to over $10 at the end of March. Moving inland, the discount from Houston to Midland held at around $2.
Natural gas prices slipped from $1.91 per million British thermal units (MMBtu) in February to $1.79 in March. Natural gas priced in West Texas (Waha) averaged $0.23 per MMBtu in March, down from $0.39 the prior month. Limited storage and takeaway capacity have kept the Waha benchmark depressed relative to Henry Hub amid high levels of associated gas production (natural gas and gas liquids extracted essentially as a byproduct of oil production) in the Permian Basin.
Spot prices too low to cover operating expenses
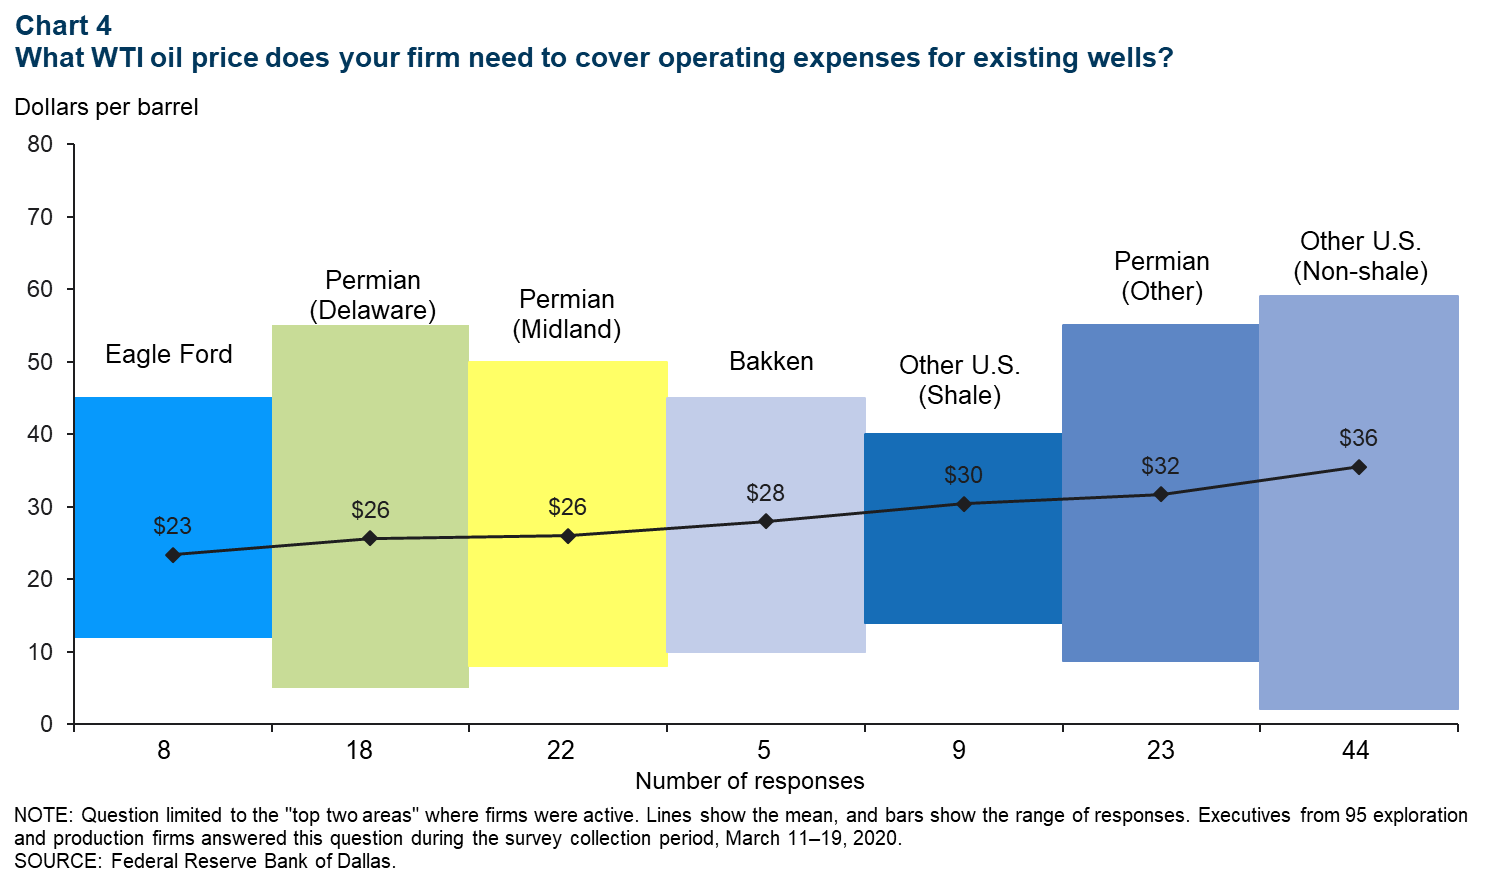
According to the first-quarter Energy Survey by the Dallas Fed, firms on average need WTI priced in Cushing, Oklahoma, to be at or above about $29 to cover operating expenses (Chart 4). The March average for WTI-Cushing was $29, but the benchmark spent the second half of the month in the mid-to-low $20s.
Rig counts
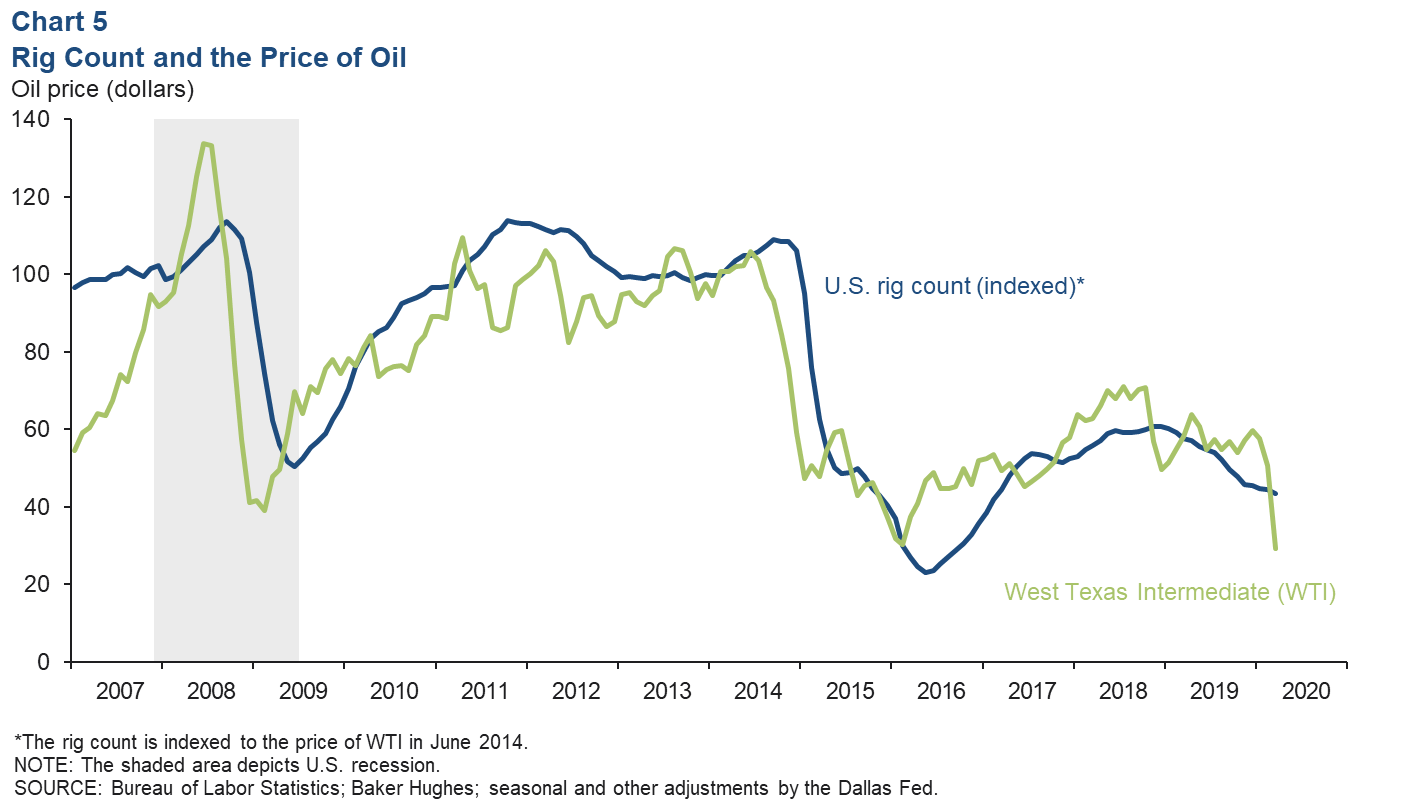
Drilling activity poised to fall with oil prices depressed
When monthly oil prices change, rig counts tend to follow with a lag of about three months. There were 771 active rigs on average in March 2020, down from 804 rigs in December 2019 (Chart 5). If oil prices stay below levels needed to cover operating expenses from existing wells, there will be substantial downward pressure on drilling and completion activity. Given limited storage capacity and the continued lack of access to capital, rig counts are poised to fall more quickly than in prior downturns.
Oil rig count sees largest two-week drop since 2016
The number of rigs drilling for oil fell by 59 units over the two weeks ending March 27 (Chart 6). That’s the largest two-week drop since Feb. 19, 2016. The oil rig count had been slipping over the past year as capital-constrained shale drillers focused on completing their inventory of wells and limited their drilling activity to the most productive projects. This allowed monthly crude oil output to grow nearly 0.9 million barrels per day (mb/d) to 2.7 mb/d year-over-year in January 2020. Weekly estimates put U.S. crude production in March at nearly 13 mb/d.
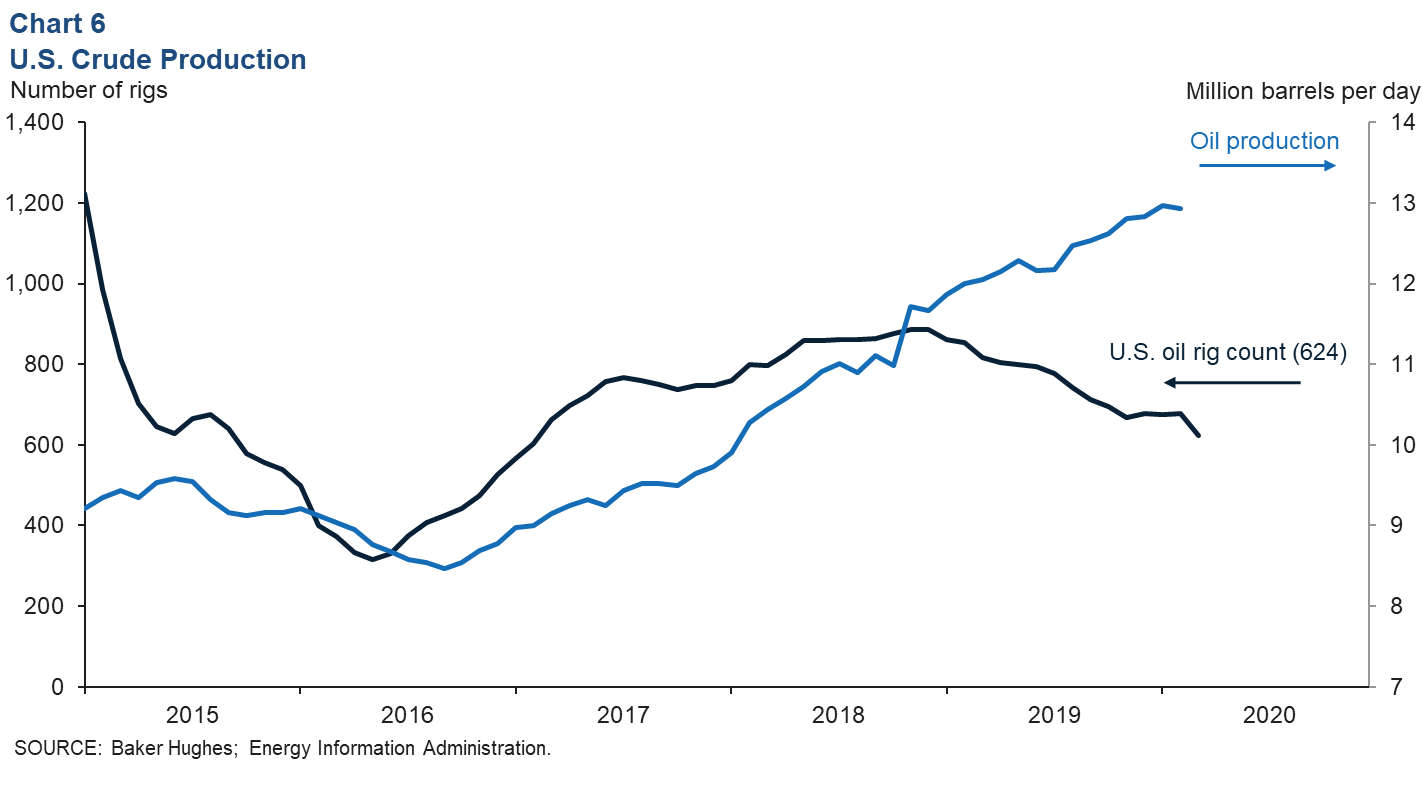
A wide range of sources including Goldman Sachs and Spears Consulting, as well as comments from industry executives, indicate that if recent conditions persist, U.S. crude production is likely to fall. However, there is wide disagreement about the magnitude of the projected declines.
About Energy Indicators
Questions can be addressed to Jesse Thompson at jesse.thompson@dal.frb.org. Energy Indicators is released monthly and can be received by signing up for an email alert. For additional energy-related research, please visit the Dallas Fed’s energy home page.