Energy Indicators

July 23, 2021
Recent data for the energy sector have been positive. Energy prices rose to multiyear highs, and drilling activity extended a steady upward march. As activity has heated up, hiring in the oil and gas industry has accelerated sharply. Overall, market conditions remain supportive of a further pickup in U.S. oil and gas activity.
Energy prices
Crude hits multiyear highs in summer
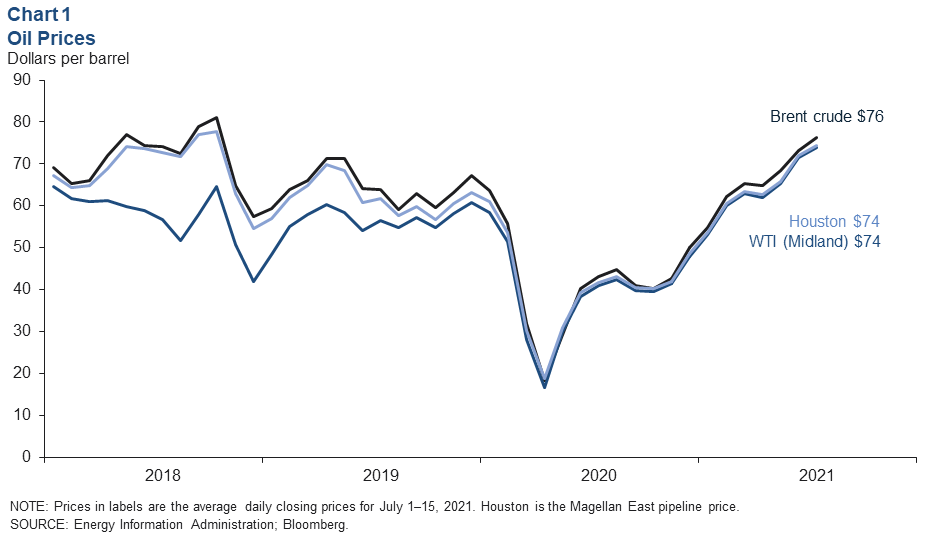
At $73 per barrel in June, Brent crude saw its highest monthly average since October 2018, and it rose further in the first half of July to $76 (Chart 1). Texas benchmarks weren’t far behind. Both Midland and Houston averaged nearly $72 in June before rising to $74 in the first two weeks of July. That puts the price of crude in Midland—closer to the wellhead price that producers receive—at its highest level since November 2014.

Higher oil prices were supported by rising demand as the global economy reopened from the pandemic and constrained supplies. Factors constraining crude supplies included strong compliance with production targets among members of the OPEC+ group of nations (Organization for the Petroleum Exporting Countries, Russia and several others) and limited access to capital for U.S. producers.
U.S. natural gas at highest level since 2014
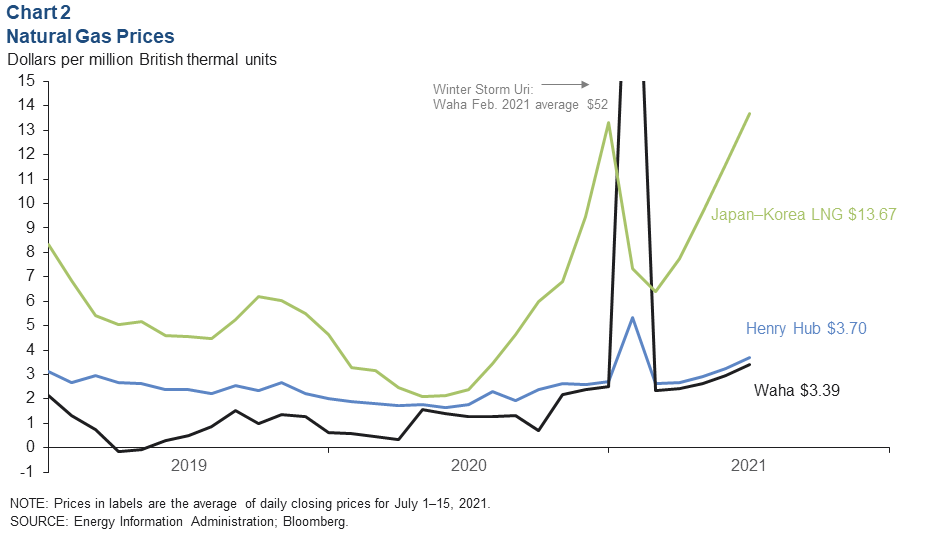
Benchmark Henry Hub natural gas averaged $3.26 per million British thermal units (MMBtu) in June, its highest monthly average since January 2017 and highest summer price since 2014. The first half of July saw Henry Hub rise further to average $3.70 (Chart 2). West Texas Waha natural gas—closer to the wellheads of the Permian Basin—averaged $2.97 in June and rose to $3.39 in early July.

Elevated prices are supported by seasonally low inventories of natural gas after a cold winter, muted production growth from oil and gas firms that are constrained by demands for capital discipline from investors, and increased consumption by utilities as hot weather and heat waves have driven up summer cooling demand.
Liquefied natural gas (LNG) prices have climbed on strong global demand. The Japan–Korea LNG benchmark averaged $11.58 per MMBtu in June and reached $13.67 in the first half of July. If it holds at that level, it would be the highest monthly average since September 2014. Asian industrial and consumer demand—mainly from China—is driving strong imports to the region.
Brazilian LNG demand is also elevated as drought drives utilities dependent on hydropower to consume more natural gas to meet summer demand. European consumers are also facing tight supplies and high prices due to limited supply increases from Russia and pipeline outages amid high demand from utilities.
U.S. drilling activity
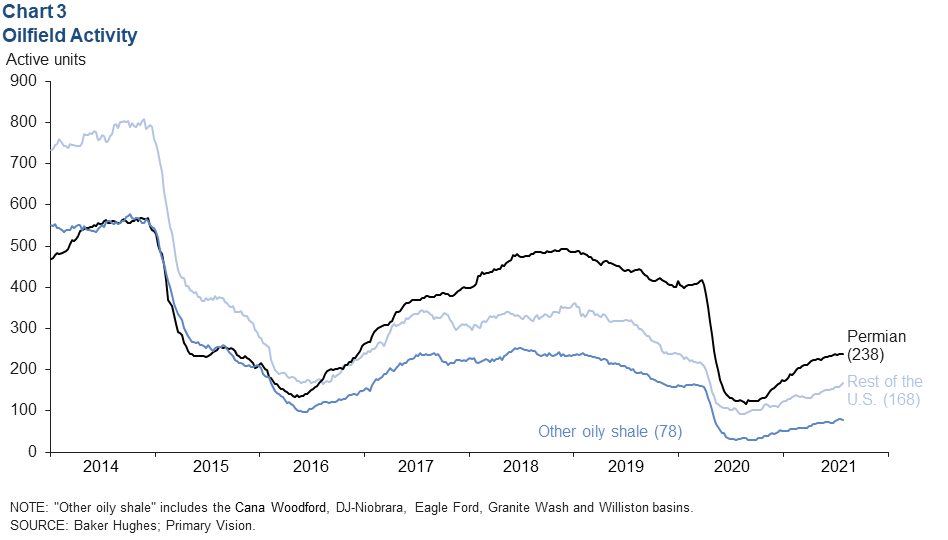
Drilling and completion activity continued to increase at a modest pace, principally among smaller private oil and gas firms. The U.S. rig count rose to 484 as of mid-July (Chart 3). Within that total, drilling activity in the Permian Basin leveled off near 238 rigs, while other basins saw steady growth. The rig count in other oil-focused shale basins like the DJ-Niobrara collectively rose to 78, while rigs in the rest of the U.S. climbed to 168.

Oil and gas employment
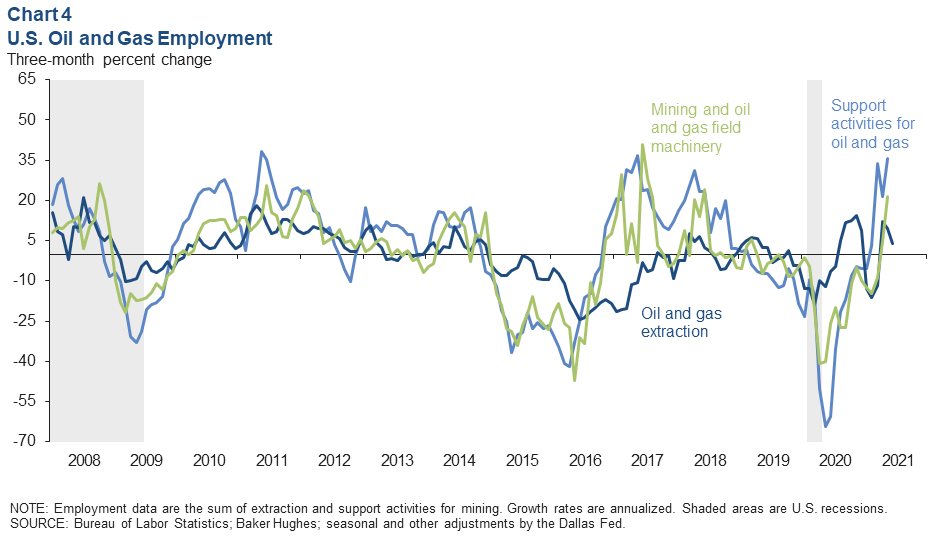
Job growth in oilfield services and related manufacturing accelerated over the three months ending in May 2021—the most recent national data available for the subsectors. These jobs are closely tied to oilfield activity. Support activities jobs grew at an annual pace of 36 percent from April to May, and mining/oil and gas field machinery manufacturing grew at a 21 percent pace (Chart 4). The last time both subsectors grew at comparable paces was in the summer of 2018.
Oil and gas extraction jobs—mostly at exploration and production companies—decelerated to a 3.9 percent annual growth rate over the three months ending in May.

About Energy Indicators
Questions can be addressed to Jesse Thompson at jesse.thompson@dal.frb.org. Energy Indicators is released monthly and can be received by signing up for an email alert. For additional energy-related research, please visit the Dallas Fed’s energy home page.