Energy Indicators

December 16, 2021
The U.S. will likely produce nearly 11.7 million barrels a day (mb/d) of mostly light sweet crude oil in December, according to the Energy Information Administration (EIA). Imports of mostly medium and heavier crude oils rose in the third quarter as refiners processed more petroleum to meet rising demand for fuels, though jet fuel demand continues to lag other products. Overall, global demand for petroleum is expected to surpass 2019 levels by the end of 2022, contingent on the course of COVID-19. In the meantime, the cost of global energy is elevated heading into winter.
U.S. production and crude oil exports
The EIA estimated that the U.S. produced 10.8 mb/d of oil in September, down from 11.3 mb/d in July due to Hurricane Ida. With the recovery from the hurricane and more recent weekly data, the EIA now expects that the U.S. will produce closer to 11.7 mb/d in December, an increase of 0.6 mb/d from December 2020.
Oil comes in many flavors that are primarily characterized by sulfur content (how “sour” the oil is) and by API gravity (how “light” it is). For example, the shale oils produced in the Permian Basin tend to be “light and sweet” with gravities near 44 degrees and less than 0.05 percent sulfur content. In September 2021, the U.S. altogether produced about 6.2 mb/d of light crude with a gravity of over 40 degrees (Chart 1).
Light and sweet shale oil has driven the growth in U.S. output over the past eight years and has been the main force behind rising exports. In September, the U.S. exported 2.7 mb/d of crude and will likely reach 3 mb/d by year-end based on weekly data.
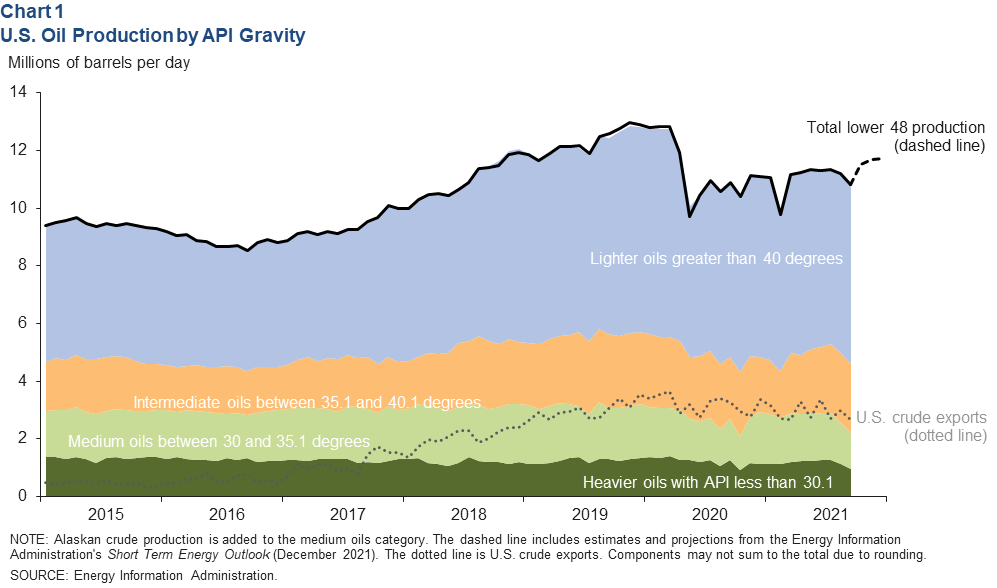
In contrast, the production of heavier crudes in the U.S.—API gravities below 35.1 degrees—collectively have been relatively flat the past decade. Examples of crudes that tend to fall in these medium and heavier categories include Alaskan North Slope crude and Mars crude from the Gulf of Mexico, respectively.
U.S. crude oil imports
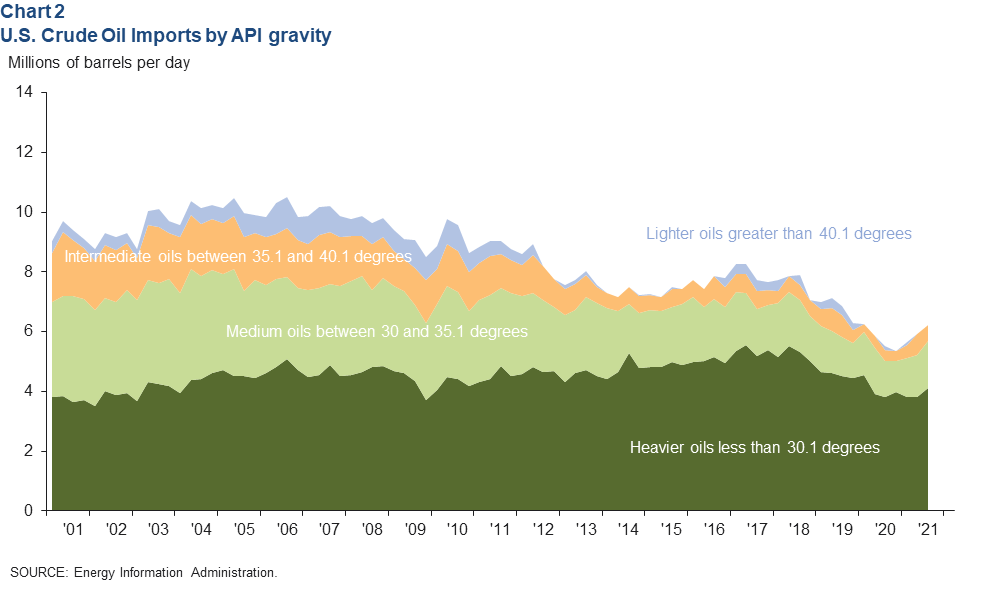
The U.S. imported nearly 10.1 mb/d of crude oil for use by domestic refineries in 2006. When U.S. crude production began to surge after the Great Recession, it crowded out other light and intermediate crude imports. By 2019, imports had fallen to 6.8 mb/d. During the pandemic, collapsing demand forced refiners to curtail operations and cut crude imports as inventories of products swelled. Refiners then struggled to balance the volumes of gasoline, diesel and jet fuel they were producing—which are relatively inflexible—with what locked-down populations demanded.
By the third quarter of 2021, which was negatively impacted by the hurricane, crude oil imports reached 6.4 mb/d—4.1 mb/d of which was heavier crudes with gravities below 30.1 degrees, mostly from Canada (Chart 2).
U.S. inputs to refineries
The gross volume of crude oil inputs to U.S. refineries was about 16 mb/d in the third quarter, 1.1 mb/d below the volume processed during the same period in 2019 (Chart 3). As demand continues to recover over the coming year, refiners will have to rely on a variety of crudes to meet consumer needs.
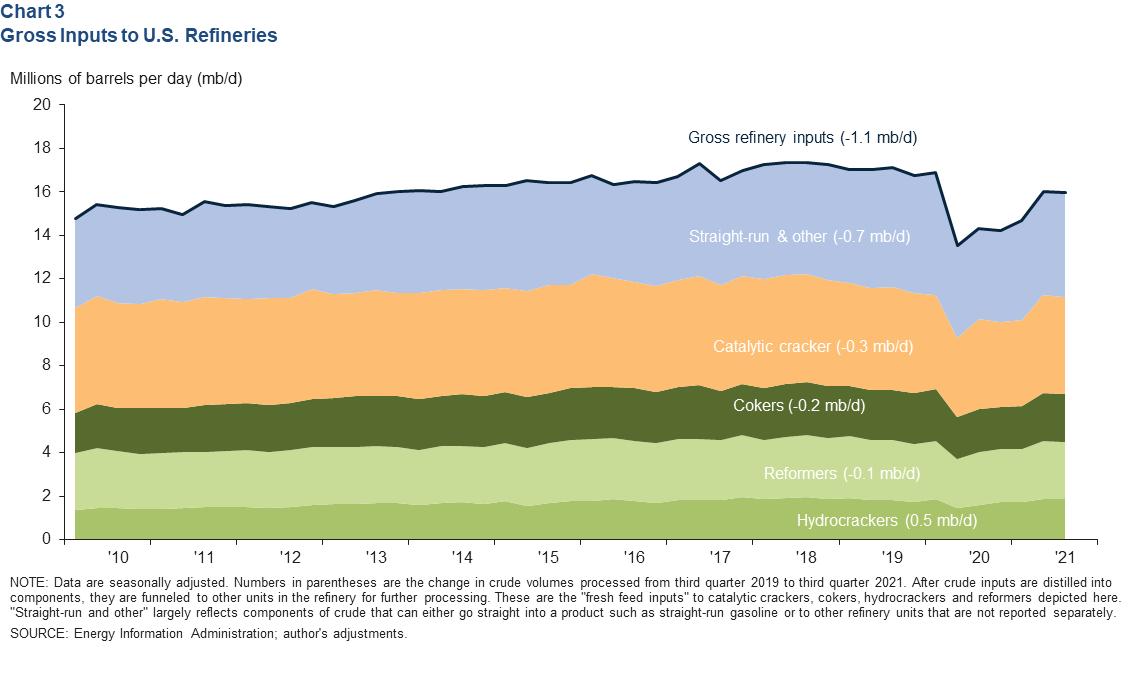
The blend of crudes processed by a given refinery depends on several factors, but it’s largely a function of which type of equipment the refiner uses. While some components of crude oil can pass right through a refinery with little to no processing—so-called straight-run gasoline or diesel—others require specialized treatment. Cokers process only complex heavy crudes into products like diesel and jet fuel. Catalytic crackers increase gasoline yield.
U.S. fuel consumption
Total product supplied in the U.S.—a close proxy for consumption—continues to hover near 100 percent of 2019 levels (Chart 4). Jet fuel still lags other products, however. It has recovered to roughly 80 to 85 percent of 2019 consumption levels during this holiday travel season. Concordantly, the number of global scheduled commercial flights had recovered to nearly 80 percent of 2019 levels in early December. The number of passengers going through Transportation Security Administration checkpoints is at nearly 85 percent.
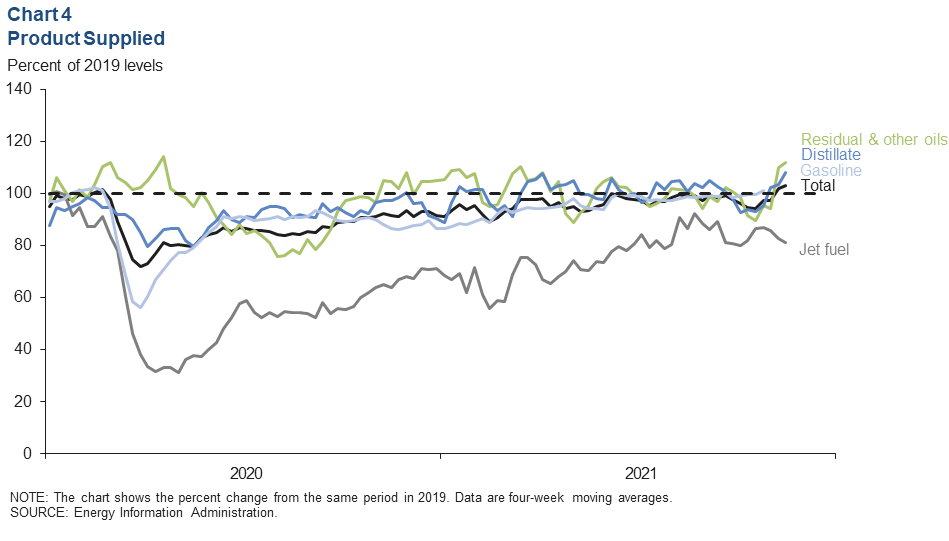
Leisure travel continues to be suppressed by COVID-19 as travel and business restrictions follow outbreaks of new variants around the world. Business travel—particularly quick shuttle flights for in-person meetings—has greater competition from videoconferencing. It’s unclear what the net effect will be on jet fuel demand as time goes on.
Global energy prices
European natural gas dipped the last week of October after Russian officials commented that more natural gas would ship in November (Chart 5). Futures reversed course by the end of November and rose to nearly $35 by mid-December. German regulators denied approval to turn on the Nord Stream 2 pipeline, Russia/Ukraine tensions added geopolitical risk to expected pipeline flows, and forecasts for cooler weather all contributed to the increase. The rise helped to boost liquefied natural gas (LNG) prices. The Japan–Korea benchmark rose to over $35 by mid-December.
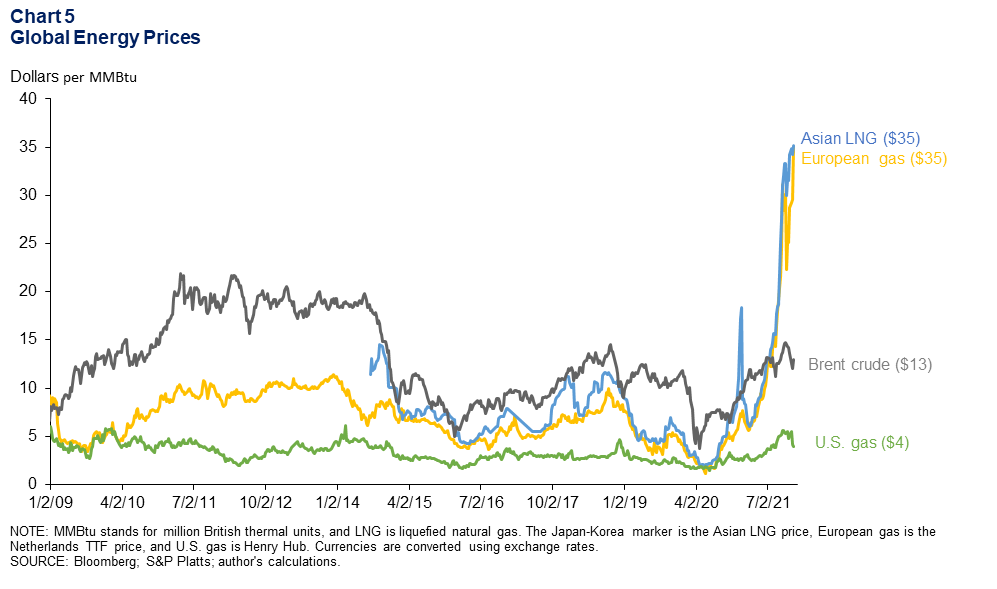
By comparison, the run-up in U.S. natural gas has been mild. Henry Hub was $5.45 per MMBtu the last week of November. It has since slipped under $4 but is still well above prepandemic levels. To put that in perspective, Brent crude was $12 per MMBtu, and the equivalent retail price of a gallon of regular gasoline in the U.S. (10 percent ethanol content) was $28 per MMBtu ($3.38 per gallon).
Global oil consumption outlook
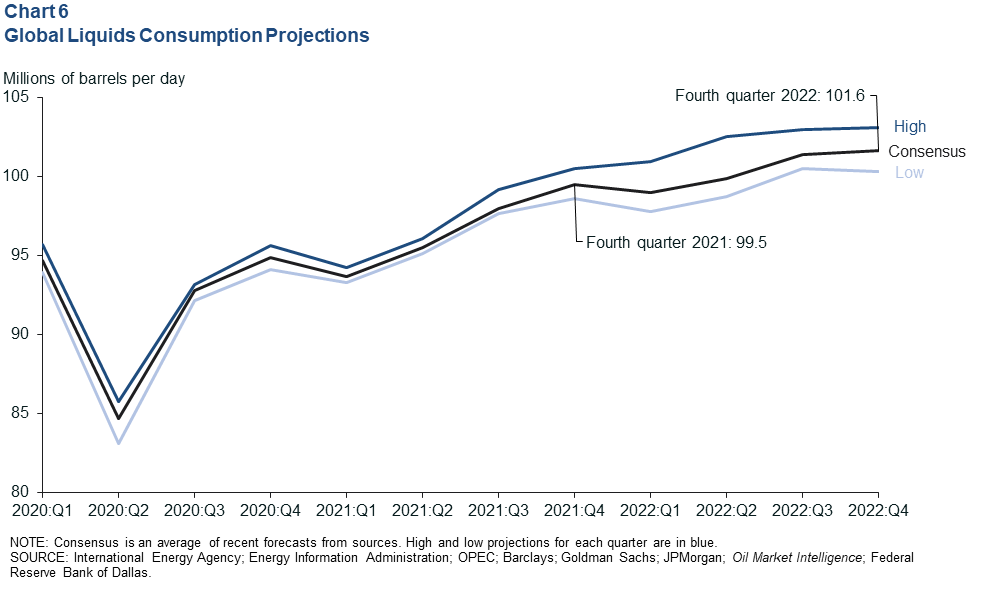
A consensus of several projections from major agencies, financial institutions and consultancies implies that the world is consuming an average of 99.5 mb/d in fourth quarter 2021 and will increase that amount to 101.6 mb/d by the end of 2022 (Chart 6). Many projections for the first half of 2022 have softened due to concerns that another winter surge of COVID-19 infections may slow the recovery of energy, particularly in the first quarter.
While demand for gasoline, diesel, bunker fuel and other products has made a substantial recovery and is projected to grow further next year—distillate consumption, particularly jet fuel, is still expected to grow more quickly, assuming pandemic restrictions on international travel ease.
About Energy Indicators
Questions can be addressed to Jesse Thompson at jesse.thompson@dal.frb.org. Energy Indicators is released monthly and can be received by signing up for an email alert. For additional energy-related research, please visit the Dallas Fed’s energy home page.