Energy Indicators

April 28, 2022
Refinery utilization is rising as the spring maintenance season comes to an end amid rising measures of profitability and low product inventories. Strong global consumption (despite high prices) and the dislocation of supplies due to the war in Europe are also contributing to rising exports, particularly diesel.
Refining
Refinery crude runs near pandemic high
Refineries on the U.S. Gulf Coast processed nearly 8.7 million barrels per day (mb/d) over the four weeks ending April 15—the strongest April since 2018 and just shy of the seasonal high mark in summer 2021 (Chart 1). The volume of crude processed in the rest of the U.S. was 7.1 mb/d and has been trending down for several months. The difference is due in part to declines in the amount of operable capacity.
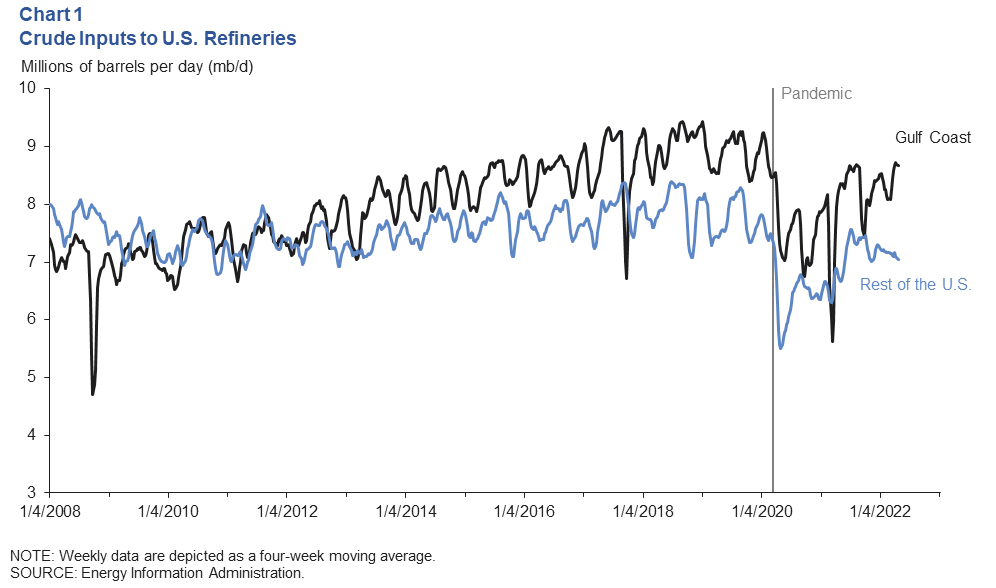
Looking at monthly data, the Gulf Coast entered 2022 with roughly 9.6 mb/d of operable capacity compared with 9.9 mb/d at the start of January 2021 and January 2020. By comparison, operable capacity in the rest of the U.S. fell by twice as much from 8.9 mb/d in January 2020 to 8.3 mb/d in January 2022. The declines came as several older and noneconomic facilities were converted to biofuel plants or were retired.
Altogether, U.S. refiners processed nearly 15.8 mb/d over the four weeks ending April 22. That is a utilization rate of nearly 91 percent. Adjusting for normal seasonal variation, that would be a 94 percent rate—the highest since September 2018.
Distillate inventories very tight compared with gasoline
There were 28.8 days of cover for distillate (the number of days domestic inventories would likely last at the recent pace of consumption) at the end of March—7.3 days below the five-year average level (Chart 2). However, those days of cover need to be put into perspective. In April 2022, U.S. stocks of distillate (mostly diesel fuel) were at their lowest level since mid-May 2008.
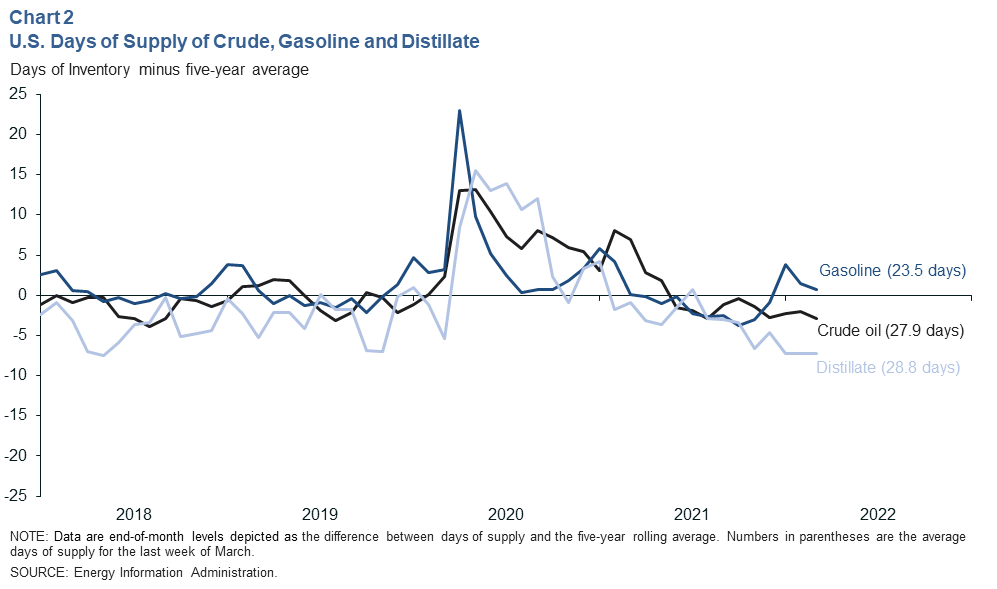
Domestic commercial crude oil inventories were also tight at 27.9 days of cover, though this is partly due to releases of oil from the strategic petroleum reserve (SPR). Controlling for that release, total U.S. crude oil stocks (including the SPR) are at their lowest levels since January 2008.
Gasoline days of cover was firmer at 23.5 at the end of March.While levels of gasoline stocks are not near 14-year lows like for crude and distillate, they are still tight for this time of year.
The rollout of more expensive summer fuel blends in May, tight inventories, rising demand for jet fuel and higher summer seasonal motor fuel consumption ahead are likely to keep some upward pressure on retail fuel prices. The most recent data for domestic consumption (product supplied) indicates that the volumes of gasoline consumed in the U.S. have slowed slightly in the face of recent price increases. The same cannot be said for most other sectors like jet fuel, propane and residual fuel oil, which have seen no discernable deviation from normal seasonal trends.
Weekly data for distillate fuel oil—mostly diesel—have seen the sharpest price increases, and it is the only segment that has shown significant counter-seasonal slowing in consumption the past two months. However, weekly consumption estimates are subject to more error. Monthly data (which come with a lag) revealed consumption in January 2022 to be much weaker than the weekly series initially suggested.
Refining margins touch multiyear highs particularly on U.S. Gulf Coast
Rising prices, resilient demand and tight product inventories have led to much a higher refining crack spread—proxies for refiner margins based on the local futures price difference between a type of crude oil and the mix of gasoline and diesel that would likely be produced from it. The Gulf Coast 3:2:1 crack spread based on West Texas Intermediate (WTI) crude averaged $33 per barrel the four weeks ending April 15—its highest reading since September 2008 (Chart 3). The Brent crude 3:2:1 crack spread in New York was $28—its highest reading in over 18 years.
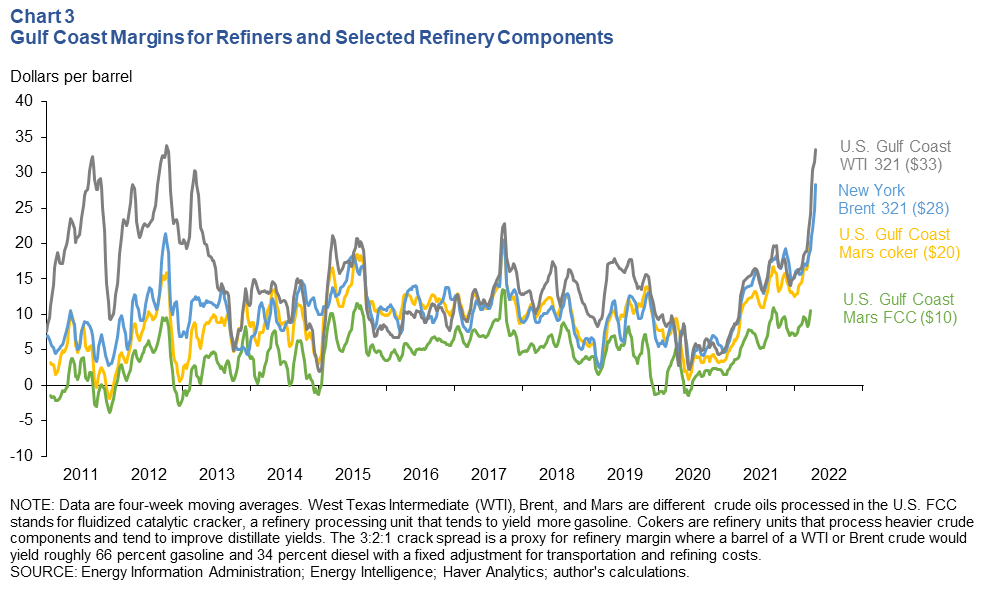
The relatively tight distillate market (diesel) when compared with gasoline is partly reflected in the implied margins for refinery components that tend to yield relatively more or less of those fuels. Cokers are units that break down the complex and heavier components of a barrel of oil and tend to improve distillate yields. Implied margins for cokers based on U.S. Gulf Coast Mars crude were substantially higher than margins for fluidized catalytic cracking (FCC) units. FCCs are typically geared to yield more gasoline.
It should be noted that crack spreads do not reflect actual refiner profits, but they are indicative of incentives to increase utilization in the short run. With refiner cracks near record levels, utilization rates in the U.S. are likely to rise. This is especially true considering the considerable domestic cost advantage afforded U.S. refiners by $5–$7 natural gas—used for heat, electricity and hydrogen—compared with over $30 gas at European hubs or Asian liquefied natural gas markets.
Exports
The U.S. exported 8.7 mb/d of crude oil and petroleum products (seasonally adjusted) in March, a sharp increase from February (Chart 4). This put total exports up 23 percent from a year prior but still 2.6 percent below prepandemic levels with considerable variation across major product groups.
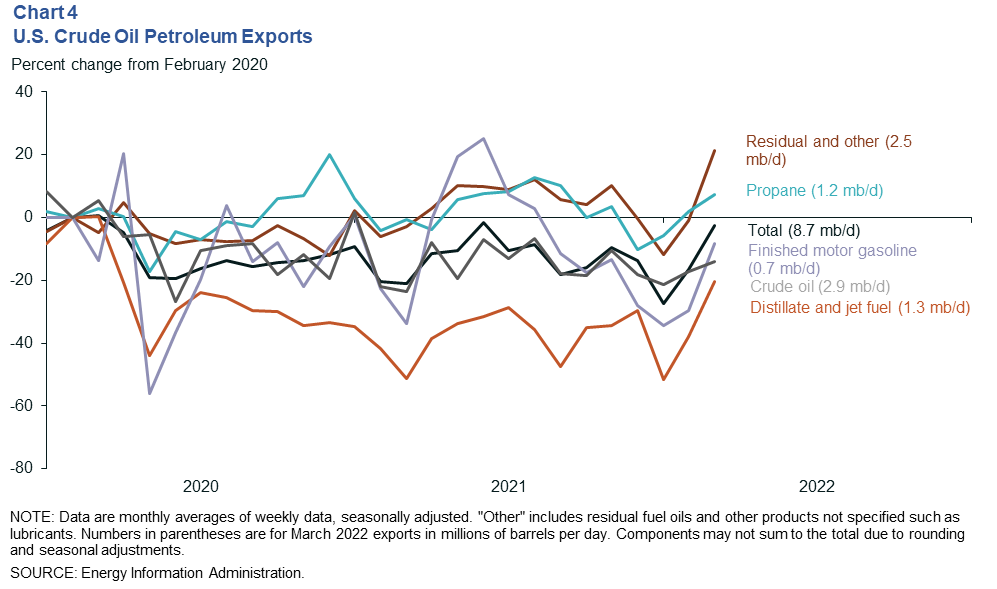
Distillate and jet fuel (mainly diesel) exports rose to 1.3 mb/d in March, increasing 56.7 percent from February. This increase is more than any other group of product exports, driven in part by self-sanctioning among many importers of Russian products, rising demand in Latin America and expectations of strong summer consumption.
Patterns similar to diesel were apparent for motor gasoline and “residual and other” exports, which rose to 0.7 mb/d and 2.5 mb/d, respectively, in March. “Residual and other” has seen the largest growth over the pandemic, rising over 21 percent since February. This group consists of a mix of products such as bunker fuels for shipping, blending components for fuels, petrochemical feedstocks and lubricants.
About Energy Indicators
Questions can be addressed to Jesse Thompson at jesse.thompson@dal.frb.org. Energy Indicators is released monthly and can be received by signing up for an email alert. For additional energy-related research, please visit the Dallas Fed’s energy home page.