Energy Indicators

August 2, 2022
Russia increasingly restricting natural gas supplies to Europe over the past year has pushed natural gas prices to stratospheric levels in Europe. The hunt for substitutes amid widespread heat waves is pulling many other energy prices up with it. In response to higher prices, gas-directed drilling in the U.S. is increasing and its natural gas exports are running at full capacity. New liquefied natural gas (LNG) export capacity in the U.S. is set to potentially double over the next few years, outpacing the growth rate of domestic supplies through at least 2023.
European natural gas crisis
Supplies of Russian natural gas to Europe severely curtailed
Despite rising prices, Russia elected in spring 2021 not to sell substantial volumes of natural gas beyond contractual obligations, and from late summer on, flows of natural gas from Russia became less stable and declined. Prices of natural gas spiked after the invasion of Ukraine in February 2022, and pipeline flows increased. However, supplies of natural gas on the Nord Stream 1 (NS1) line to Germany fell to 40 percent of its capacity in June 2022. That lowered total Russian exports to the European Union through its three main natural gas arteries to nearly 106 million cubic meters per day (mcm/d) between June 15 and July 9—22 percent of the levels seen during the same period in 2019 (Chart 1).
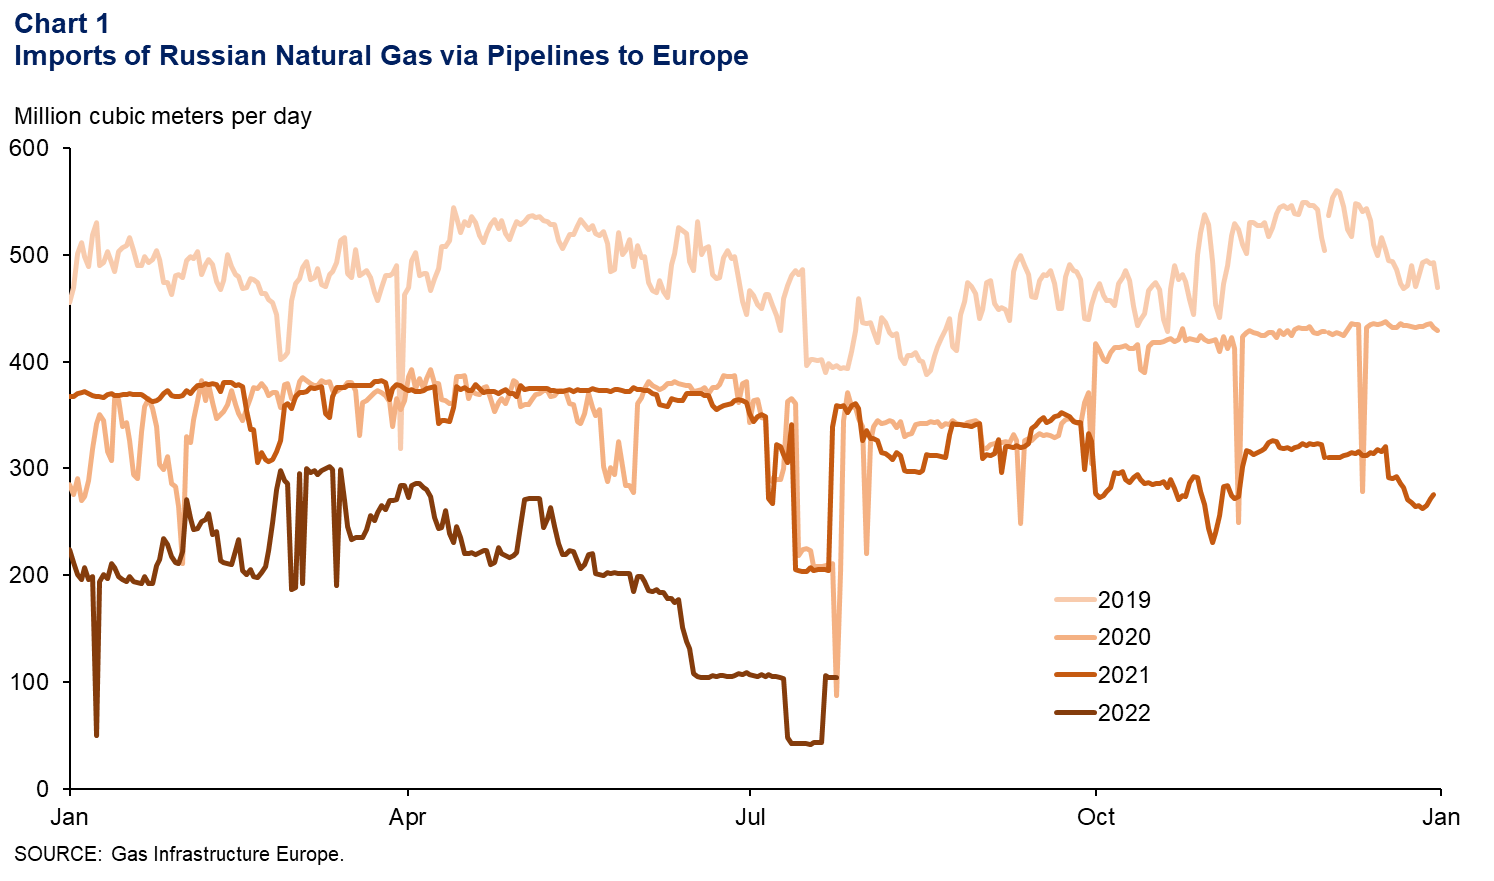
European natural gas inflows from Russia fell further to 43 mcm/d during seasonal maintenance on NS1 in July 2022. The pipeline briefly returned to premaintenance levels of operation, but another pumping station is now allegedly down for unscheduled maintenance, again lowering pipeline flow. The willingness of Russia to continue to sell natural gas to Europe remains uncertain.
Weaponization of gas sales leaves European inventories tight
Rising LNG imports, lower consumption due to high prices, and conservation efforts helped European gas inventories make progress toward the target of 80 percent full by the winter heating season. Total inventories reached 76 billion cubic meters (bcm) by July 24, or 67 percent full (Chart 2). Germany, a critical industrial center with over a fifth of total European inventories, was also over two-thirds full.
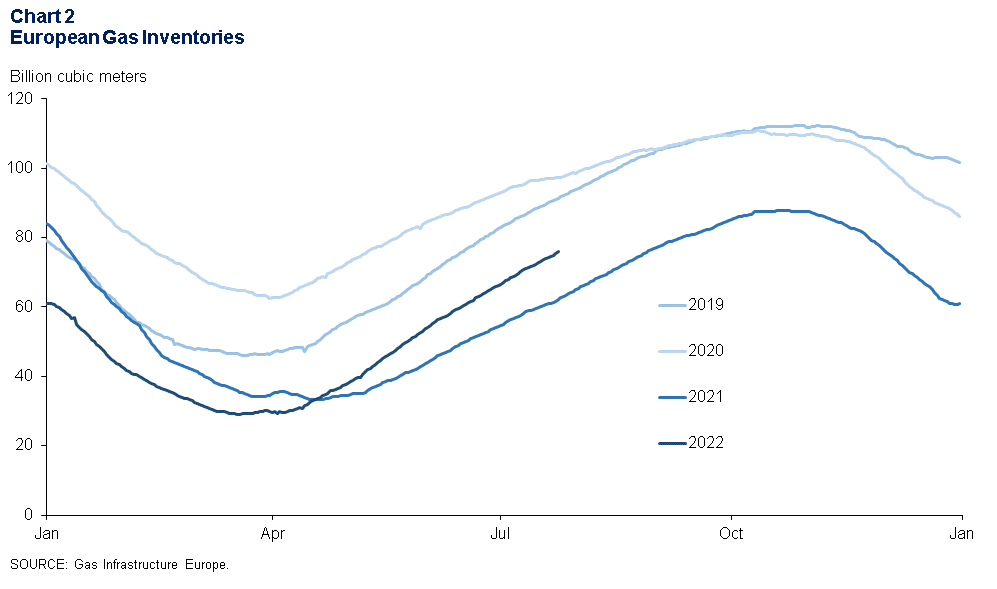
However, a severe heat wave in Europe, lower hydroelectric power output due to drought, and bottlenecks restricting the movement of coal (and fuel) barges on the Rhine River are boosting gas consumption as Russia tightens supplies.
Additionally, as many as 29 of 51 nuclear reactors in France have had to either shut down or operate at reduced rates in June and July. This forced France to import electricity from Spain and the U.K, where natural gas accounts for a much larger share of the generation capacity. The outages were attributed to heavy maintenance, repairs, and overheating due to low (and warm) river water levels.
Natural gas crisis Is supporting prices of available substitutes
The challenging supply-and-demand situation for natural gas in Europe, as well as uncertainty in the outlook, pushed European benchmark gas to $48 per million British thermal units (MMBtu) during the week ending July 22, 2022 (Chart 3). LNG prices in Asia ($39)—as well as Australian ($47) and European coal ($40) prices—have been bid up as Europe hunts for substitute energy supplies. U.S. barge coal rose to $20 per MMBtu.
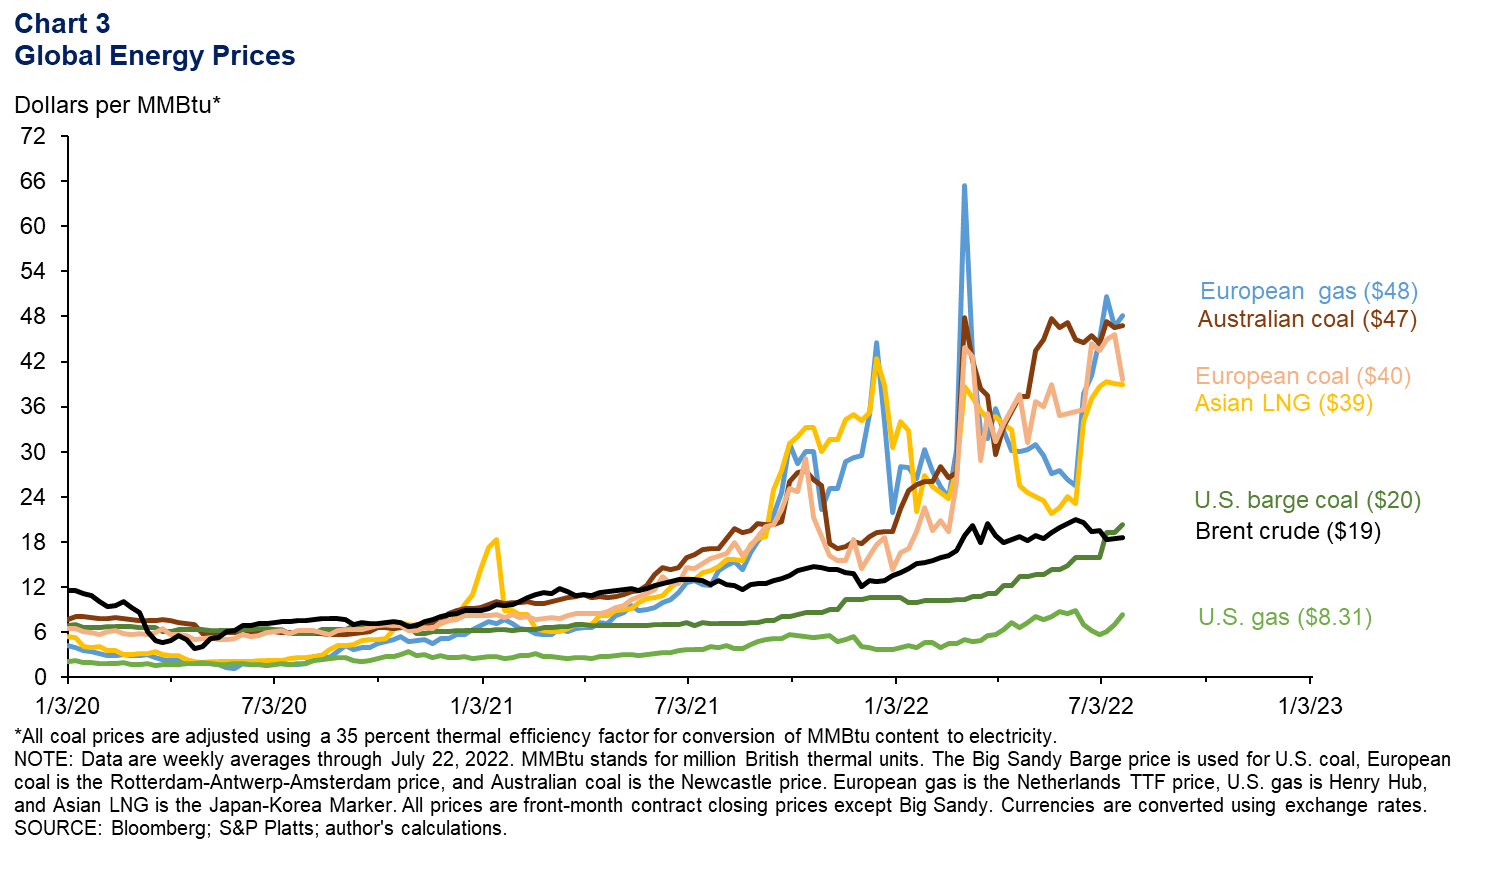
To put those prices in perspective, $48 gas would be equivalent to $278 per barrel of Brent crude.
U.S. natural gas prices have been rising as well. Limited supply growth the past two years, an increasingly strong pull from the LNG market, and healthy domestic demand helped U.S. benchmark gas (Henry Hub) rise to nearly $10 in early June 2022. However, a fire at the Freeport LNG facility in Texas shut down nearly 2 billion cubic feet per day (bcf/d) of export capacity, stranding some supplies in the U.S. and pushing domestic prices down. Heat, drought and rising LNG prices have since pulled the price of U.S. natural gas back up to $8.31 per MMBtu the week of July 22.
U.S. natural gas
Gas-directed drilling is rising
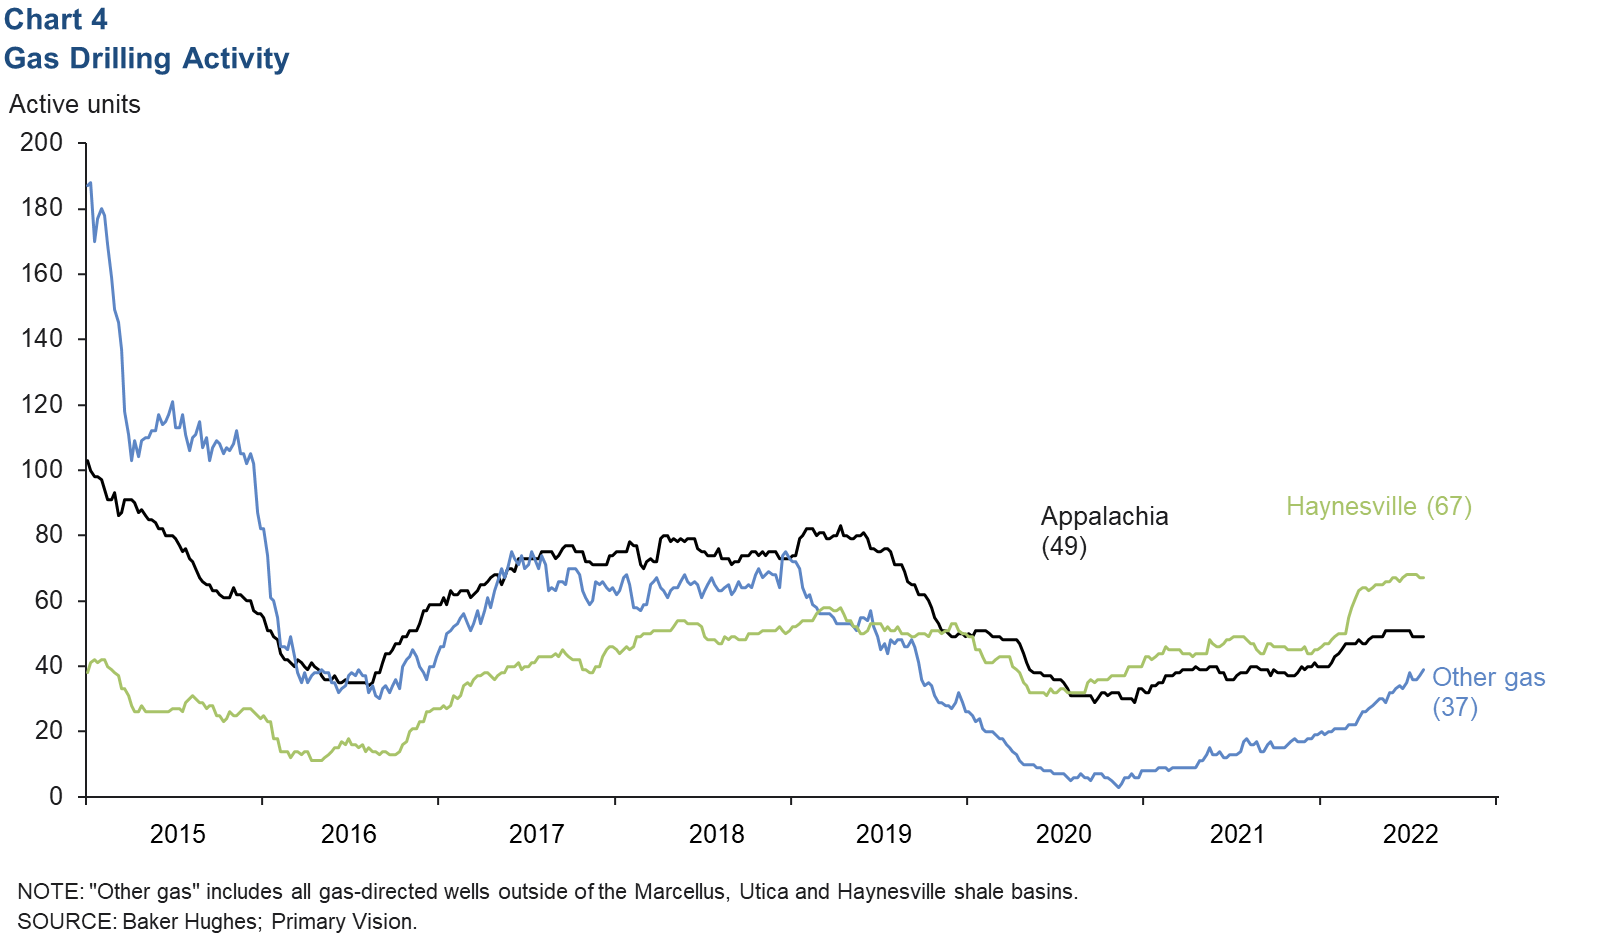
The rise of natural gas from the prepandemic outlook of “$3 forever” to $9 this summer—as well as high prices for the co-produced gas-plant liquids ethane, propane and butane—has helped to reinvigorate gas-drilling activity. The Haynesville Shale, with its proximity to Gulf Coast industrial, refining and export capacity, led the major shale-gas basins at 67 active rigs the week ending July 22 (Chart 4). Drilling in the pipeline-constrained Appalachian region (mainly the Marcellus and Utica shales) has been steady near 50 rigs since early April. The rest of the U.S. saw drilling rise from three active rigs the week of Oct. 30, 2020, to 37 rigs in July.
U.S. LNG exports projected to climb through December 2023
The gas-directed drilling recovery and rising associated gas production from oil wells are projected to drive up U.S. gas supplies by 5.8 bcf/d to 110 bcf/d from June 2022 to December 2023—an increase of 5.6 percent. Natural gas exports are projected to rise by 3.8 bcf/d as new pipeline and LNG export capacity comes online—a 20.2 percent growth rate. If these projections from the Energy Information Administration’s July Short Term Energy Outlook are realized, the faster growth rate of exports through 2023 will mean the export share of U.S. supplies will rise from 18 percent in June 2022 to 20.5 percent in December 2023 (Chart 5).
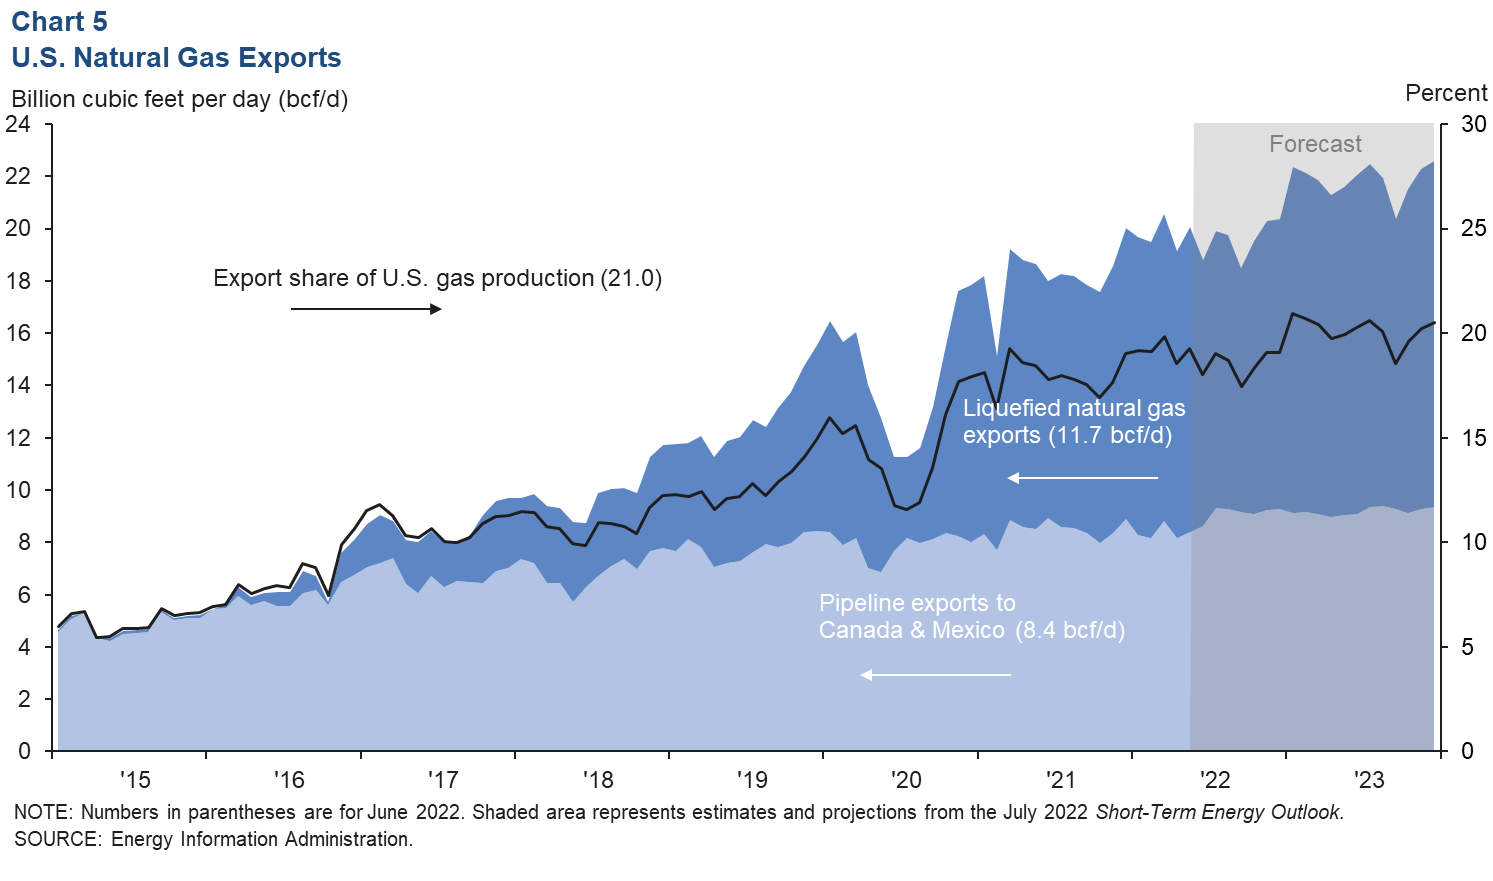
As of the June 2022 LNG liquefaction capacity report, peak-nameplate capacity for LNG exports in the U.S. was 13 bcf/d. Another 4.9 bcf/d of capacity was either preparing for startup or under construction and expected to come online by the end of 2024.
Approved new LNG projects expected to reach final investment decision (FID) by the end of 2023 total 16.5 bcf/d. Another 8.8 bcf/d of approved projects are in various stages of development, with no expected FID date. Even if only one-fifth of this proposed capacity is ultimately commissioned by the end of 2026, the roughly 5 bcf/d of capacity and the 4.9 bcf/d already under construction represent a near doubling of current U.S. LNG export capacity.
Natural gas pipelines to Mexico are also likely to expand, including the 2.6 bcf/d Sur de Texas project connecting South Texas to Veracruz, Mexico.
About Energy Indicators
Questions can be addressed to Jesse Thompson at jesse.thompson@dal.frb.org. Energy Indicators is released monthly and can be received by signing up for an email alert. For additional energy-related research, please visit the Dallas Fed’s energy home page.