Energy Indicators

Oil prices were affected little by Saudi Arabia’s decision to cut 1 million barrels a day (mb/d) in July. Crude and other liquids inventories in developed nations have been declining over the past year but are expected to rise through the end of 2024. Both the Texas and national electricity grids are relying more on renewable sources, with Texas a national leader in both wind and solar.
OPEC+
Saudi Arabia to cut crude production in July 2023
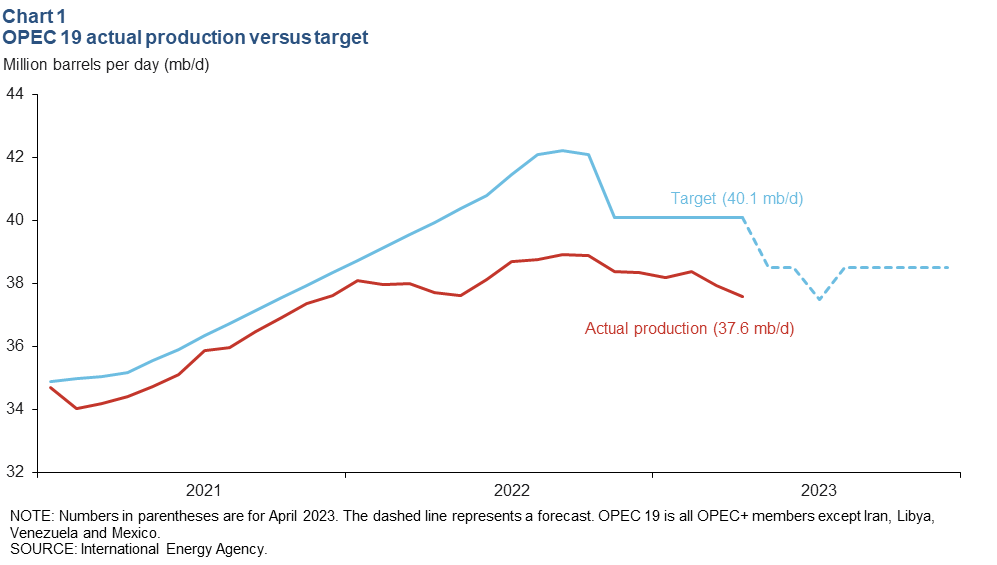
OPEC+ fell short of its target (40.1 mb/d) by 2.5 mb/d in April 2023—the largest shortfall since October 2022. That output represented a slight decline from March (Chart 1). Most of the decrease came from Nigeria and Iraq, whose output together shrank 0.5 mb/d due to unplanned outages in Nigeria and pipeline disputes in the Iraqi Kurdistan region. Their decline was partially offset by several countries, including Angola and Saudi Arabia, which added 0.09 mb/d and 0.05 mb/d, respectively.
During OPEC+’s June 4 meeting, Saudi Arabia indicated it would unilaterally cut 1 mb/d of production in July. The cut comes on the heels of announcing a lower target (38.5 mb/d) for May 2023 through the end of the year. OPEC+ members may or may not fully comply with their new production quotas, but Saudi Arabia is expected to follow through with its 1 mb/d cut.
Little movement in prices after OPEC+ meeting
Front-month futures contracts for West Texas Intermediate (WTI) and Brent crudes increased only 0.6 percent and 0.2 percent, respectively, from the Friday before to the Monday after OPEC+’s meeting on Sunday, June 4 (Chart 2). For comparison, when OPEC+ announced in April that it would reduce its production target by 1.7 mb/d, front-month futures contracts for WTI jumped roughly 8 percent.
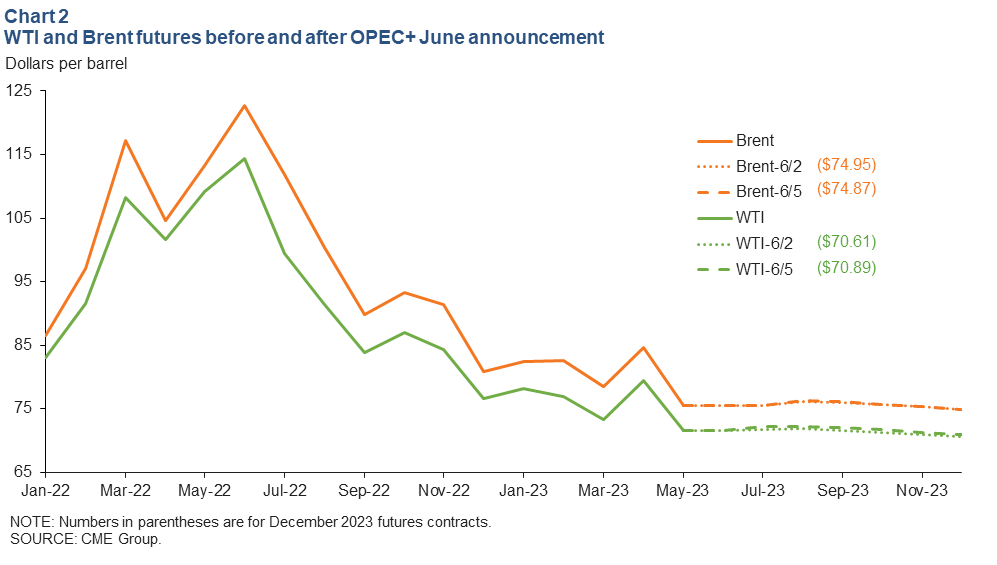
The increase in prices this time may have been muted for a number of reasons: sluggish demand growth in China, strong non-OPEC supply, fears of an economic slowdown in the U.S. and Europe and the brevity of Saudi Arabia’s promised cut. In any case, many traders had likely baked in some kind of cut at their June ministerial meeting, whereas many in the energy sector were caught off-guard by the previous cut. Five days after OPEC+’s June 4 decision, WTI closed at $68 a barrel and Brent at $73 a barrel.
OECD inventories
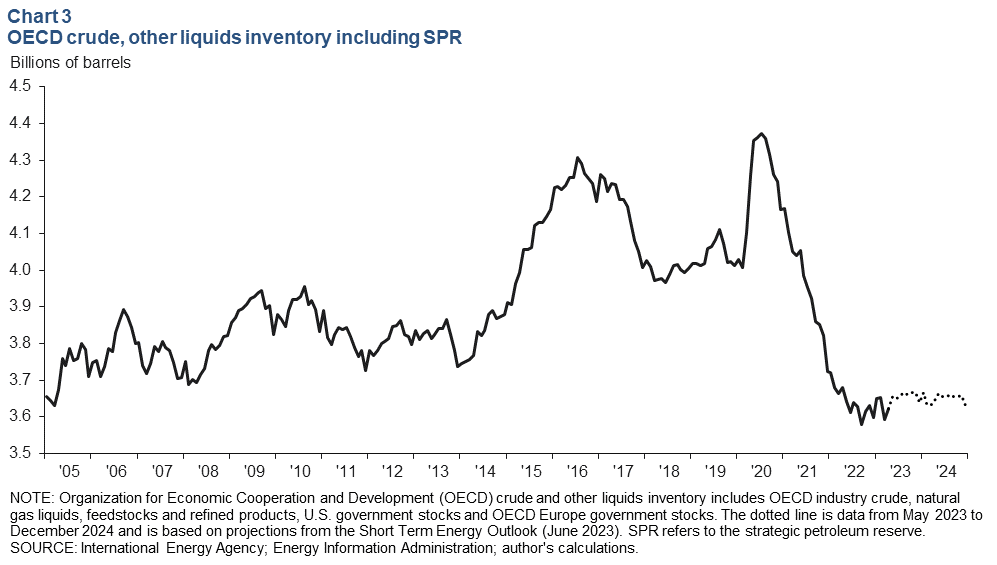
Petroleum inventories have slightly increased since the start of the year. Total stocks of crude and other liquids, including strategic petroleum reserves (SPR), hit 3.6 billion barrels in April 2023 in Organization for Economic Cooperation and Development (OECD) countries (Chart 3). OECD crude oil inventory levels are projected to rise slightly through 2024 based on June 2023 projections from the Energy Information Administration (EIA). That does not include any announced or expected purchases to replenish the U.S. SPR.
Electricity
Price of natural gas eases while electricity prices tick up
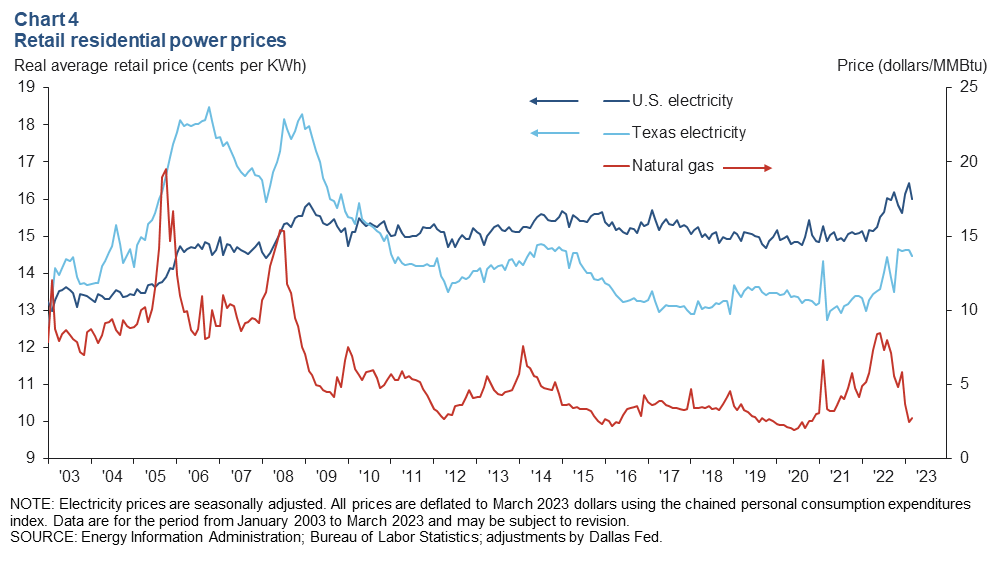
Texas has enjoyed lower real retail residential power prices than the rest of the U.S. since 2010 (Chart 4). Lower prices in Texas are due mainly to low-cost shale gas—the marginal fuel for generation. The rising share of low-cost wind and solar power in the state is also likely keeping prices down.
The cost of natural gas has fallen dramatically since August 2022, but prices paid for generation have been slower to follow suit. This is partly due to the lag time required for power contracts to turn over every year, but also due to rising fees. The EIA projects U.S. electricity bills this summer will be 2 percent higher than last year.
Renewables driving Texas power growth
The terawatt hours (TWh) of net generation from wind rose from 53 TWh in 2016 to 107 in 2022 (Chart 5). Coupled with solar, the two renewable sources provided 31 percent of electricity in Texas last year, up from 0.7 percent in 2002. Wind drives 11 percent of U.S. generation, compared with 25 percent in Texas.
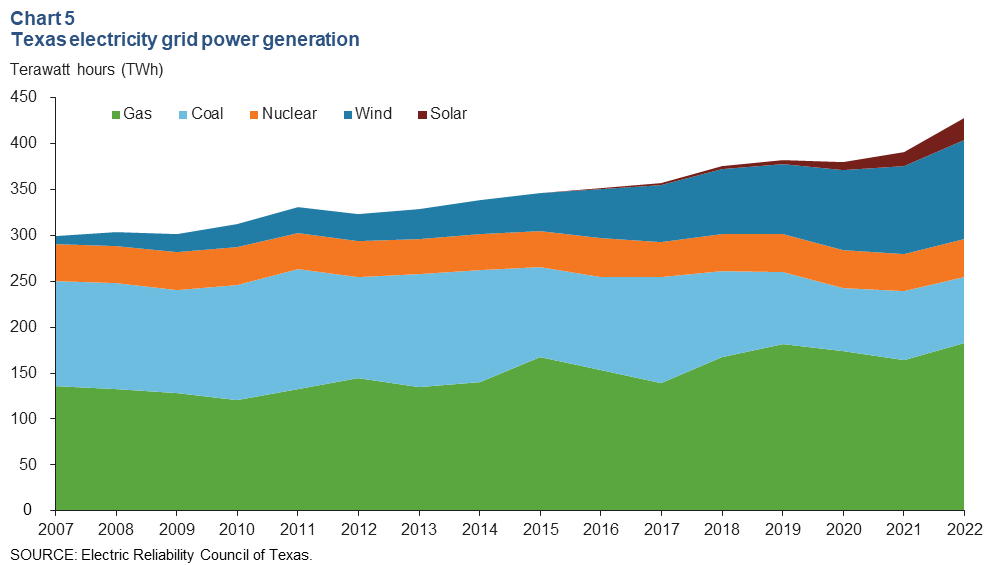
ERCOT, the Electric Reliability Council of Texas, is forecasting record high demand this summer that could prompt rolling brownouts or blackouts during peak electricity consumption periods. The projections are complicated by the variability of wind and solar, which may or may not be able to supplement the elevated load demand.
Net generation up; coal use continues to decline
U.S. net power generation rose from 4,163 TWh in 2021 to 4,248 TWh in 2022 (Chart 6). Generation from nuclear plants has been hovering around 790 TWh since 2019, while generation from solar rose from 107 in 2019 to 204 TWh in 2022.
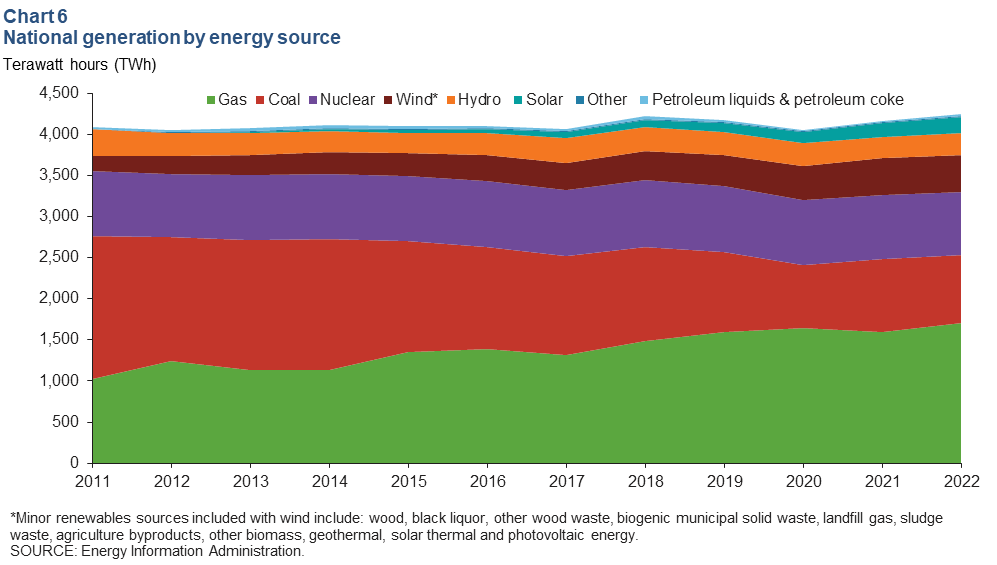
Natural gas continued to displace coal as the primary source of dispatchable thermal generation. Natural gas made up 25 percent of generation in 2011, and coal made up 42 percent. Today, their market shares have reversed. In 2022, natural gas was up to 40 percent and coal was down to 19 percent.
About Energy Indicators
Questions can be addressed to Kenya Schott at kenya.schott@dal.frb.org. Energy Indicators is released monthly and can be received by signing up for an email alert. For additional energy-related research, please visit the Dallas Fed’s energy home page.