Energy Indicators

Gasoline and diesel prices have come down since the end of summer, with gasoline prices seeing a stronger decline. A drop in gasoline consumption contributed to bloated gasoline inventories, while consumption of diesel is still relatively healthy, contributing to higher refining margins for the heavier product. Overall, crude inputs into refineries are down.
Consumption
Gasoline and diesel prices ease
Retail diesel and gasoline prices have fallen in recent weeks. On-highway diesel fell to $4.37 per gallon the week of Nov. 6, down 4.9 percent since the start of October (Chart 1). Regular gasoline fell to $3.25 per gallon for the same week, down 9.8 percent.
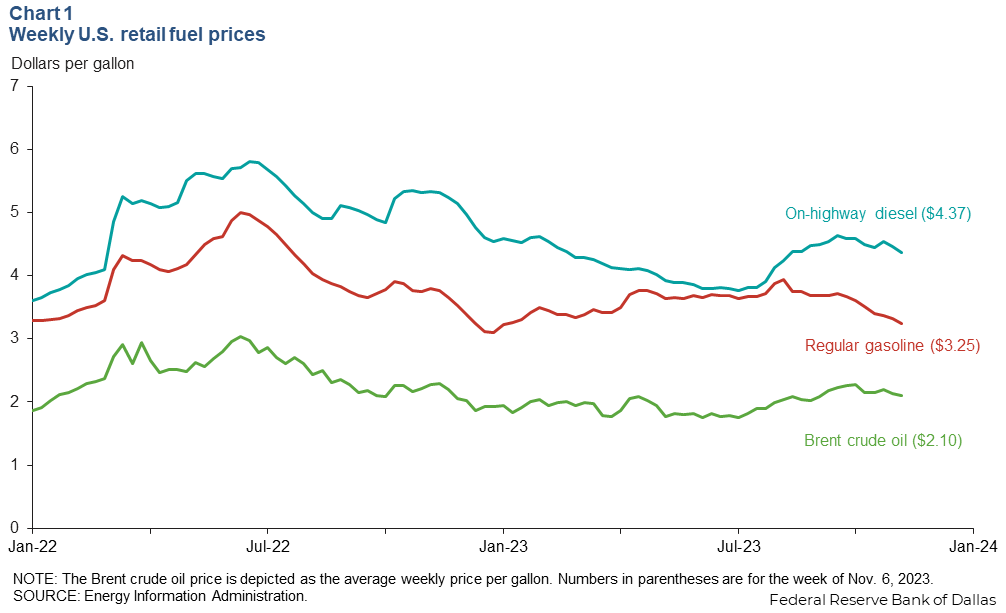
The decline in gasoline prices is due in part to a sharper-than-normal decline in fall consumption and a switch to the less-expensive winter blend. Other factors, like the fall in crude oil pricing and a decline in the cost of complying with renewable fuel mandates also contributed. Seasonally normal easing of retail prices between Thanksgiving and Christmas is widely expected.
U.S. motor gasoline consumption relatively low
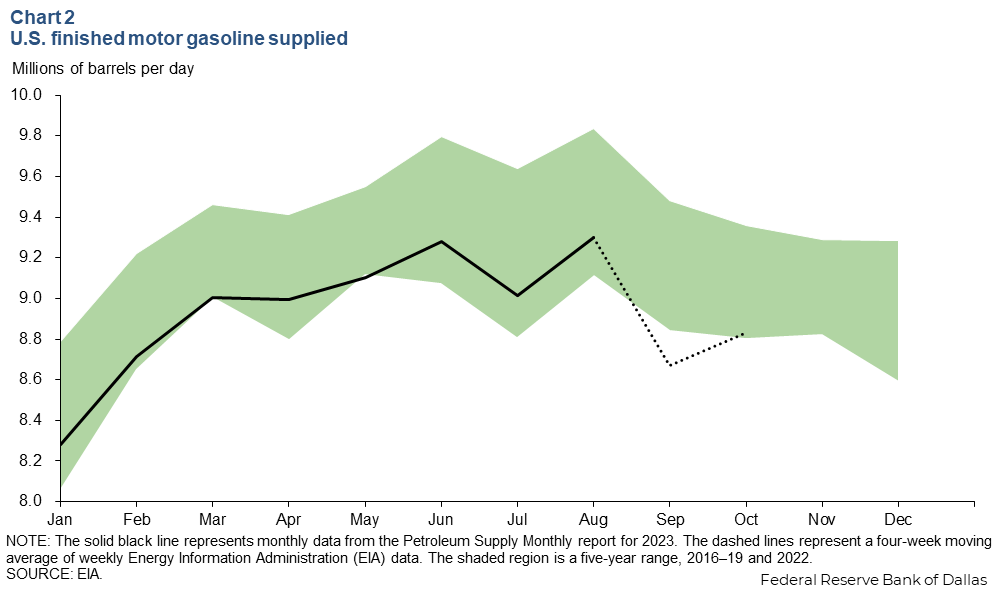
So far in 2023, the monthly product supplied—a proxy for consumption—of finished motor gasoline in the U.S. has stayed near the lower bound of the five-year range (excluding the pandemic). This in part reflects lower postpandemic consumption due to work-from-home arrangements. In August, 9.3 million barrels per day (mb/d) were supplied—0.3 mb/d below the five-year average for that month (Chart 2). Since that time, weekly estimates for consumption imply that motor gasoline supplied dropped by 0.6 mb/d to 8.7 mb/d in September.
Distillate sees healthier consumption than gasoline
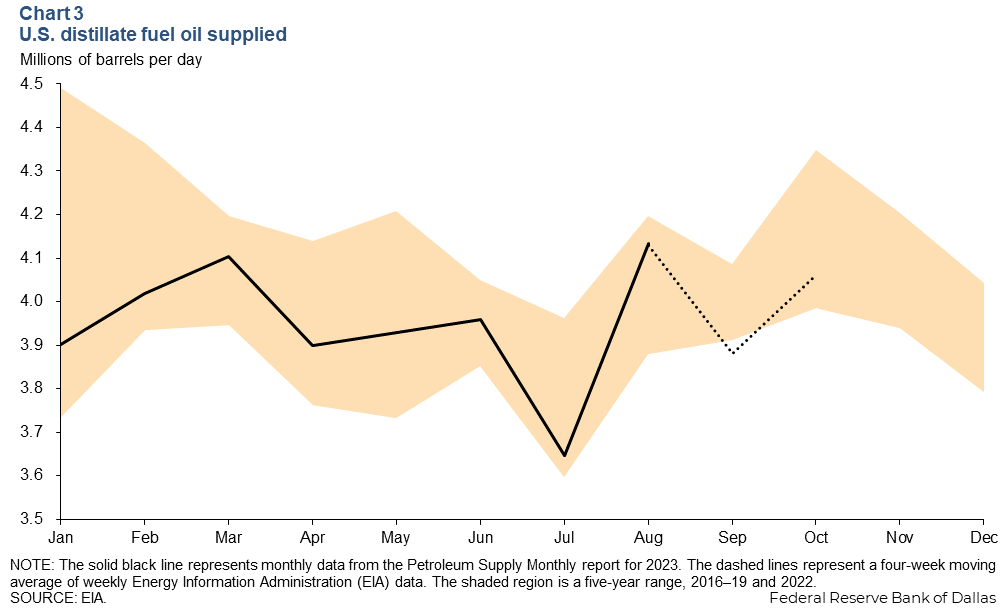
The U.S. has recently seen healthy distillate consumption. There were 4.1 mb/d of distillate supplied for the month of August—0.12 mb/d above the five-year average (excluding the pandemic) and 0.2 mb/d above the year-ago level (Chart 3). The August 2023 level of domestic distillate consumption was the highest it had been since March 2022. However, that consumption fell 6 percent from August to September before increasing again by 5 percent in October, largely following seasonal trends.
Inventories
There were 28.7 days of cover (the number of days domestic inventories would likely last at the recent pace of consumption) for distillate at the end of October. That is 3.5 days below the five-year average (excluding the pandemic) for that month (Chart 4). Crude oil days of cover were closer to being on par with the five-year average at 27.2. Gasoline inventories are somewhat inflated due to a slowdown in consumption. Days’ supply of motor gasoline is roughly two days above its five-year average—the highest level since the pandemic.
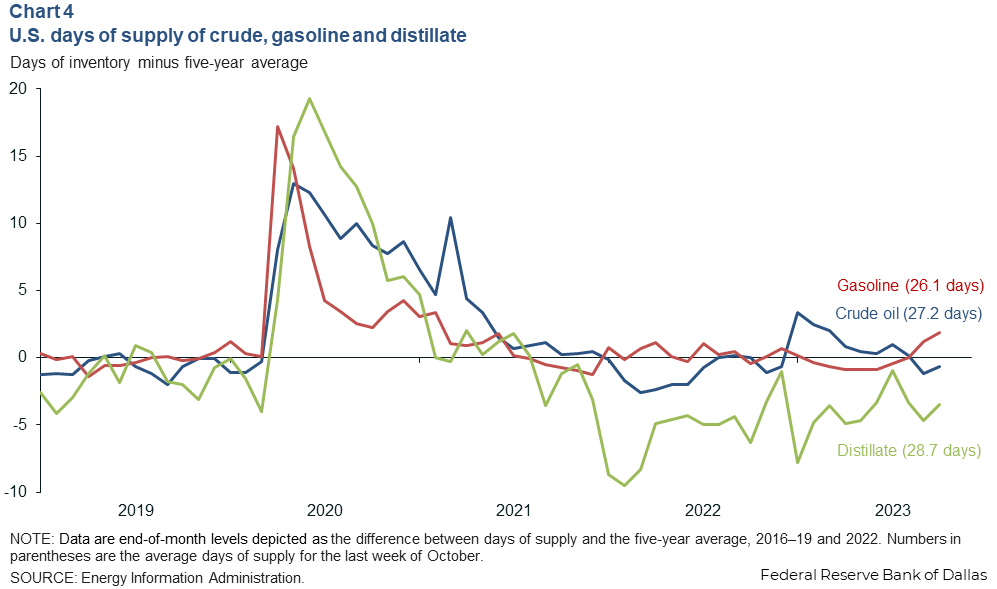
In contrast, while days of cover ticked up relative to the five-year average in October, the level of days of inventory was at its lowest level since May. Overall, the volume of distillate inventories in October and early November was near 10-year lows. Russia’s short-lived ban on diesel exports along with preexisting western sanctions on Russian fuels and a slew of unplanned refinery outages have kept distillate supplies relatively tight. From September to October, the number of days of cover fell by 2.7.
Refining
Volume of crude oil processed by refiners trending down
Refineries on the U.S. Gulf Coast processed 8.4 mb/d of crude oil over the four weeks ending Oct. 27 after climbing earlier this summer following seasonal trends and high refining margins. The rest of the U.S. processed 7.0 mb/d over the four-week period ending in October (Chart 5).
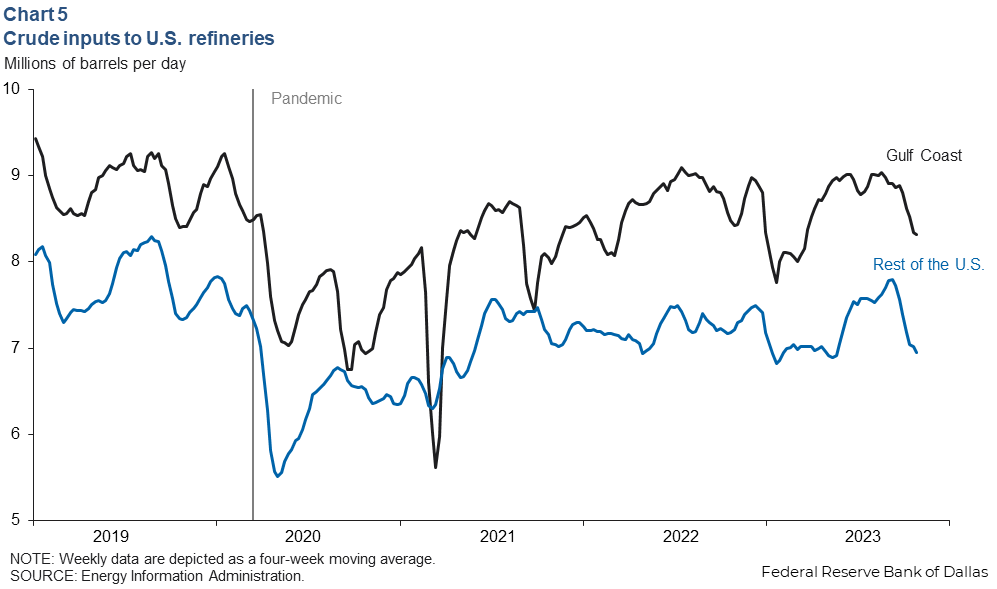
That puts the U.S. refinery utilization rate down to 85.7 percent for the week ending Oct. 27. The rate for the U.S. Gulf Coast is slightly higher at 86.6 percent for the same week. The declines since the beginning of September are owed in part to regular seasonal maintenance as well as a sharp drop in crack spreads—a proxy for refining margins.
Refining margins experience steep drop
The 3:2:1 spread—a rough proxy for how much refiners would net by processing a barrel of crude oil into gasoline and diesel fuels—fell about 40 percent from the beginning of September through the end of October for Brent and West Texas Intermediate crudes.
By this measure, margins are now also roughly 40 percent below their levels in fall 2022 but remain above the five-year average during 2016–19 and 2022 (Chart 6). Part of the decline in spreads stems from weakening demand, a reversal of the huge disruption to refining markets following Russia’s invasion of Ukraine, and the aforementioned unplanned outages over the summer when consumption proved stronger than many had expected.
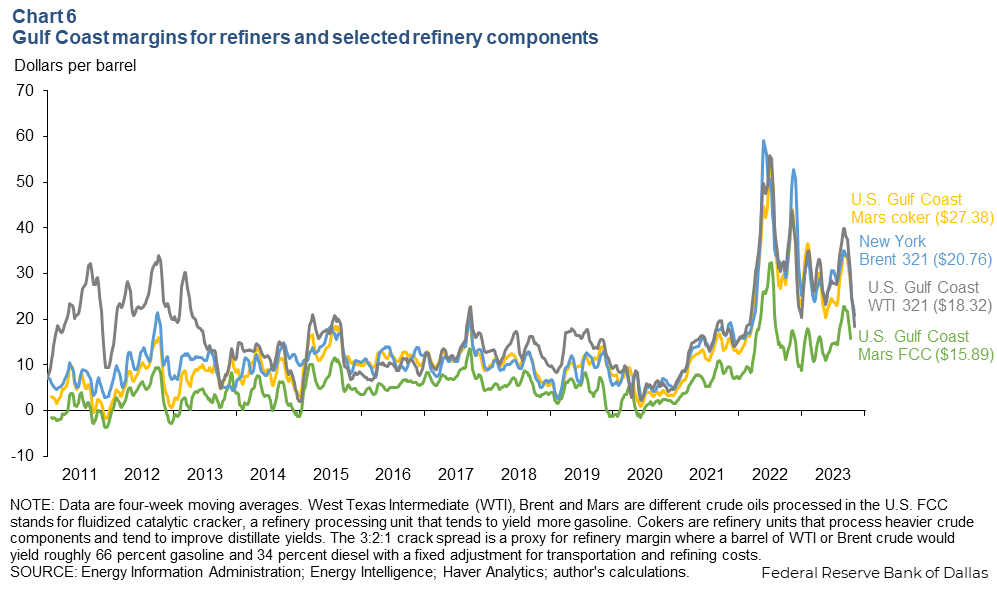
The Gulf Coast FCC spread (the implied margins for fluidized catalytic converters—refinery components that are geared to produce mostly gasoline) fell by 30 percent from early September through the end of October. Spreads on cokers—refinery components that tend to yield more distillates—fell only 22 percent in comparison. The difference is partly due to the sharper decline in gasoline consumption versus distillates over that time frame, which is a factor contributing to lower utilization rates.
About Energy Indicators
Questions can be addressed to Kenya Schott at kenya.schott@dal.frb.org. Energy Indicators is released monthly and can be received by signing up for an email alert. For additional energy-related research, please visit the Dallas Fed’s energy home page.