Energy Indicators

U.S. exports of liquefied natural gas (LNG) are expected to continue to grow into 2024. Global natural gas and heating oil prices are subdued as the winter outlook has moderated, while propane prices are increasing but remain significantly below last year’s levels. Residential power prices continue to be lower in Texas compared with the national average, and ERCOT projects stable grid conditions this winter, but the risks from winter storms remain elevated.
Natural gas
LNG exports expected to grow
The Energy Information Administration (EIA) expected U.S. natural gas production to be relatively flat from October until the end of 2023. LNG exports were 12.3 billion cubic feet per day (bcf/d) in October, and pipeline exports were 9.3 bcf/d. According to the EIA’s projections, the export share of U.S. supplies will rise from 20.9 percent in October 2023 to 22.4 percent in December 2024 (Chart 1). As of the EIA’s October LNG liquefaction capacity report, peak nameplate capacity for LNG exports in the U.S. was 13.8 bcf/d.
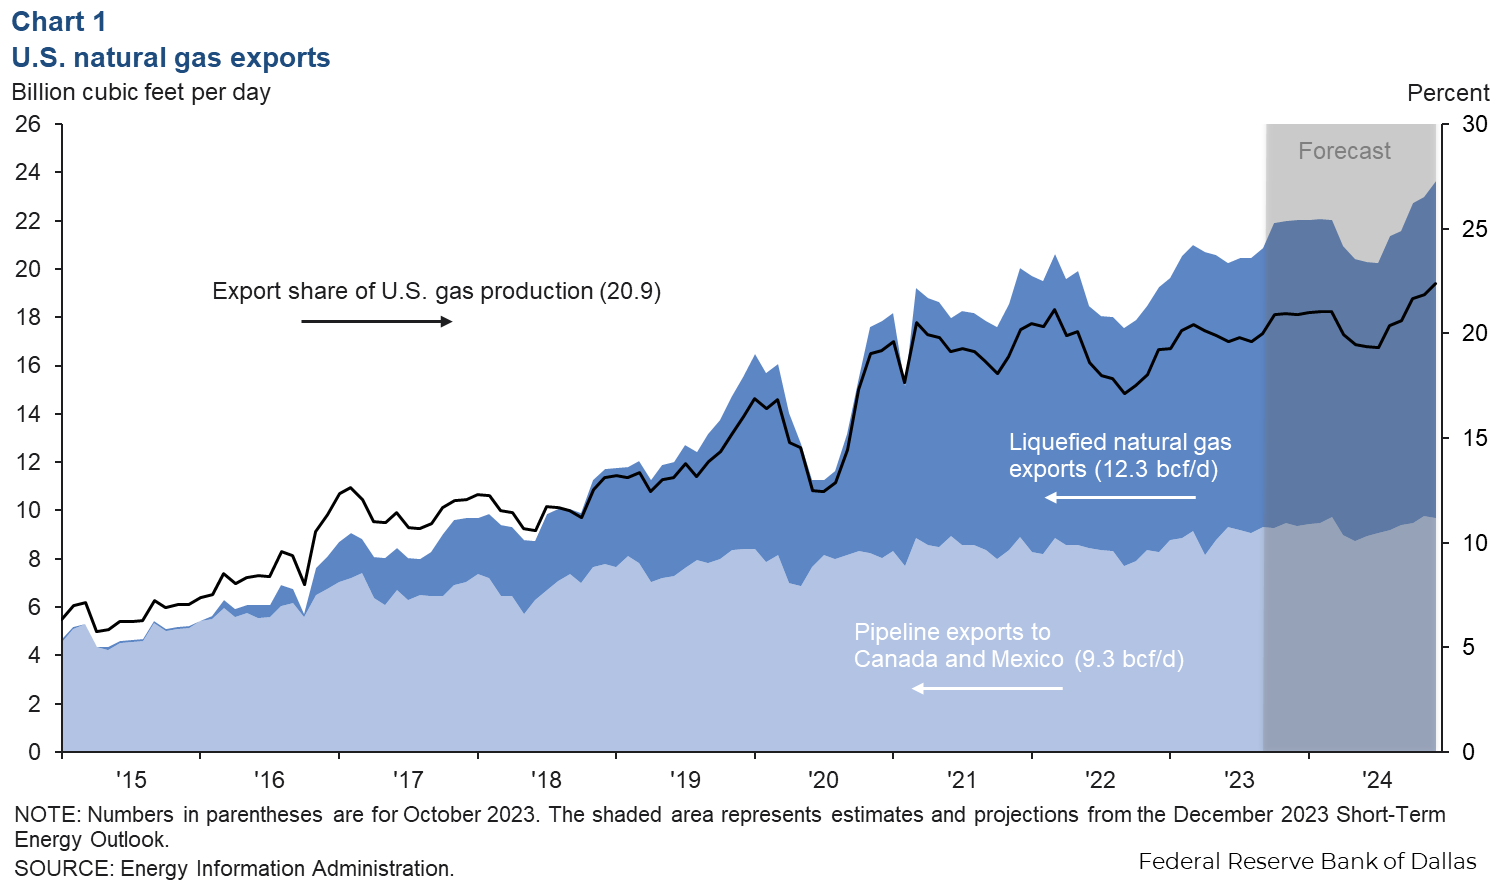
In the first half of 2023, the U.S. sent 7.8 bcf/d of LNG to Europe (67 percent of the total), 2.5 bcf/d (22 percent) to Asia and 0.6 bcf/d (5 percent) to Latin America. Third-quarter LNG exports saw modest broad-based declines and averaged 11.4 bcf/d.
As of mid-October, there were four U.S. LNG facilities under construction: the Golden Pass, Plaquemines, Port Arthur, Corpus Christi III and Rio Grande projects, which will add an additional 11.2 bcf/d of peak nameplate capacity after completion. Completion dates range from first quarter 2025 for Golden Pass to 2028 for Rio Grande.
U.S. LNG exports go through the Panama Canal, but due to a severe drought, both the size and number of ships transiting the canal’s lochs have dropped. This is causing higher costs for LNG shippers taking alternative routes or paying fees for auction slots to transit the canal.
Natural gas prices fall
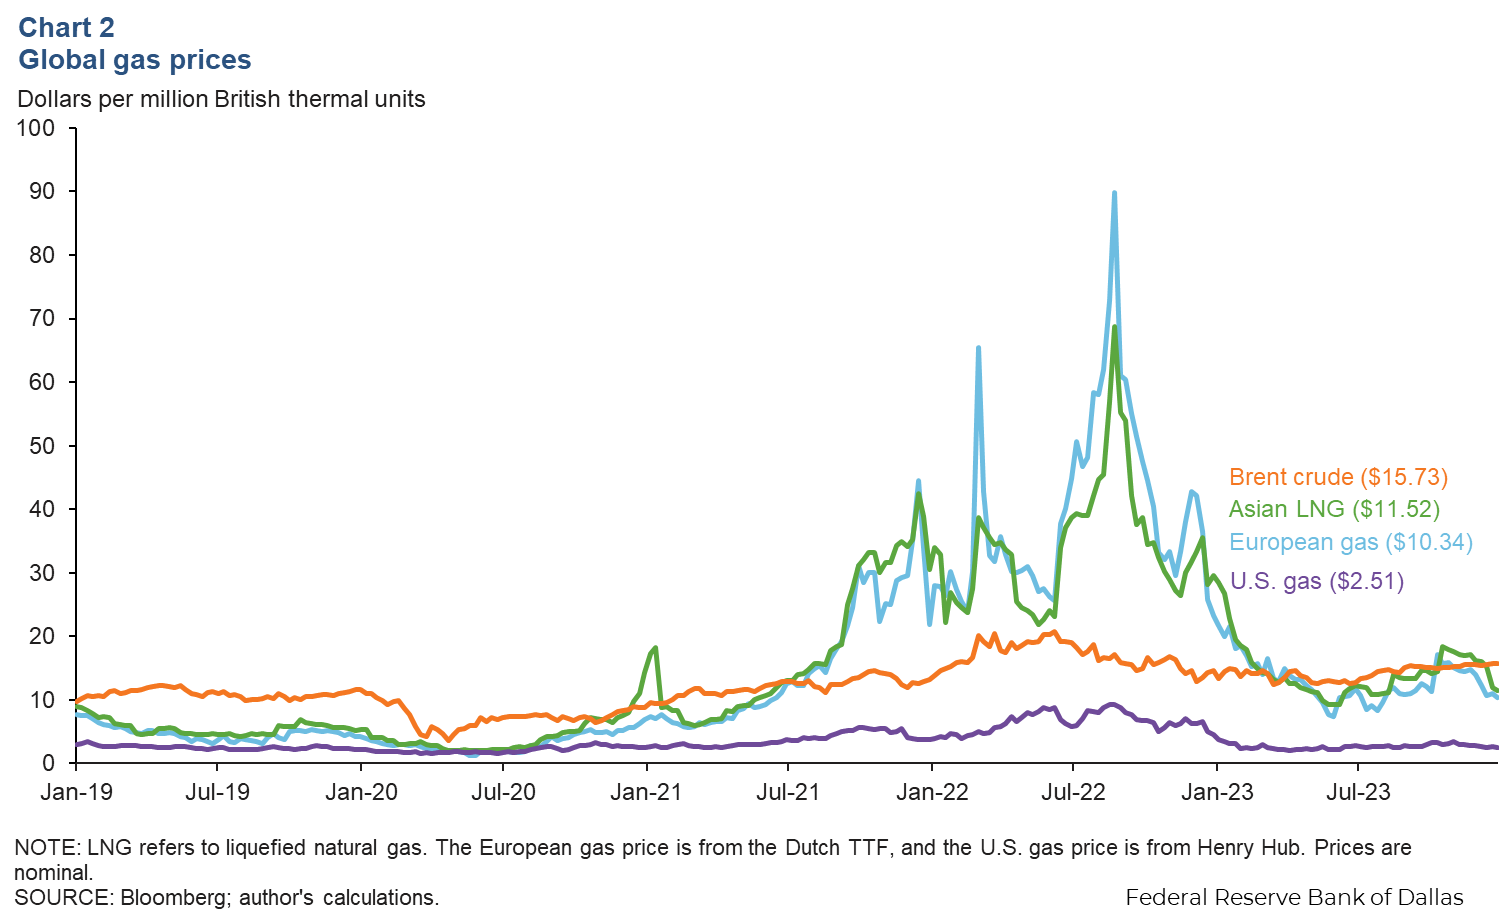
Natural gas prices have plummeted from their heights in 2022, particularly in Europe where the Dutch TTF benchmark was down 82 percent year over year, falling to $10.89 per million British thermal units (MMBtu) for the week ending Sept. 1. Since then, both Asian LNG and European gas prices have continued to decline. The Japanese–Korean LNG price was down 14 percent from Sept. 1 to Dec. 29 at $11.52 per MMBtu, and the European benchmark was down 10 percent at $10.34 per MMBtu (Chart 2).
U.S. working natural gas stocks stood at 3,490 billion cubic feet (Bcf) the week ending Dec. 22, which was 334 Bcf (11 percent) higher than the five-year average—excluding the pandemic—and 378 Bcf (12 percent) more than that period in 2022. In the European Union, as of Jan. 1, 2024, inventories were 86.3 percent full—up 2.3 percentage points from the same time in 2023.
U.S. heating oil prices softening due to warm winter forecast and easing crude prices
U.S. heating oil prices are largely driven by Northeast markets whose homes make up 90 percent of domestic demand. For the week of Dec. 25, U.S. residential heating oil prices were $3.99 per gallon, and in the Northeast (PADD 1), heating oil prices were $4.02 per gallon. In the Midwest (PADD 2), prices were $3.49 per gallon. The U.S. average heating oil price fell by 9.1 percent from Oct. 2 to Dec. 25 (Chart 3).
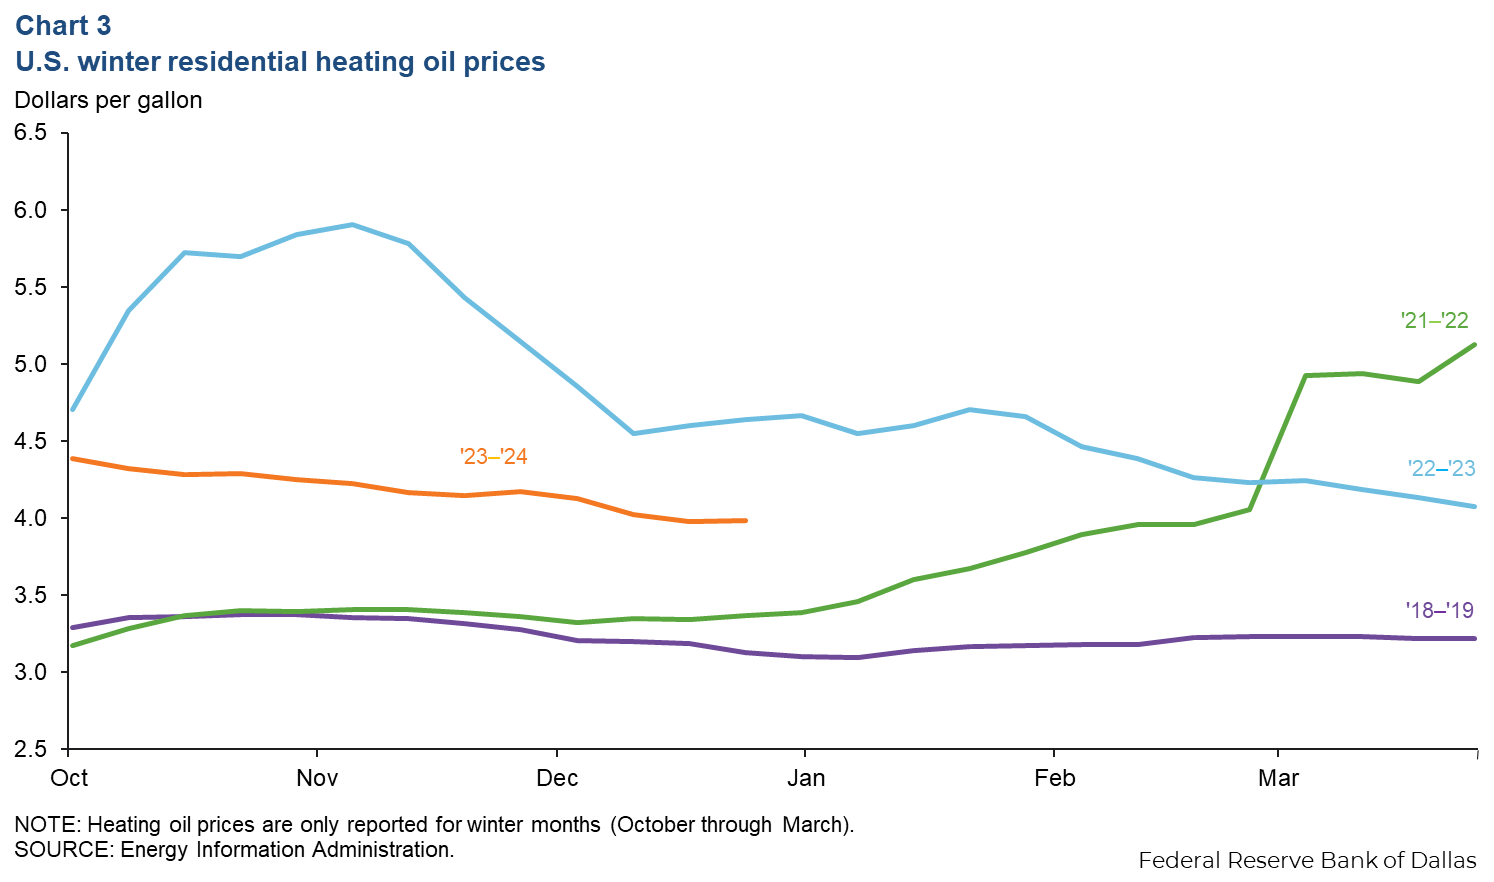
Lower heating oil prices are partly due to the declines in the cost of diesel, which was down over 17 percent year over year at the start of December. Another reason for the decline in prices from early October to December is that, according to the National Oceanic and Atmospheric Administration, the U.S. is facing a warmer-than-average temperature outlook thanks in part to El Niño in the southern Pacific Ocean.
U.S. propane prices rising but below level in 2022
U.S. residential propane prices have risen slightly in recent weeks. Prices rose 3.6 percent from the start of October to the week of Dec. 25, hitting $2.47 per gallon (Chart 4). That price is 8 percent below 2022’s level for that period and is on par with the prepandemic price, before adjusting for inflation.
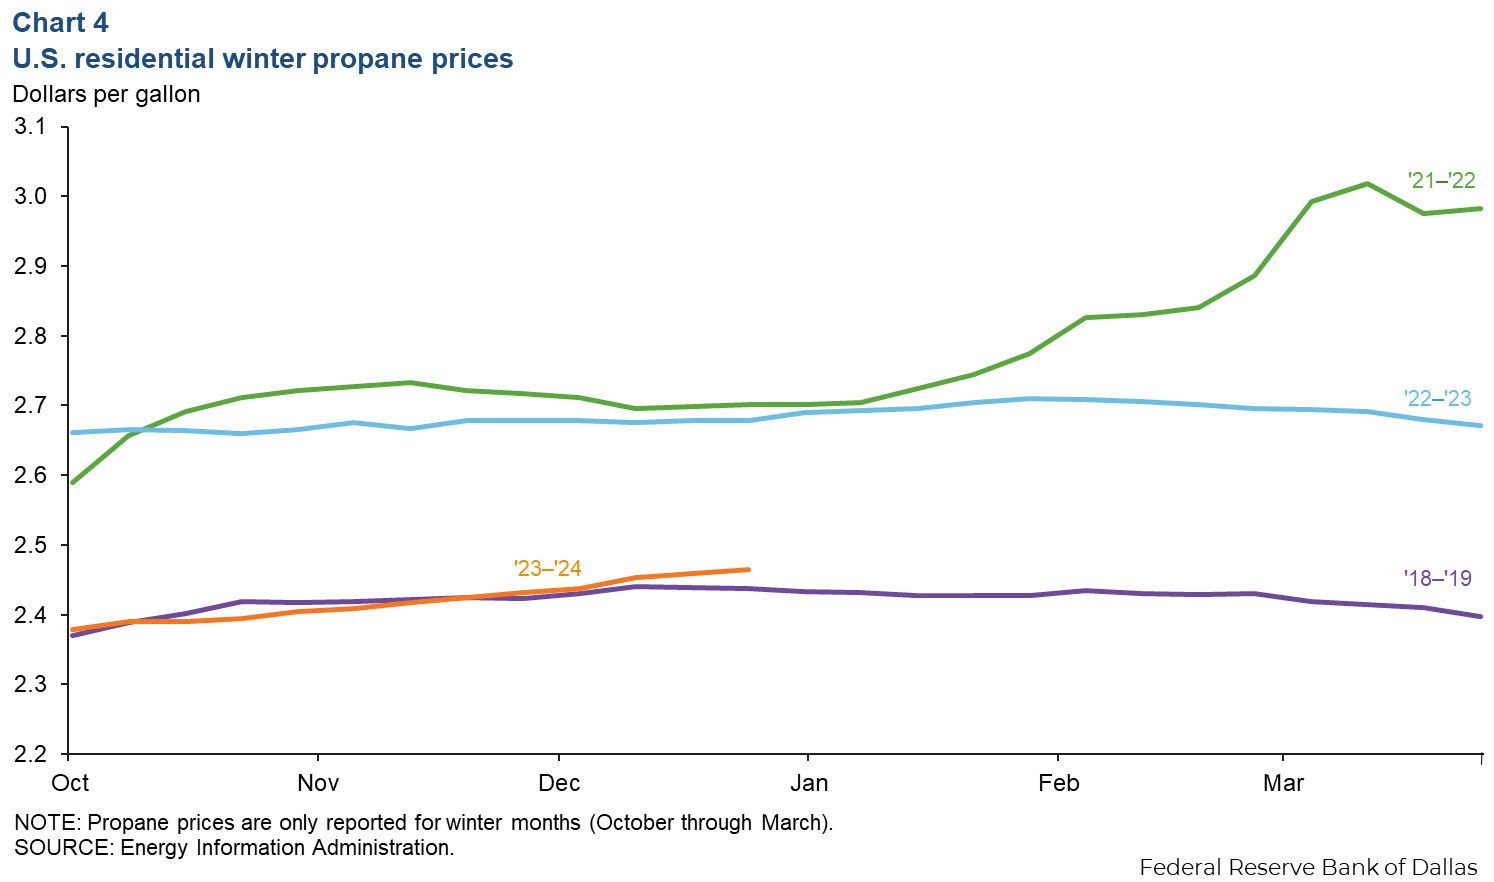
Like heating oil, U.S. propane heating demand is concentrated in the densely populated Northeast. The price of propane in PADD 1 rose 2.1 percent to $3.31 per gallon from the beginning of October to the end of December. Wholesale propane prices for consumers in the Northeast are typically higher because they are far away from the refineries and gas plants where the petroleum product is produced.
Electricity
Texas electricity rates still lower than national average
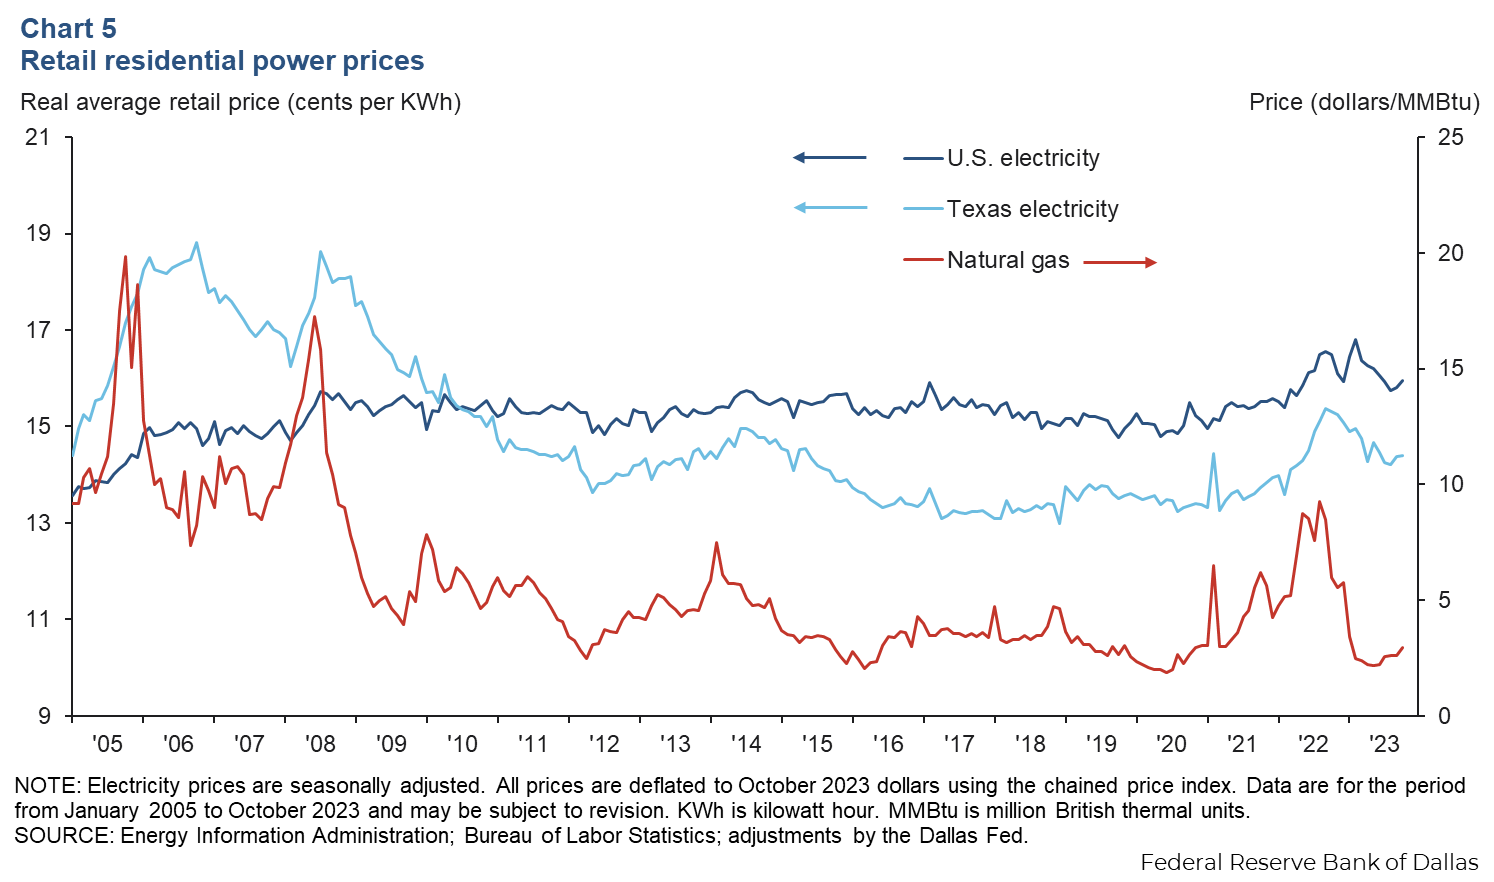
In 2023, the inflation-adjusted average price paid by residential customers per kilowatt hour (kWh) was 9 percent lower in Texas than the national average (Chart 5). Inflation-adjusted prices in the state have been declining since the start of 2023, from a January average of 14.9 cents per kWh to an average of 14.4 cents per kWh in October—a 3.3 percent decline. U.S. prices fell from 16.5 cents per kWh to 16 cents per kWh, a 3.0 percent decline over the same time frame. However, Consumer Price Index data imply that from August to November, total nominal U.S. household electricity prices increased about 3.0 percent, while Texas prices increased about 10.6 percent.
Texas grid looks stable heading into winter, but storm risk remains
Peak load is expected to rise from 63,032 megawatts (MW) in December 2023 to 66,230 MW in February 2024 (Chart 6). The Electric Reliability Council of Texas (ERCOT) projects that more than sufficient dispatchable capacity—mostly thermal generation—will likely be available to cover projected peak winter demand load should nondispatchable output underperform expectations.
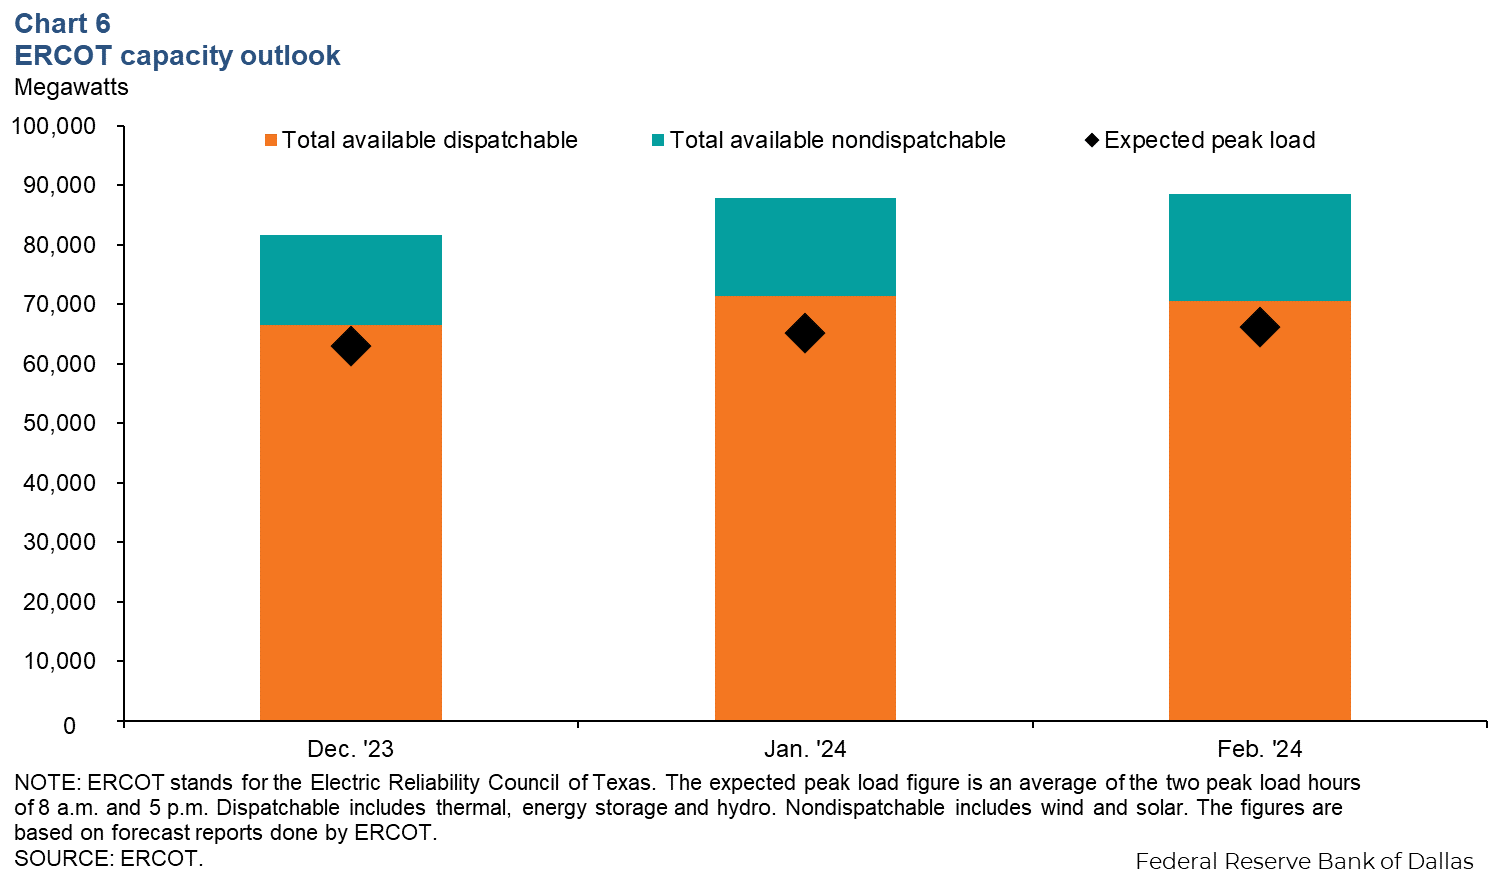
ERCOT leadership indicated in December statements that 1,648 inspections had been done to ensure Texas generation capacity met new standards for winterization set forth after the catastrophic Winter Storm Uri in 2021. Those investments—as well as a slightly lower likelihood of severe winter weather in Texas because of El Niño’s impact on weather patterns—are contributing to the rosy grid outlook.
That is not to say that the grid outlook and winter electricity prices are without risk. A recent ERCOT simulation of the December 2022 Winter Storm Elliott in North Texas, which was a far cry from the devasting cold of Uri, found that the Texas grid faces a roughly 20 percent chance of going into emergency operations—rolling blackouts—if a similar winter storm were to strike again.
About Energy Indicators
Questions can be addressed to Kenya Schott at kenya.schott@dal.frb.org. Energy Indicators is released monthly and can be received by signing up for an email alert. For additional energy-related research, please visit the Dallas Fed’s energy home page.