Energy Indicators

| Energy dashboard (July 2025) | |||
| WTI price avg. June 16–20 |
WTI price change from 4 weeks prior |
Henry Hub price avg. June 2–6 |
Henry Hub price change from 4 weeks prior |
| $74.94/barrel | 18.46% | $3.08/MMBtu | 1.05% |
Production from OPEC+ member countries is increasing. That’s keeping downward pressure on oil prices, tempering the impact of recent attacks on Iran by Israel and the United States. Global LNG prices have trended upward in the first half of 2025. U.S. natural gas exports are forecast to rise through 2026. Chemical input prices have fallen this year, and chemical exports have declined year over year.
Global oil market
OPEC+ 18 continues to ramp up production
OPEC+ 18, the group of oil producing countries subject to the 2021 production cut agreements for the Organization of the Petroleum Exporting Countries, continues to unwind its voluntary cuts as it surpasses its target of 34.0 million barrels per day (mb/d) by 1.2 mb/d in May 2025 (Chart 1). That target, as calculated by the International Energy Agency (IEA), includes both extra production cuts from countries such as UAE and Iraq, that have regularly over-produced their target, and voluntary cuts. The latter was mostly bourn by Saudi Arabia.
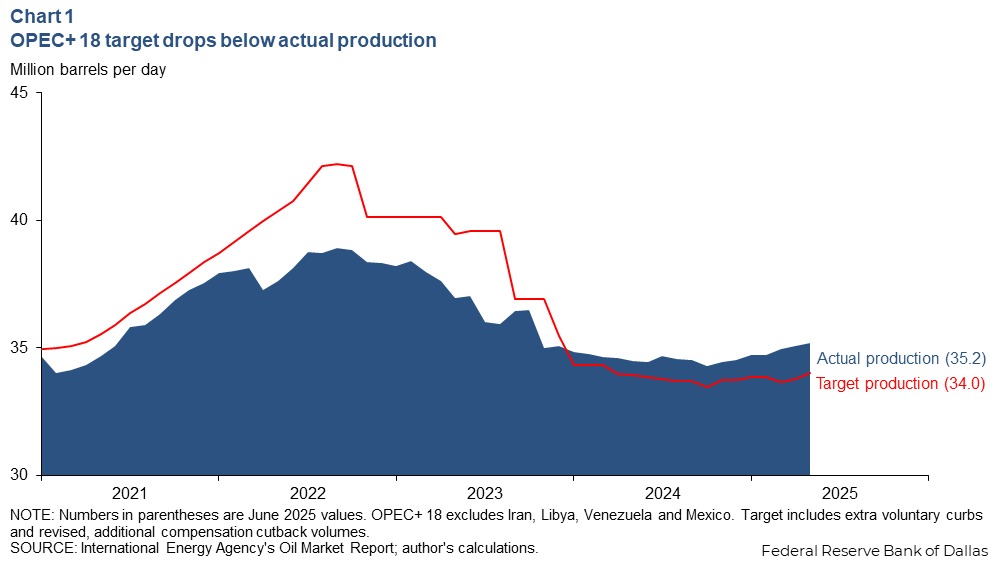
While the group announced increases in production targets for April and May totaling over 0.5 mb/d, actual production increases from the group amounted to 0.3 mb/d. Preliminary estimates indicate June production increases fell short of targets as well, despite increases in exports.
Global oil prices trend down
After orbiting $61 for several months, the average daily closing price for Brent rose 7.2 percent and West Texas Intermediate (WTI) crude rose 6.2 percent from May to June. While prices began firming at the very start of the month, they surged on geopolitical risks to supply when Israel began bombing Iran on June 13 targeting nuclear enrichment facilities as well as other strategic targets (Chart 2). Iran’s export-oriented energy infrastructure was not destroyed in the attacks. However, market concerns that exports and production could be damaged in an escalating conflict, either as part of the Israeli bombing campaign or by Iran blocking the Strait of Hormuz, drove Brent only as high as $80.59, given the backdrop of rising OPEC supplies and modest demand growth.
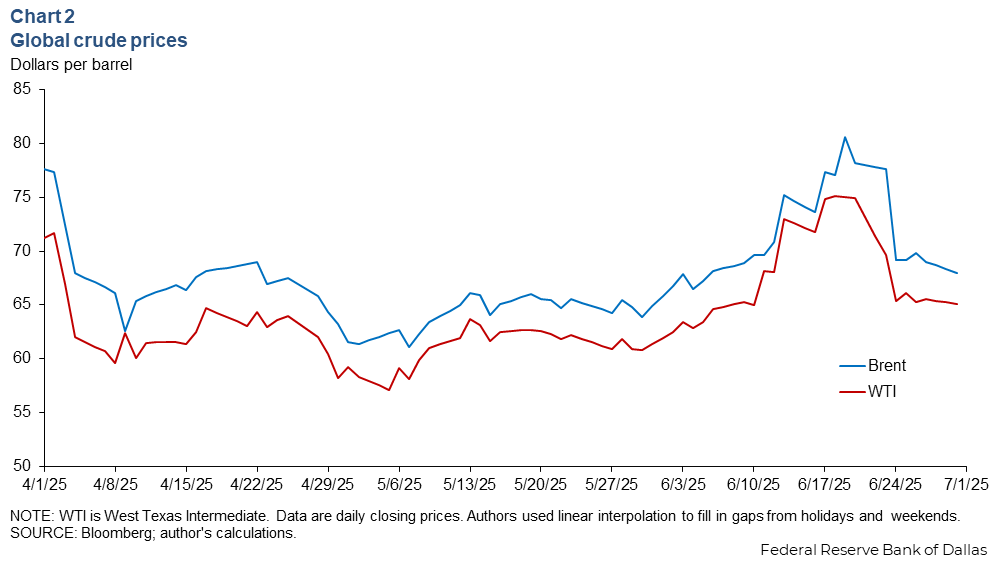
After U.S. deployment of bunker-buster bombs against underground facilities and a number of retaliatory missile attacks from Iran, a ceasefire went into effect on June 24 prompting a decline in oil prices to prior levels.
About 20 percent of global crude and product flows, as well as 20 percent of global liquified natural gas trade, pass through the Strait of Hormuz. Given the geography of the region, the capacity to move those molecules through other routes is extremely limited. Blocking the strait for any amount of time, even partially, would have material consequences for oil consumers globally as well as the exporting nations that rely on it, notably Saudi Arabia, Kuwait, the UAE, Qatar and Iran itself.
Global LNG market
Global gas prices on the rise
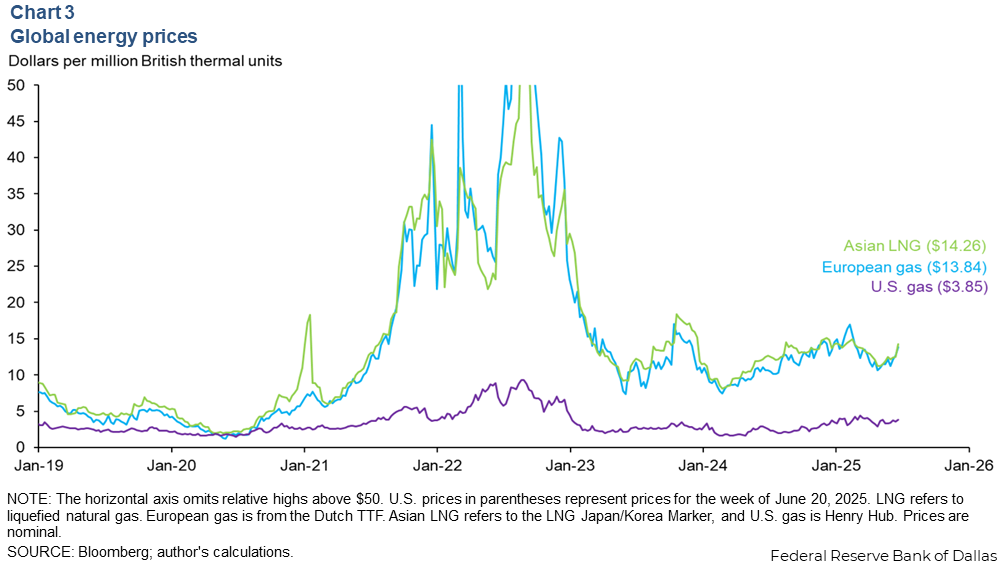
Weekly natural gas prices rose from June 2024 to June 2025, particularly in Europe where the Dutch Title Transfer Facility (TTF) benchmark rose 30 percent year over year to $13.84 per million British thermal units (MMBtu) the week ending June 20 (Chart 3). The Japan-Korea benchmark liquified natural gas (LNG) price similarly rose 14 percent to $14.26. Henry Hub gas rose 42 percent to $3.85 per MMBtu. Pricing for all markers rose sharply with the geopolitical events in June 2025. Markets bid up the price of natural gas in part on concerns that shipment of LNG would be disrupted through the Strait of Hormuz, which transits 20 percent of global LNG trade.
U.S. LNG exports expected to grow through 2026
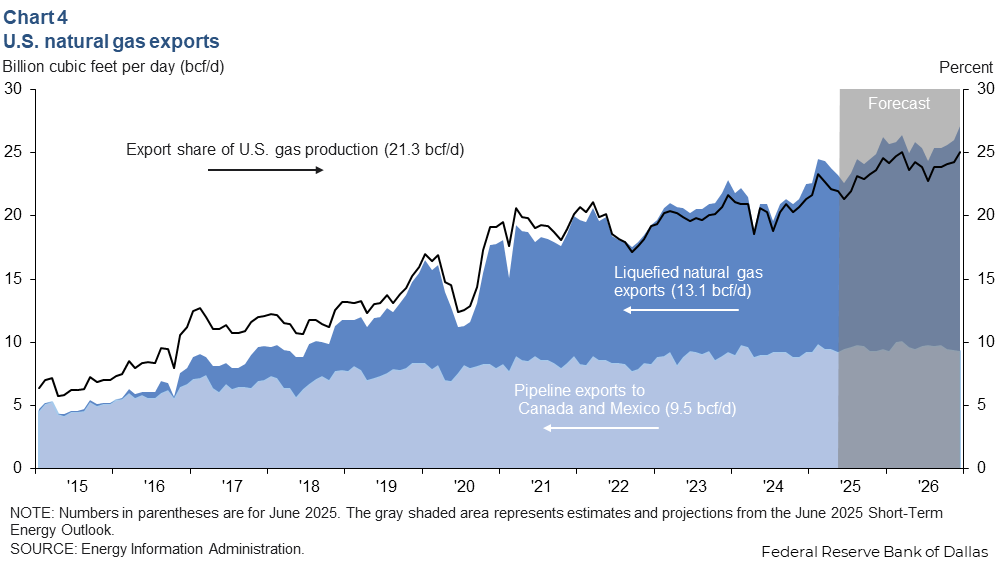
The Energy Information Administration (EIA) reported LNG exports were 13.1 billion cubic feet per day (bcf/d) in June, and pipeline exports were 9.5 bcf/d (Chart 4). According to the EIA’s projections, the export share of U.S. dry gas production will rise from 21.3 percent in June 2025 to 23.9 percent in June 2026 aided by the scheduled completion of the Golden Pass LNG export facility and slowing natural gas production growth, particularly out of the Permian basin.
In late June, Cheniere Energy announced its final investment decision (FID) for an approximately 0.7 bcf/d expansion to the liquefaction capacity at its site in Corpus Christi, Texas. While the project has received the Federal Energy Regulatory Commission (FERC) permit approval, the permit to export to free trade agreement (FTA) countries and non-FTA countries from the Department of Energy (DOE) was still pending in early July 2025. Additionally, Venture Global’s approximately 1.9 bcf/d CP2 project in Cameron Parish, Louisiana, received all required permits from FERC and the DOE, but the firm had yet to reach FID in early July.
If these projects and those that are already moving forward with construction were to all come to fruition at the scale and timing currently scheduled, the total expansion of U.S. LNG export capacity slated to come online from 2027 to 2030 would amount to over 9.9 bcf/d.
Chemicals
Chemical input prices fall in first half of 2025
The nominal price of ethane was 9.3 cents per pound in June 2025 while ethylene hit 21.4 cents per pound and Houston’s high-density polyethylene (HDPE) reached 37.5 cents per pound (Chart 5). Since March 2025, the prices of all three chemicals fell, with ethane dropping the most by 24 percent over that time period. The downward trend of chemical prices for this year can be partially explained by falling oil and natural gas prices as well as easing demand from petrochemical producers.
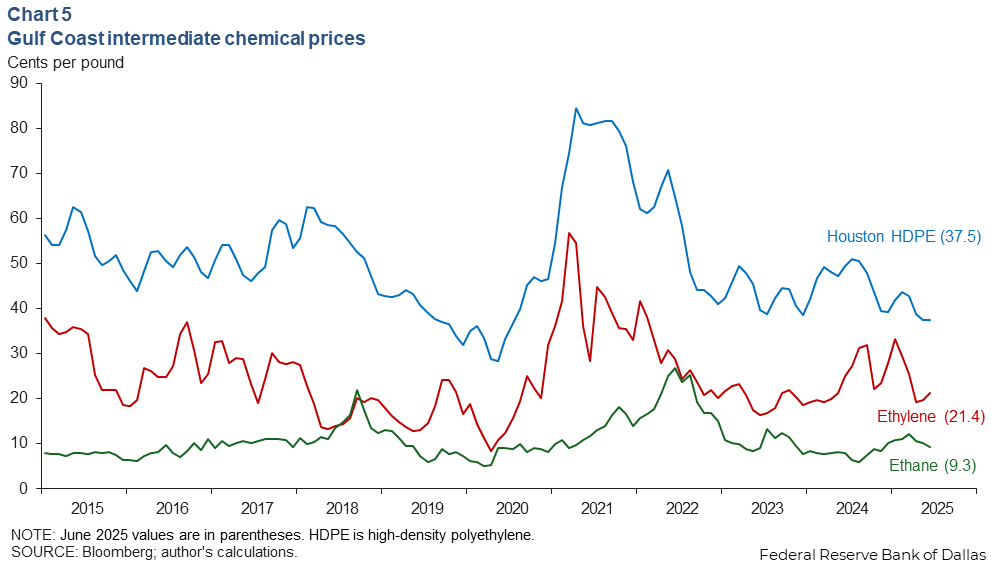
In June, the administration restricted the export of ethane to China, the destination for nearly half of U.S. ethane exports. The stoppage put downward pressure on pricing in June and was of concern to oil and gas firms in the Permian Basin, which rely on exports to continue producing. On June 2, the administration allowed ethane exports to China to resume.
Chemical exports fall
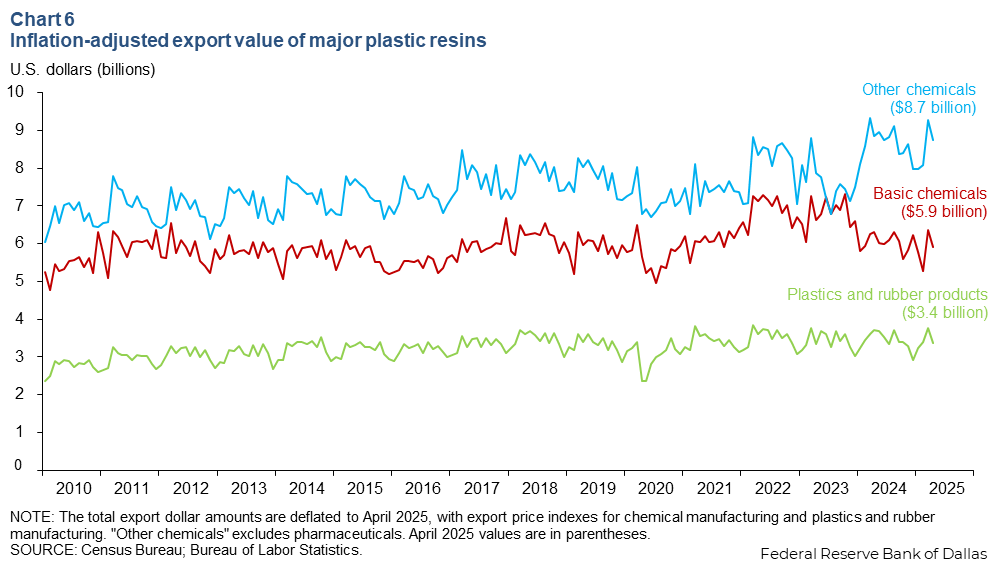
The inflation-adjusted export value of basic chemicals was $5.9 billion in April 2025, $8.7 billion for other chemicals (excluding pharmaceuticals) and $3.4 billion for plastics and rubber products (Chart 6). Exports of basic chemicals shrunk 6.1 percent year over year, and exports of plastics and rubber sank 9.1 percent year over year. Exports of other chemicals fell 1.2 percent year over year.
About Energy Indicators
Questions can be addressed to Sasha Samperio at sasha.samperio@dal.frb.org. Energy Indicators is released monthly and can be received by signing up for an email alert. For additional energy-related research, please visit the Dallas Fed’s energy home page.