Energy Indicators

| Energy dashboard (Mar. 2026) | |||
| WTI price avg. Mar. 2026 |
WTI price change (Jan.-Mar.) |
Henry Hub price avg. Mar. 2026 |
Henry Hub price change from 4 weeks prior (Jan.-Mar.) |
| $91.00/barrel | 51.01% | $3.04/MMBtu | -60.56% |
Global energy markets faced increased volatility in early 2026 following the geopolitical shock of the Iran conflict. The closure of the Strait of Hormuz, as well as attacks on related infrastructure in the region, have not only pushed crude prices up sharply but widened the spread between fuel costs and crude prices. The result has been higher prices at the pump.
OECD oil inventories and historical prices
OECD liquids stocks steady heading into 2026, now drawing down
Oil inventories—crude oil, primary crude products, distillates, residual oil, Strategic Petroleum Reserves (SPR) and stocks of refined petroleum products held in Singapore—remained relatively stable prior to the recent geopolitical escalations. Inventory/days of supply levels hovered together in recent years between 43 and 44 days of oil supply. However, stocks of liquids were structurally tighter compared to prepandemic levels as SPR releases from 2022 and 2023 were never refilled (Chart 1).
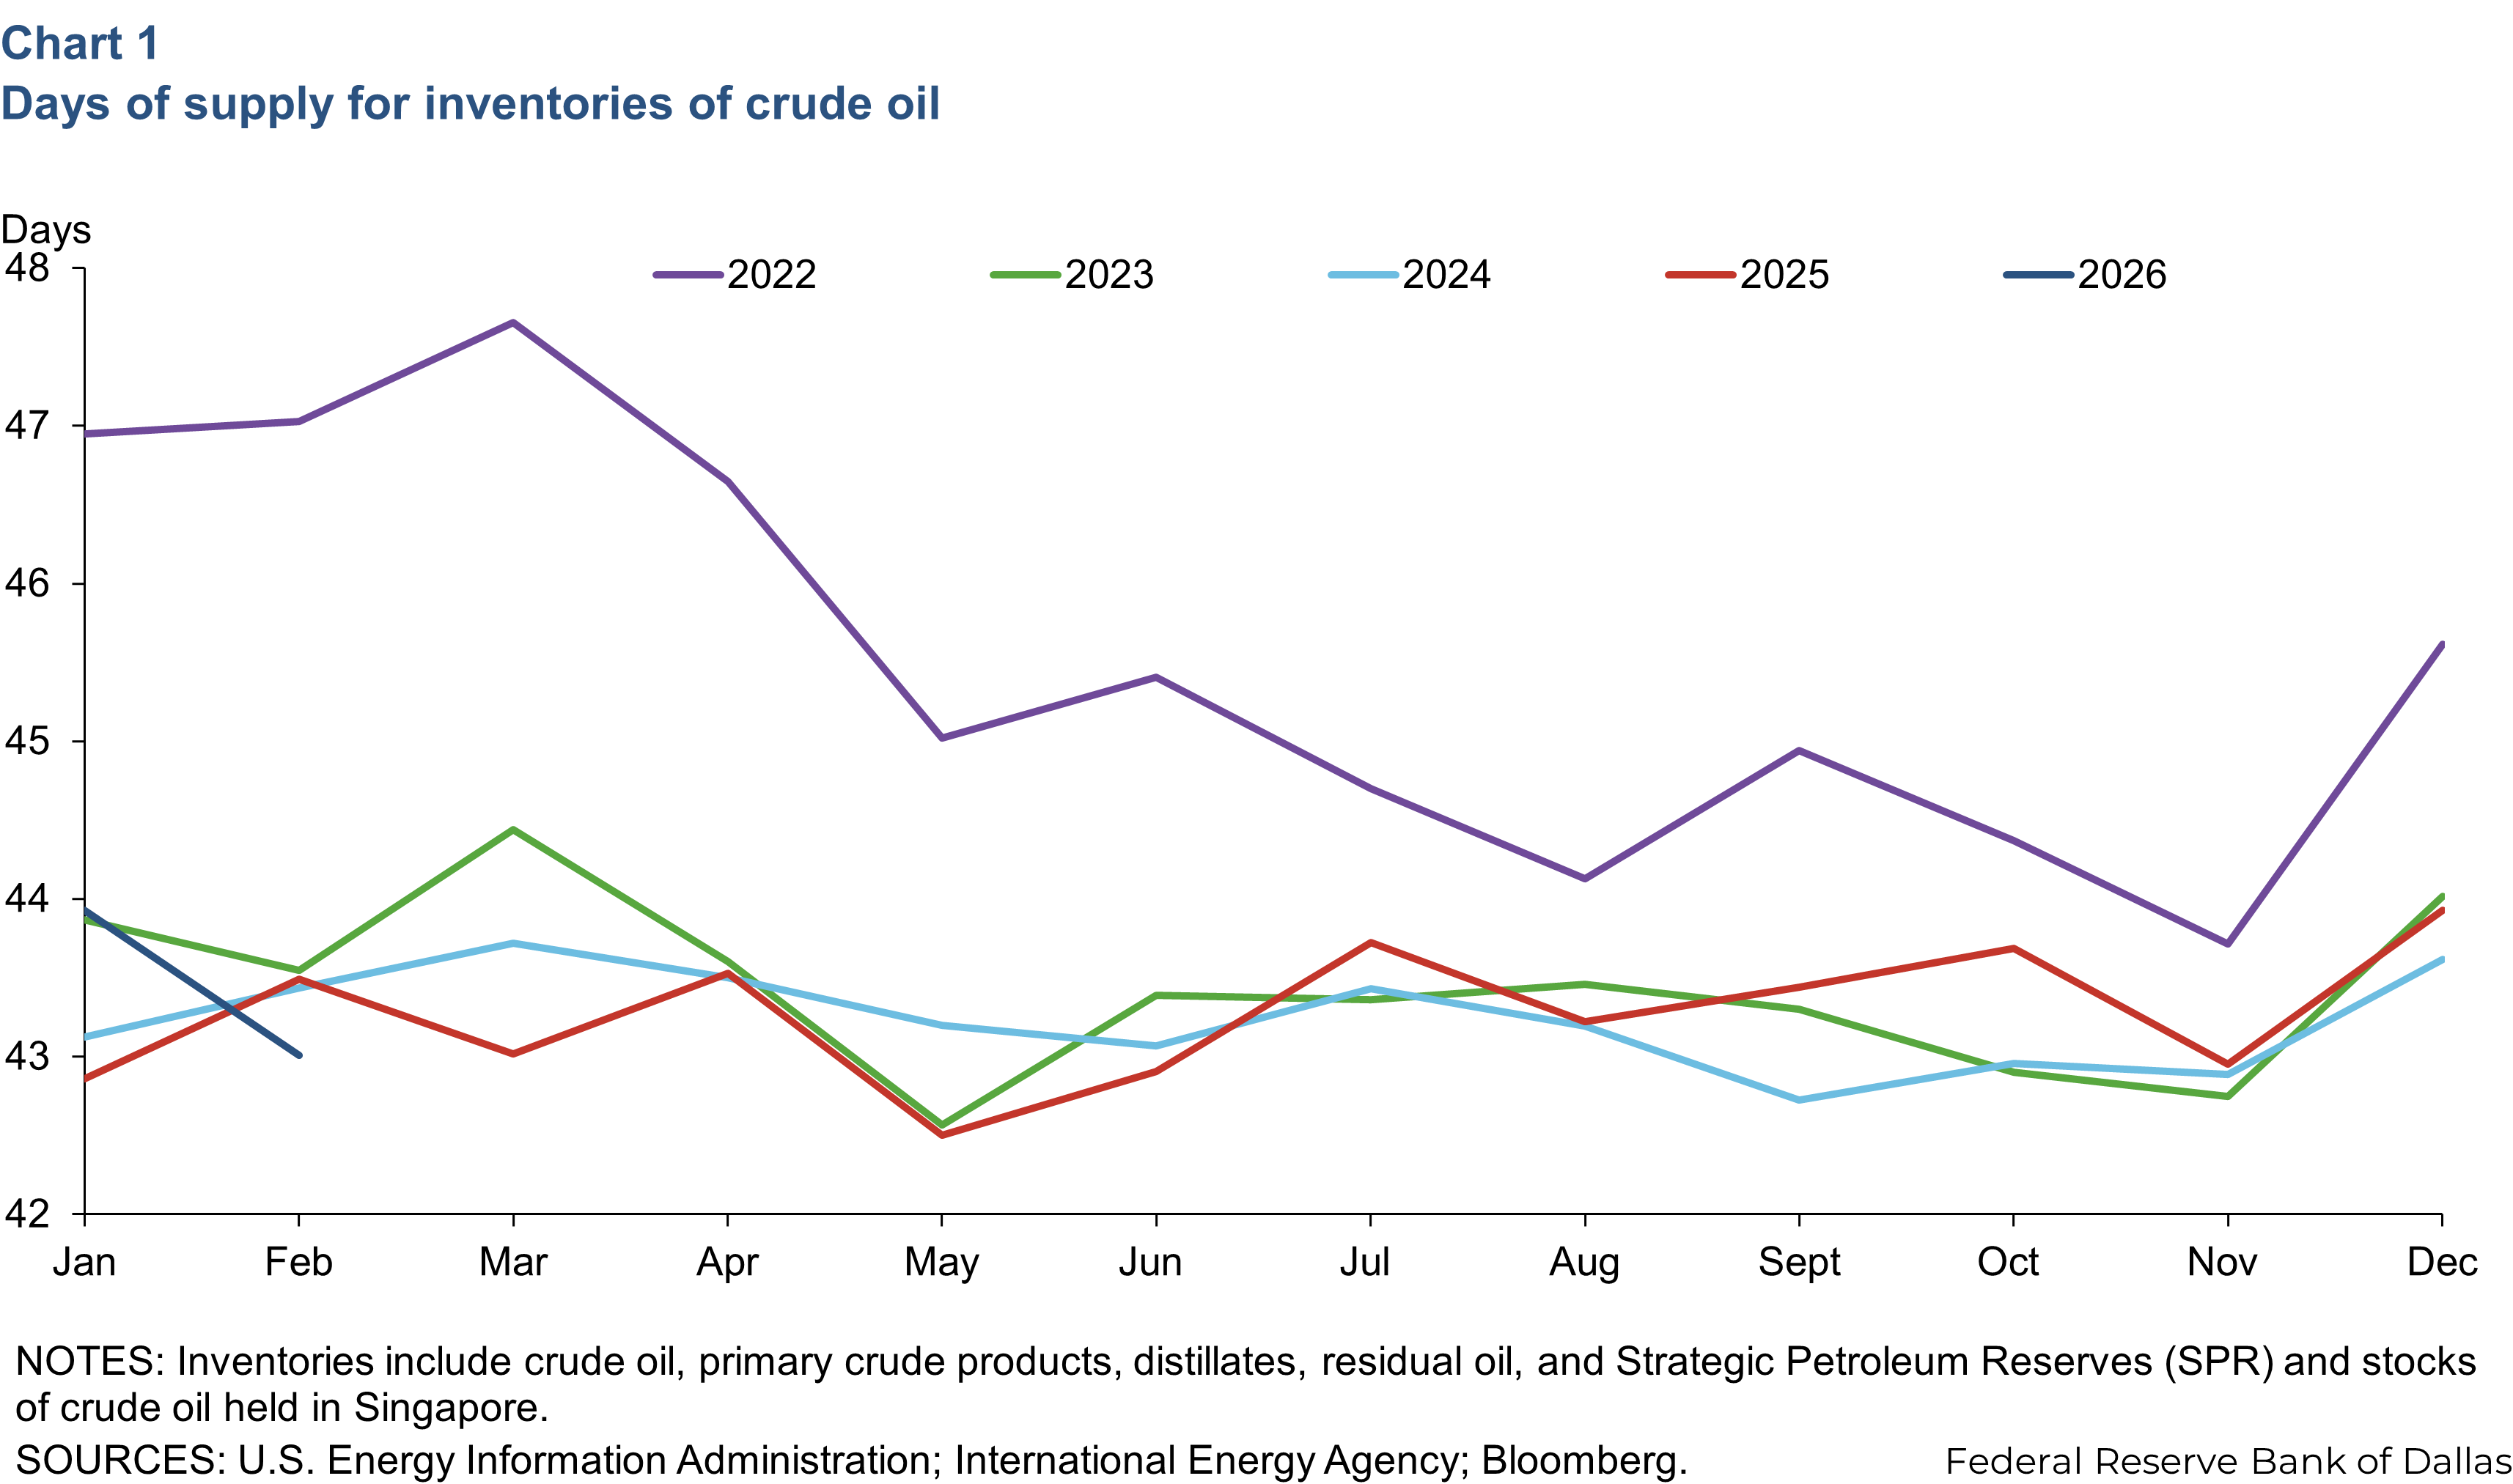
This does not include the roughly 300 million barrels (mb) of sanctioned Russian and Iranian crude oil that was in floating storage by late February. Estimates vary, but with the shut-in of anywhere from 10 to 14 million barrels per day (mb/d) of oil supply that would typically flow through the strait each month, those floating barrels represented around 28 days of additional crude supply buffer. However, to the extent that high prices and rationing have reduced consumption, the buffer of inventories could stretch further. This also doesn’t include inventories of refined products like gasoline, which had an additional 33 days of supply in February, or other secondary oil products.
Energy prices spike
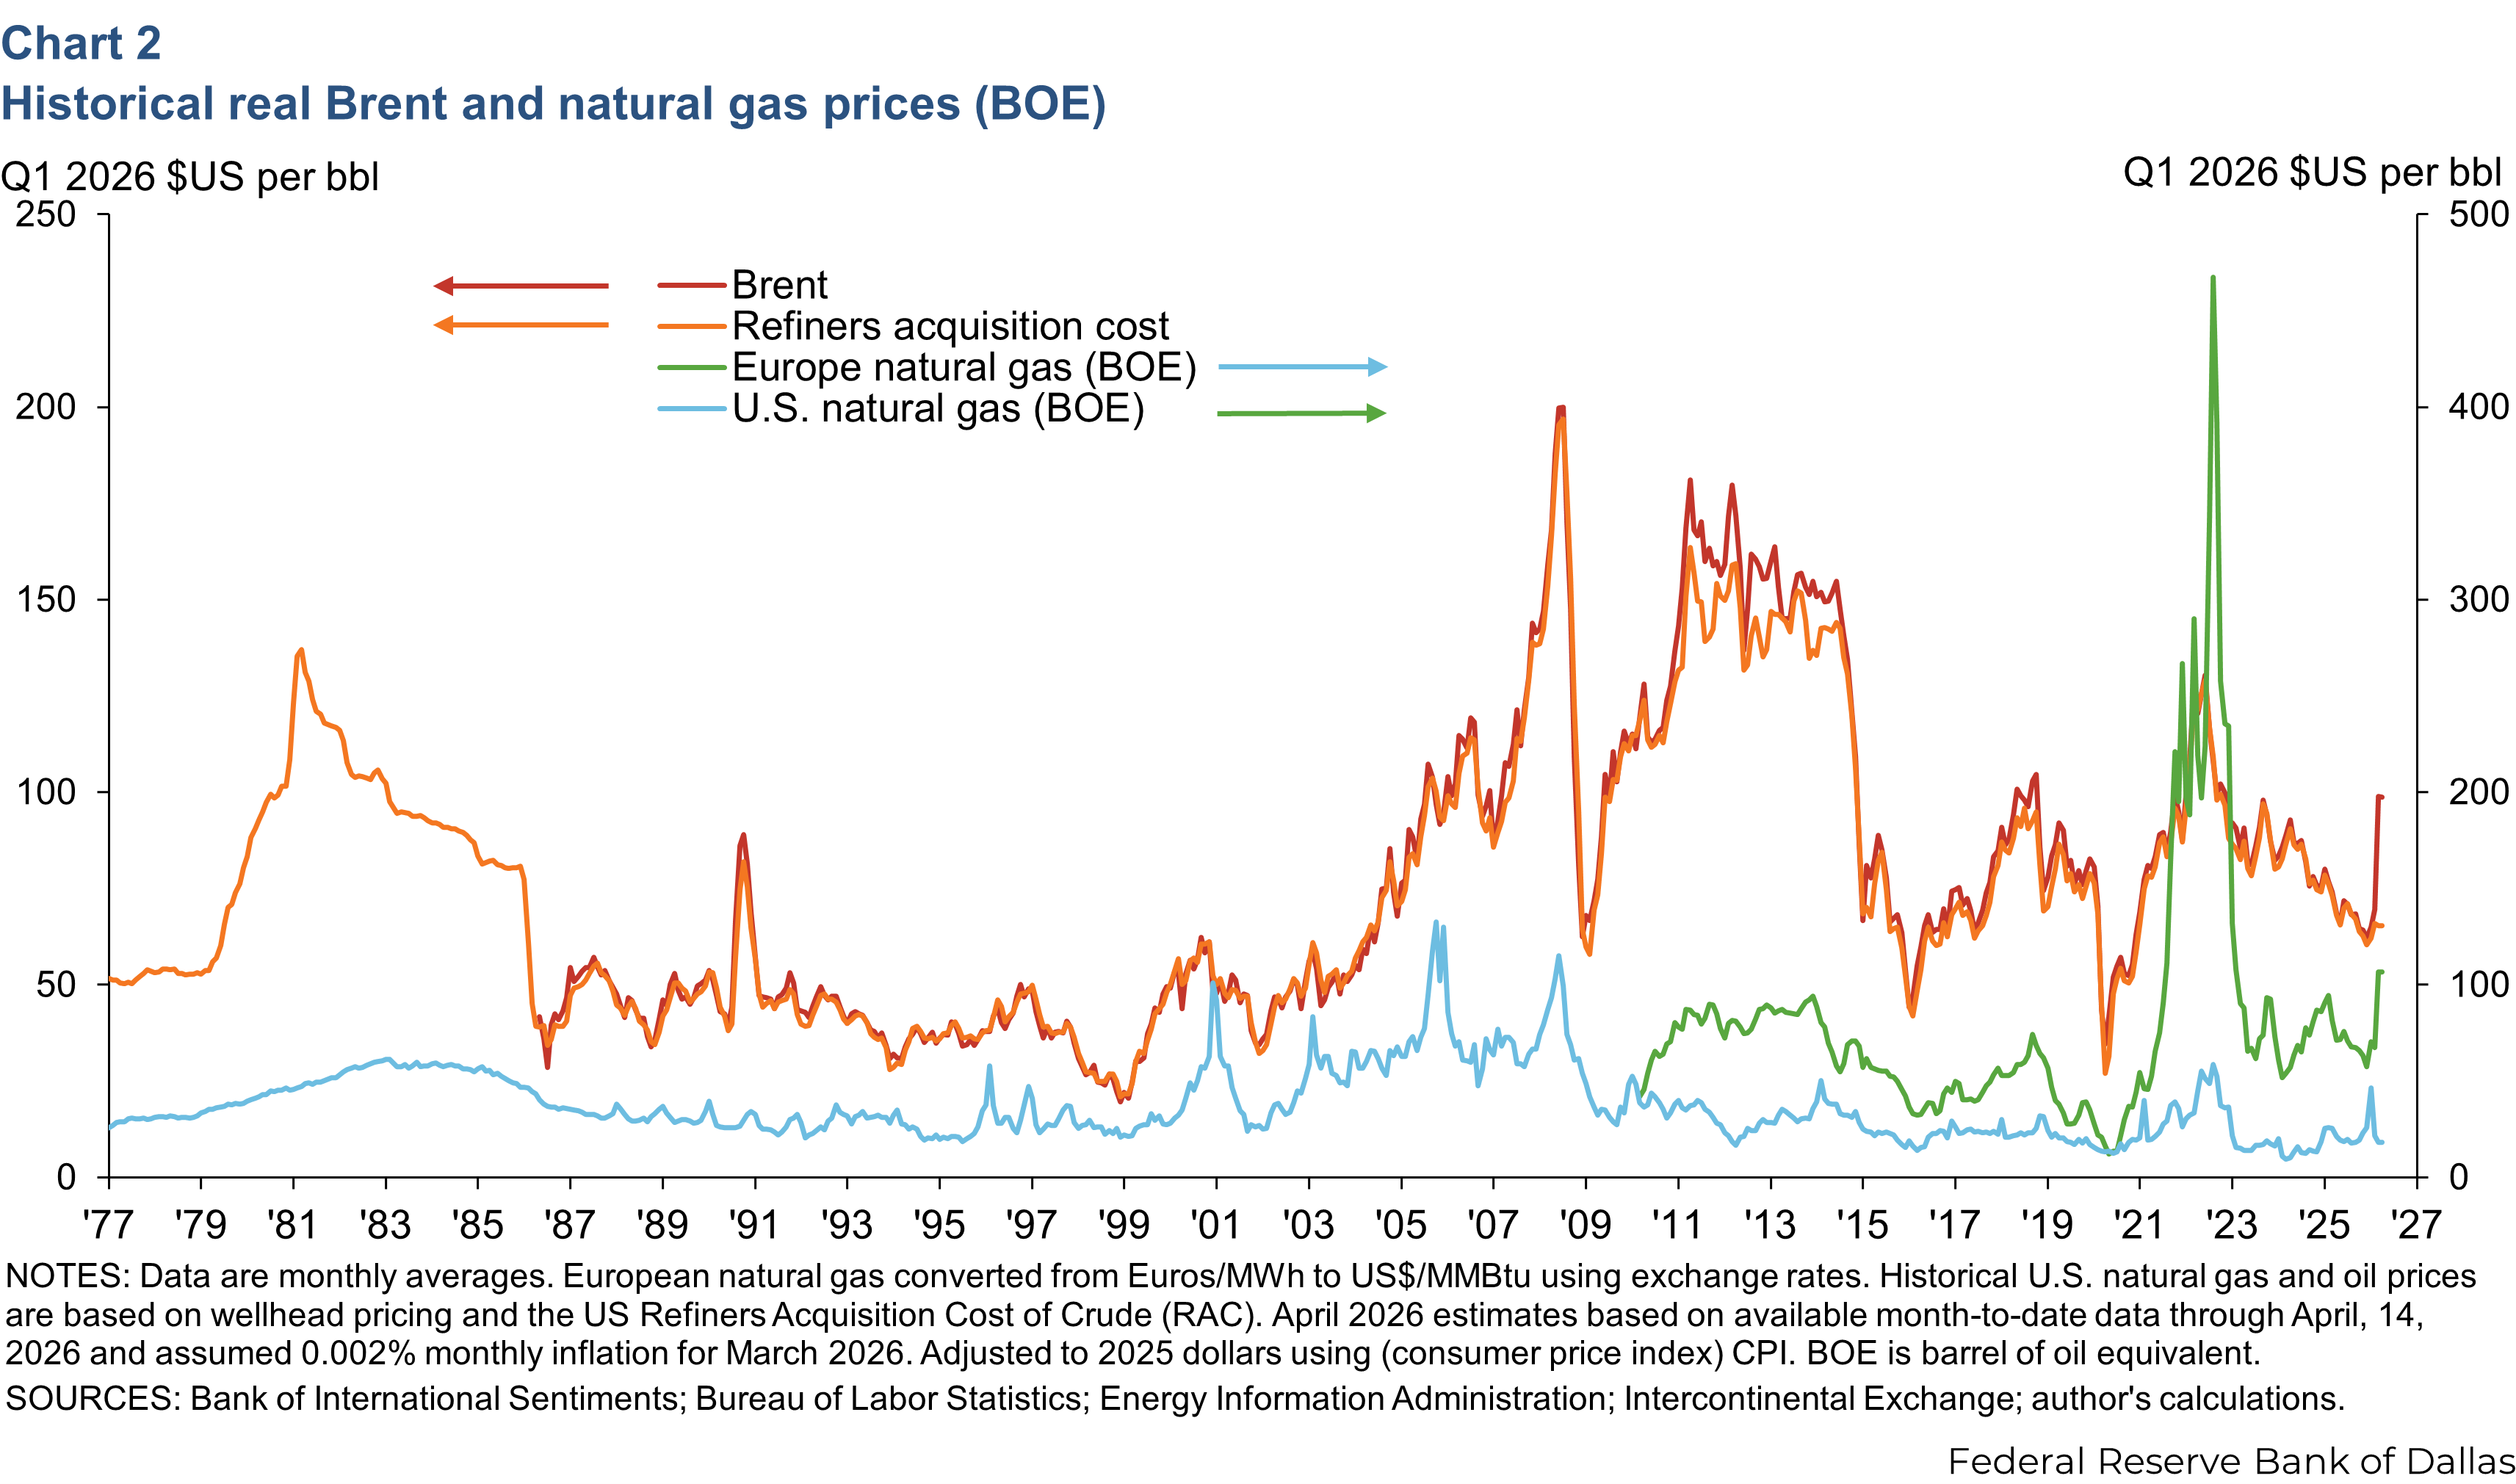
European natural gas prices spiked with the loss of (liquefied natural gas) LNG flows from the Middle East, while U.S. natural gas prices have been largely unaffected. The average prices for benchmark Netherlands Title Transfer Facility (TTF) and Brent crude oil in March were $107 and $99 per barrel, respectively, after adjusting for U.S. dollar inflation to first quarter 2026 dollars. Both price benchmarks are around 52 percent higher compared to January of this year, but TTF remains an order of magnitude away from the heights of the 2022 energy crisis.
On the other hand, U.S. natural gas benchmark Henry Hub sits at $18 per barrel of oil-equivalent (BOE), a 60 percent decrease from January of this year (Chart 2).
Refinery margins and retail fuel prices
Refinery margins expand sharply
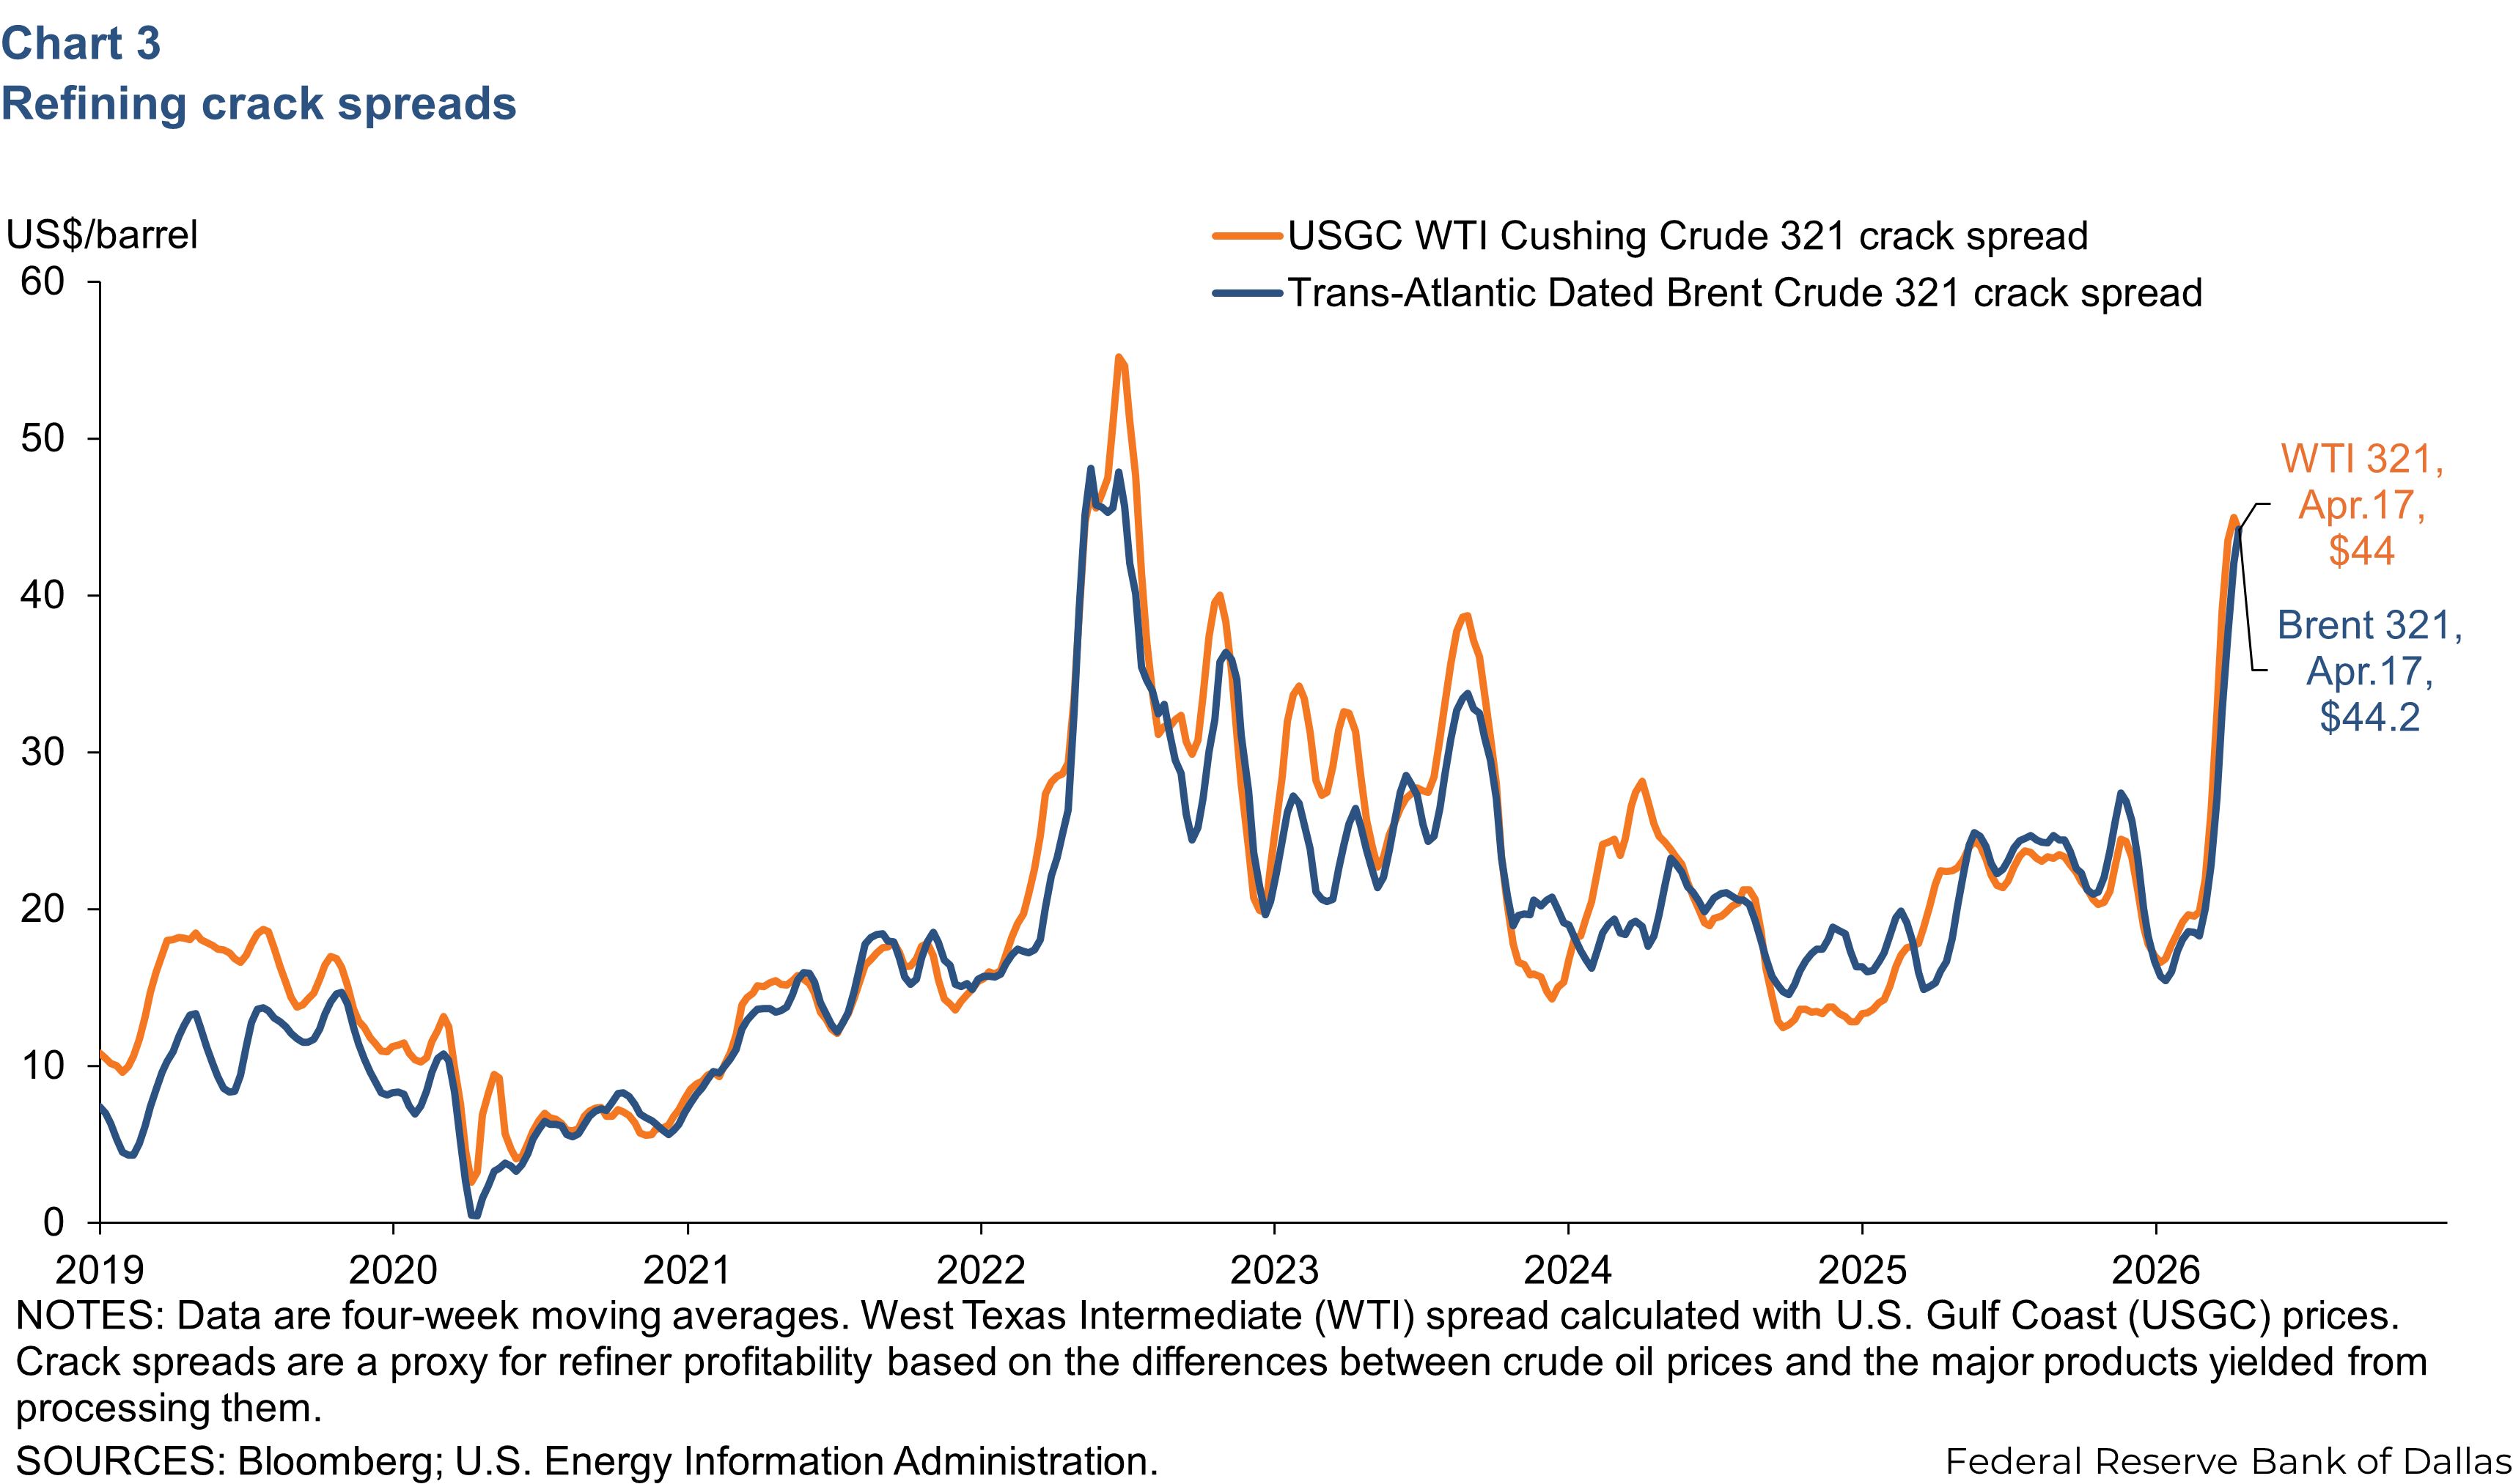
The Brent 3:2:1 crack spread was up by $27 from the start of this year to $42 for the week of March 27, a 176 percent increase. The West Texas Intermediate (WTI) 3:2:1 crack spread was up $30.01 over the same period, a 180 percent increase (Chart 3). The closure of the strait cut off supplies of crude oil, fuels and other products and fuel additives to global markets. Damages to refining capacity in the Middle East due to the Iran war and export bans from China—where much of the global surplus refining capacity is located—contributed to the increase.
Crack spreads—the difference between the price of crude and refined products—are a proxy for refiner profitability. Higher spreads signal refiners to increase output and can incentivize firms to shift refinery yields from one product to another, though the capacity to do that is limited.
Global diesel and jet fuel supplies have seen the sharpest disruption and are the primary drivers of the surge in crack spreads. On the U.S. Gulf Coast, already-elevated distillate margins and export demand pushed utilization rates into the 93-95 percent range, adjusting for seasonal maintenance, before the Iran war. Run rates are rising in the most recent data, but the incremental capacity to produce more fuels and products for export is marginal.
U.S. retail fuel prices see hike
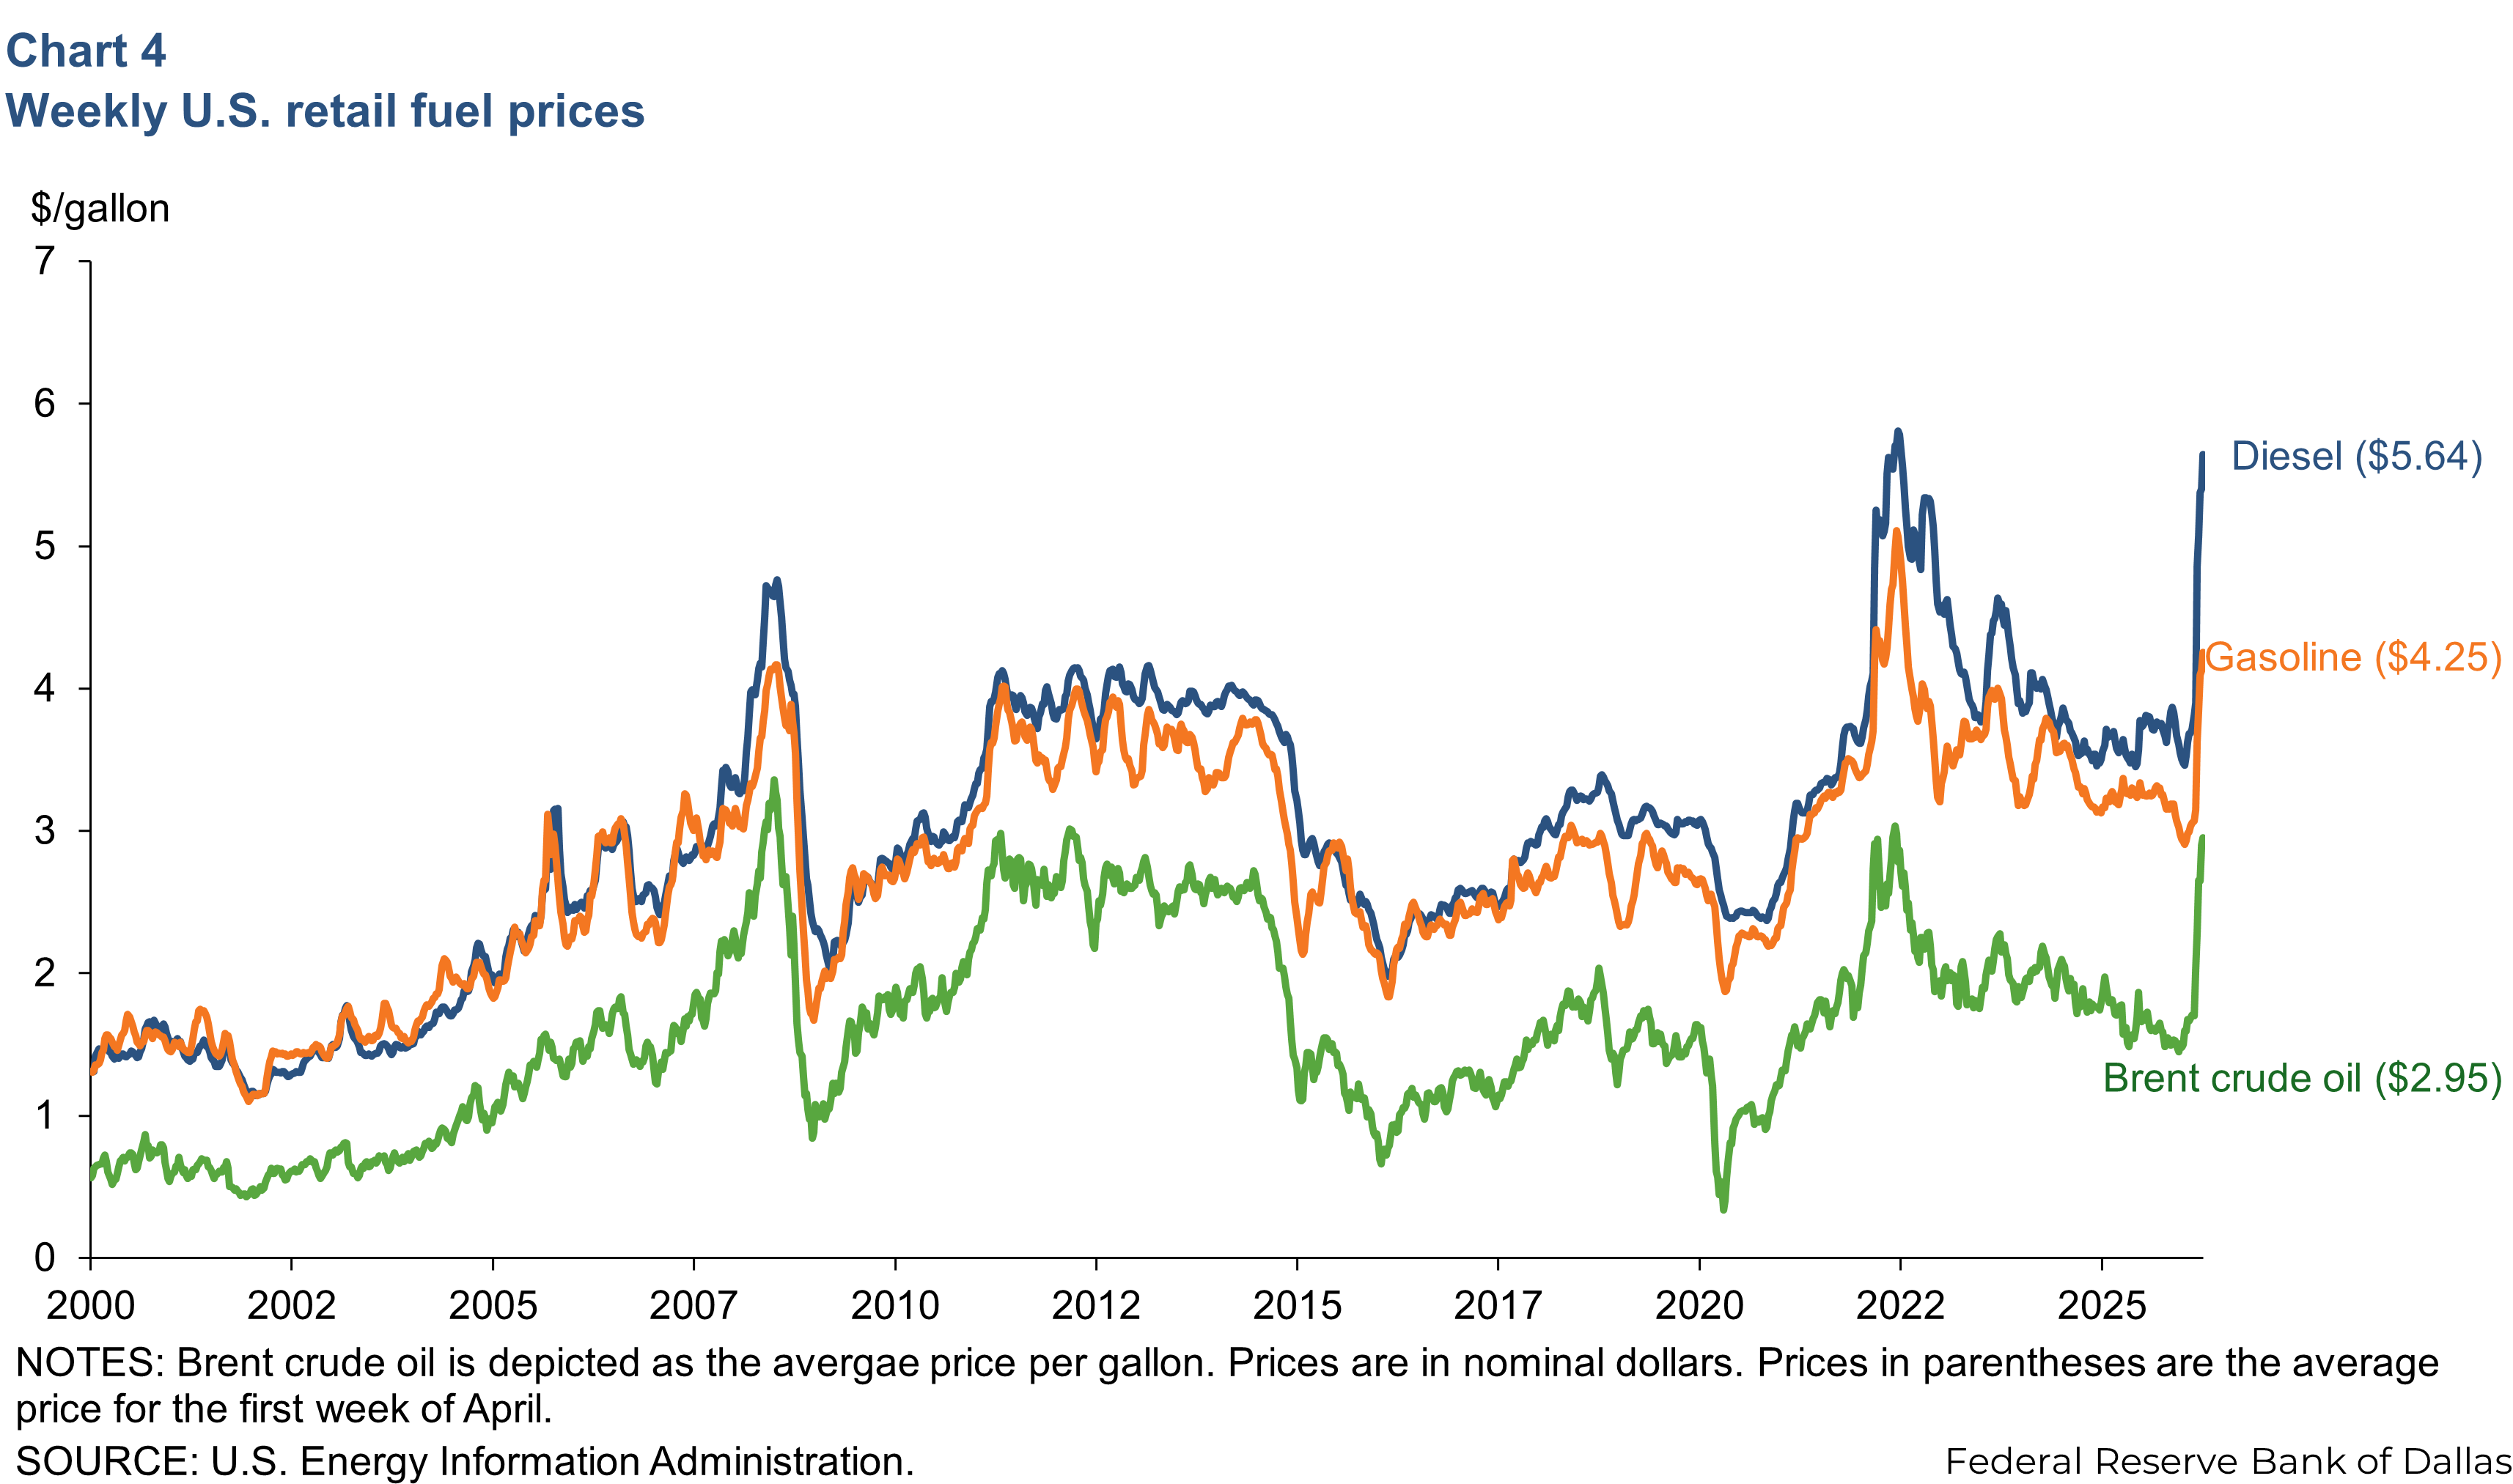
U.S. retail prices for diesel and gasoline saw large spikes in recent weeks. Brent crude rose 95 percent from the first week in January to $2.97 in the second week of April. Crude oil drives about half of the cost of retail fuels. On-highway Diesel rose 62 percent to $5.64 per gallon, and retail gasoline rose 45 percent to $4.25 over the same time (Chart 4).
U.S. industry response
Limited increase in drilling expected
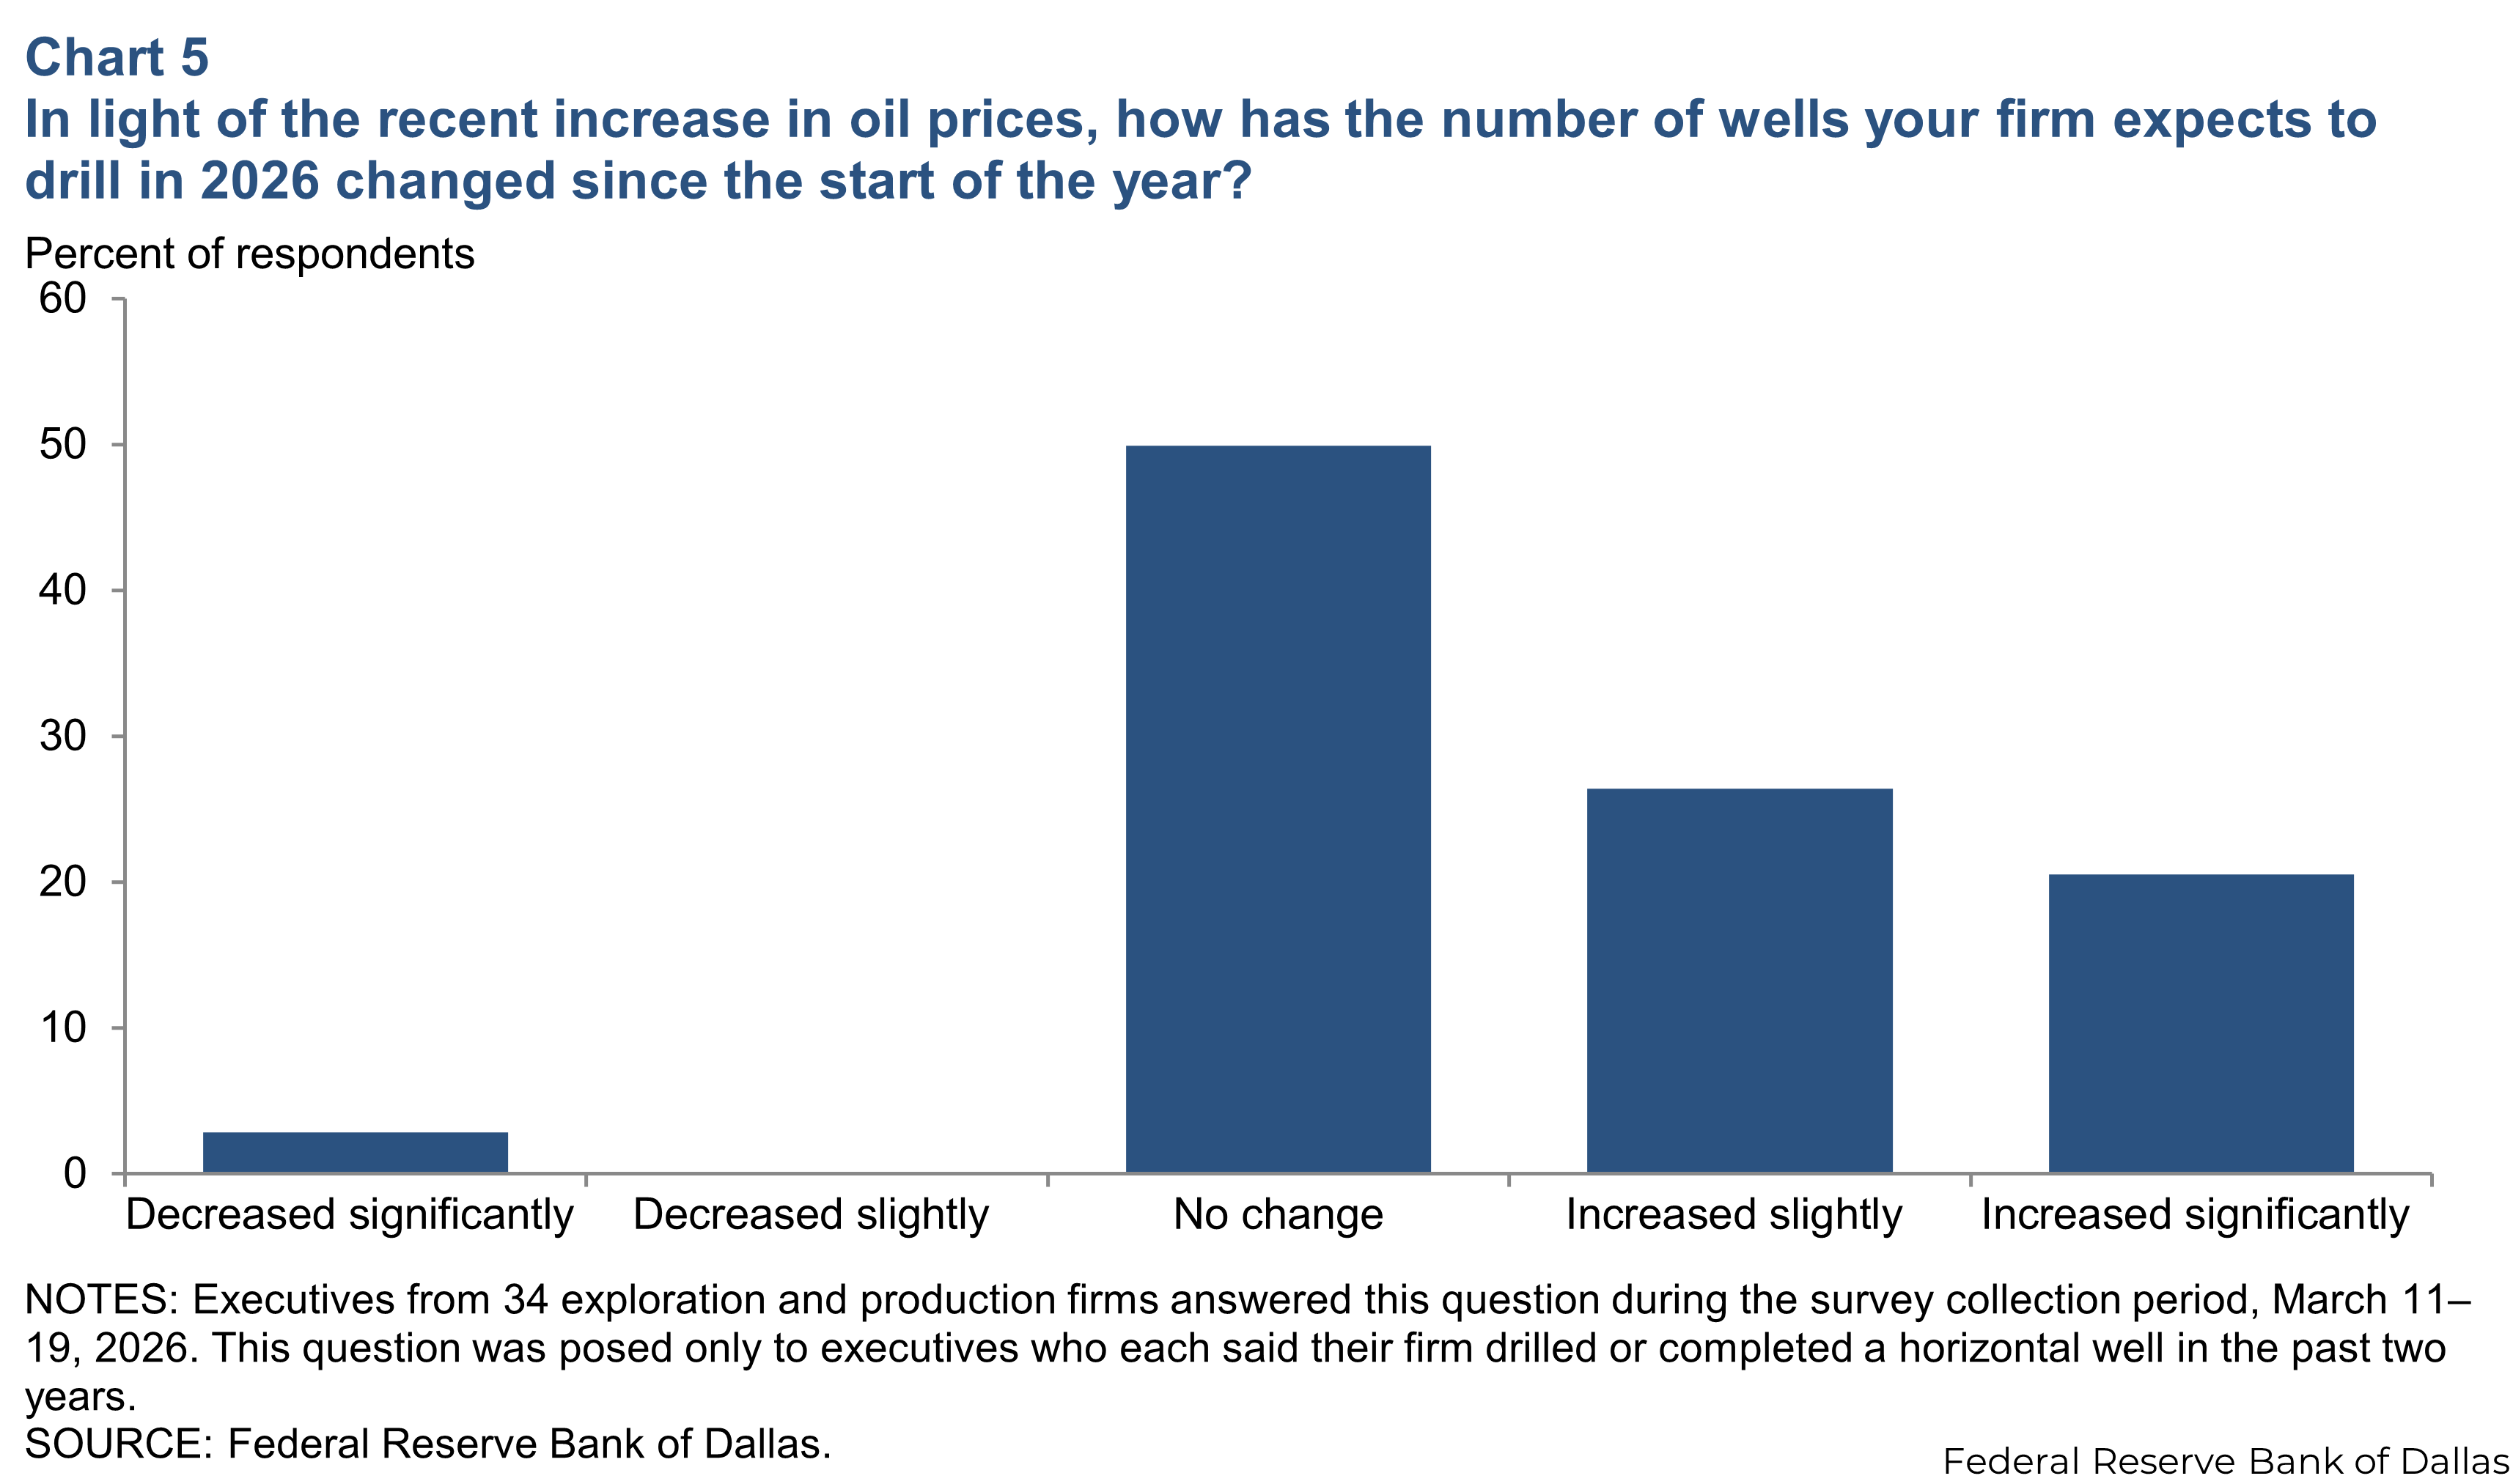
In the most recent Dallas fed energy survey, half of the executives surveyed said the number of wells their firms expect to drill in 2026 has not changed since the start of the year. Twenty-six percent said they expect the number of wells they drill to “increase slightly,” and 21 percent said it would “increase significantly.” Conversely, 3 percent said drilling expectations “decreased significantly” (Chart 5).
This view was largely reaffirmed in the April 23 first quarter survey update. Seventy-five percent of respondents expected either zero or less than 0.25 mb/d of increased crude oil production by the end of 2026 in response to high oil prices.
About Energy Indicators
Questions can be addressed to Adefemi Abimbola or Jesse Thompson. Energy Indicators is released quarterly and can be received by signing up for an email alert. For additional energy-related research, please visit the Dallas Fed’s energy home page.