Haynesville Shale
The East Texas and northern Louisiana counties making up the Haynesville Shale formation came to the public's attention in 2008, when exploration companies began flocking to the region in search of its unconventional gas resources. However, the area has been tapped for conventional oil and natural gas deposits since the start of the 20th century. Using the tabs below, learn more about the history of oil and gas extraction in the Haynesville Shale and drilling's effects on economic activity in the area.
| Highlights |
|---|
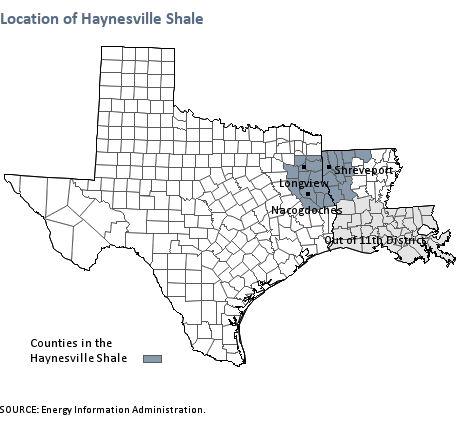
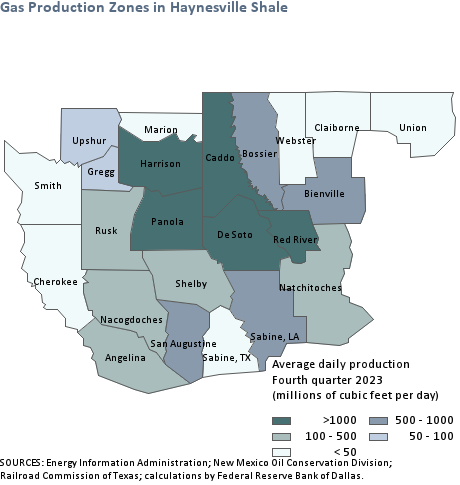
The Haynesville Shale formation covers 23 counties on the border of Texas and Louisiana.[1] The region is rich in natural gas. DeSoto parish in Louisiana leads the region in natural gas production. With over 3.2 billion cubic feet of natural gas production per day in fourth quarter 2024, De Soto parish accounted for 23 percent of the Haynesville's output.[2] Major cities in the Haynesville shale include Shreveport, Longview, and Nacogdoches. |
Notes
- The Energy Information Administration also includes two Arkansas counties in the Haynesville Shale: Columbia, AR and Lafayette, AR. These counties are outside of the Eleventh District. Thus, they are excluded from this analysis.
- For more information on the computation of county-level production, see Energy Data Explanatory Notes and Resources.
The Haynesville Shale underlies a 9,000-square-mile area straddling East Texas and northern Louisiana.[1] The area has produced natural gas and oil through conventional wells for decades. These wells draw oil and gas from part of the Texas-Louisiana-Mississippi Salt Basin. Over the past two decades, drilling activity has focused on both the salt basin and the unconventional resources of the Haynesville Shale.
Before the shale boom
In the conventional deposits of the Texas-Louisiana-Mississippi Salt Basin, oil and gas pool under ceilings of impermeable rock that were pushed up by a rising column of salt.[2] Drillers have used vertical wells to tap these reservoirs since the beginning of the 20th century.[3] In the decades preceding the shale boom, local drillers endured several boom-and-bust cycles. More recently, drilling activity increased from 2002 until the start of 2008, spurred by higher natural gas prices. This led to production growth in many counties in the area.
During the shale boom
The shale boom opened a new chapter in the area's long history of fossil fuel extraction. In contrast to the conventional deposits associated with the salt basin,[4] the unconventional natural gas deposits in the Haynesville Shale remain trapped in a 250-foot-thick layer of rock that lies 2 miles or more below the earth's surface.[5]
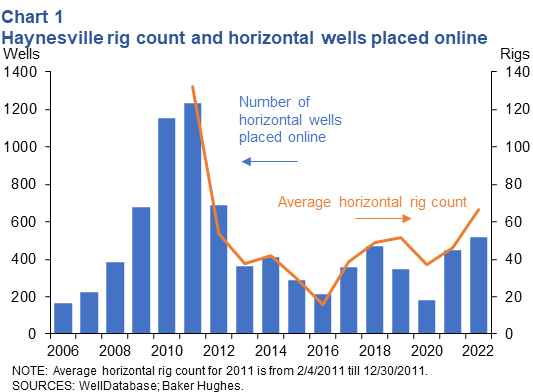
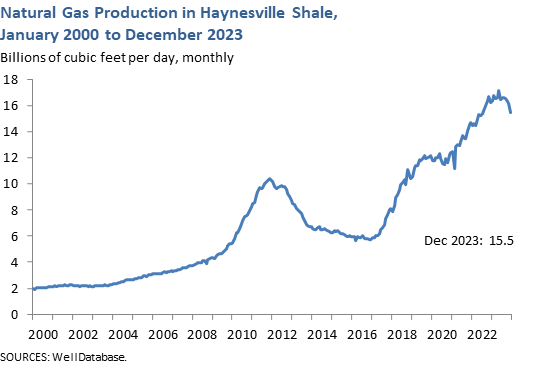
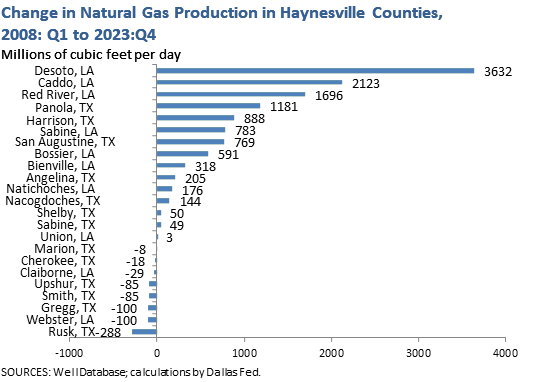
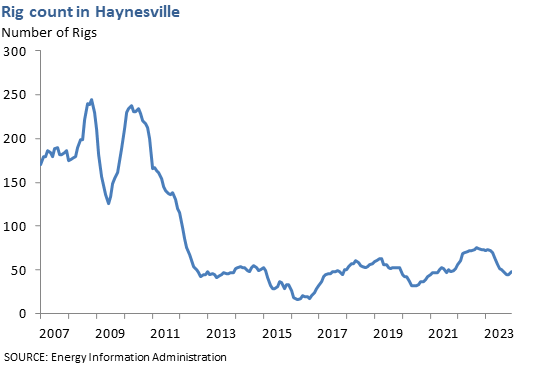
Chesapeake Energy began drilling exploratory wells in the Haynesville Shale in 2006. Combining advances in hydraulic fracturing and horizontal drilling, the company successfully extracted natural gas from the dense rock. Chesapeake released its findings in March 2008. Shortly thereafter, a gold rush atmosphere hit the area, with significant increases in drilling. At the peak in 2011, drillers completed 1231 wells in the Haynesville Shale (Chart 1). Natural gas production skyrocketed in a short period of time, with the increases concentrated in four counties in Louisiana and two in Texas (De Soto, Caddo, Panola, Red River, Harrison and Bossier).
The bust
However, the basin was eventually a victim of its own success and that of other gas producing basins. There was a sharp decline in the price of natural gas post-2008 and this eventually led to slower activity in the Haynesville. One additional challenge is that the Haynesville formation has a depth of over 10,000 feet, which is fairly deep and leads to increased drilling costs.
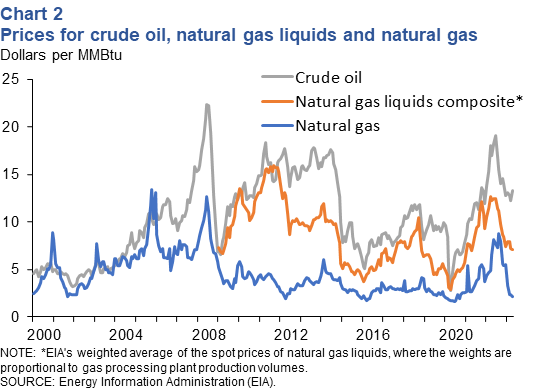
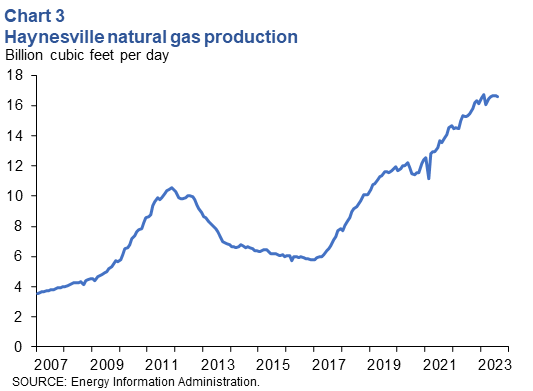
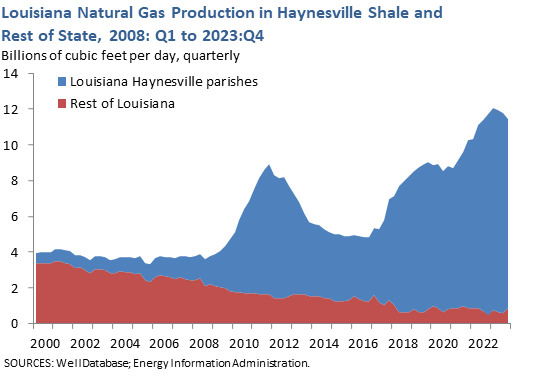
Producers eventually shifted focus to more oil-rich plays, such as the Eagle Ford and the Permian, as both crude oil and NGLs generally sold for more than natural gas post-2008 (Chart 2). The Marcellus basin, a natural gas producing basin, also attracted attention because of the superb economics associated with producing natural gas in that area. Lower activity in the Haynesville eventually led production to decline from 2011-16 (Chart 3).
The resurrection
However, over the same time frame, oil and natural gas companies continued to refine the techniques used to extract hydrocarbons with horizontal drilling and hydraulic fracturing. Some of these advances have paid off particularly well in the Haynesville.
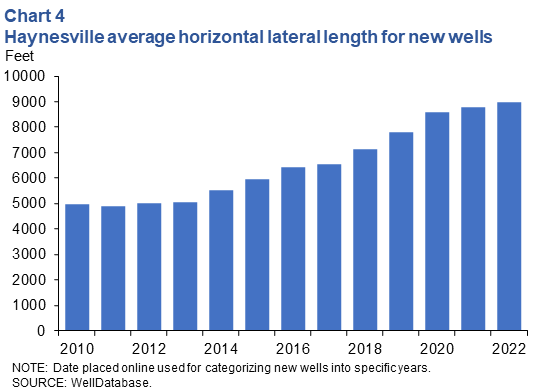
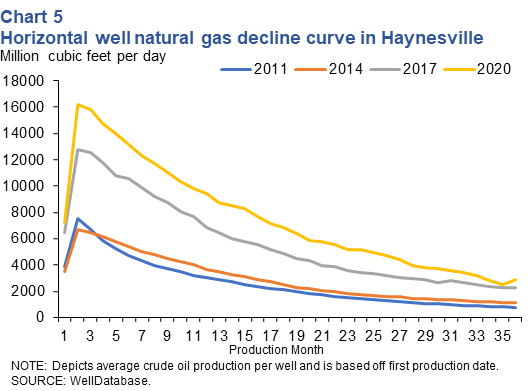
One driver of improving production per new wells was longer laterals (Chart 4). Operators looked to lease contiguous acreage, allowing them to drill lateral lengths near 2 miles long. This allowed operators to reduce the number of wells they drilled to produce the same amount of natural gas, thereby improving well-level economics. Other improvements include increasing proppant volumes and refining well completion design. All of these improvements led to substantial increases in the amount of natural gas produced per new well in the basin (Chart 5). As a result of the improved economics, natural gas production in the basin has skyrocketed since 2016 and is well above the high mark seen during the initial phases of the shale boom (Chart 3).
The Haynesville has also benefited from its geographic location, which has turned out to be a blessing for several reasons. The Gulf coast is home to 6 LNG export facilities (as of 2024) and there are additional facilities which are either under construction or being planned. Growing demand for exports of LNG from these terminals creates a natural source of demand and the basin’s close proximity reduces transportation costs relative to other U.S. basins, particularly the Marcellus.
The Haynesville is also near the southwest Louisiana petrochemicals industry, which has seen notable growth over the prior and current decade. Additionally, the challenge of permitting interstate natural gas pipelines from the Marcellus has made the Haynesville the main viable option among dry basins in the region.
The area has plenty of potential for future growth if the economics are favorable. The U.S. Energy Information Administration estimates that as of 2021 the play still contains roughly 56.2 trillion cubic feet of technically recoverable natural gas.[6] In addition, drillers in the area enjoy a dense network of existing pipelines, helping to reduce midstream expenses. These factors and the strong local demand are likely to contribute to production in the future.
Notes
- Modern Shale Gas Development in the United States: A Primer, U.S. Department of Energy, Office of Fossil Energy, April 2009.
- For more information on how oil and natural gas pool in a salt dome, see geology.com.
- "Discovery of Natural Gas Recalled," Shreveport Times, Dec. 5, 1976, 2-C. Louisiana State University in Shreveport Noel Memorial Library, Archives and Special Collections.
- The Energy Information Administration's Natural Gas Explained describes the differences between conventional and unconventional natural gas deposits.
- Haynesville Shale Fact Sheet, Institute for Energy Research, August 2012.
- U.S. Crude Oil and Natural Gas Proved Reserves, Energy Information Administration.
Production Before the Shale Boom
| Highlights (Pre-Boom) |
|---|
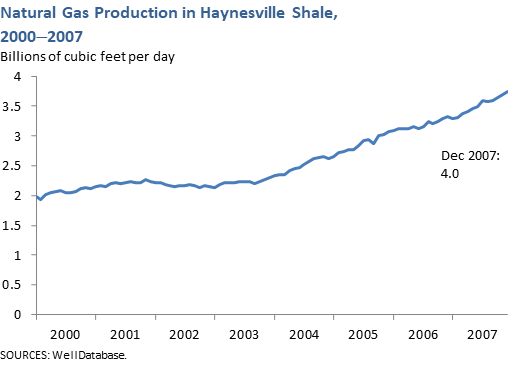
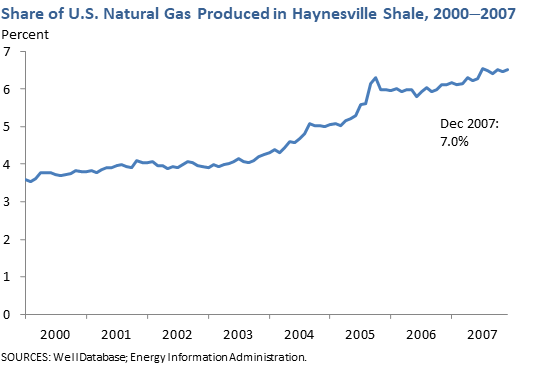
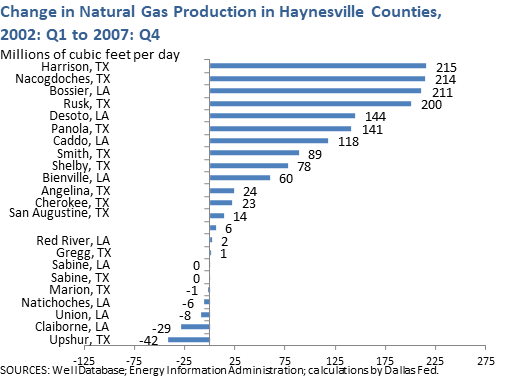
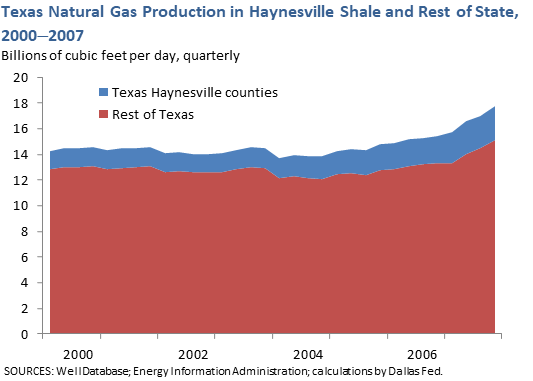
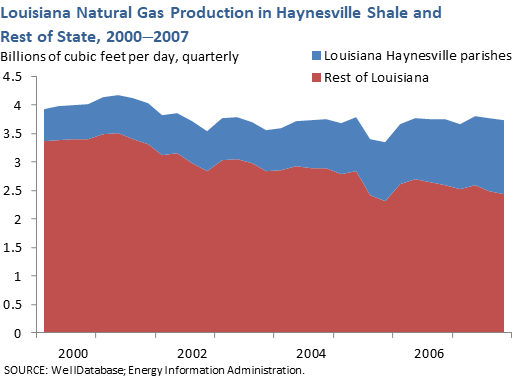
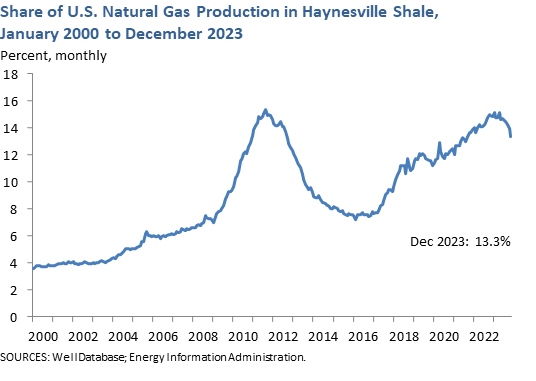
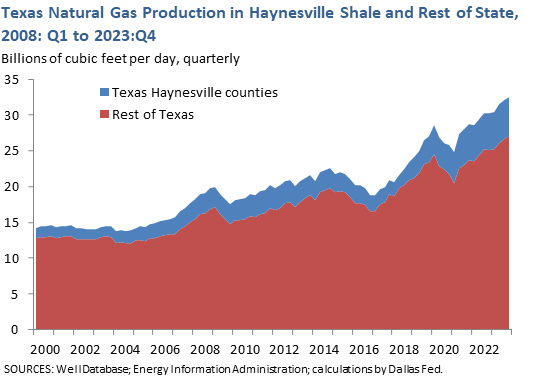
In the years preceding the shale boom, the Haynesville Shale experienced notable increases in natural gas production. As a result of these gains, the share of U.S. natural gas produced in the Haynesville region ticked up 2 percent.[1] Production increased faster in Texas than Louisiana in these years, with Nacogdoches and Harrison counties recording the most significant increases. From first quarter 2002 to first quarter 2008, natural gas production increased by over 900 million cubic feet per day in the Texas Haynesville counties and by 600 million cubic feet per day in the Louisiana Haynesville parishes.[1] |
Production after the Shale Boom
| Highlights (Post-Boom) |
|---|
With the start of the shale boom in 2008, natural gas production in the Haynesville skyrocketed. However, a sharp decline in natural gas prices post-2008 eventually led to slower activity, causing production to decline from 2011-16. Over the same time frame, oil and natural gas companies continued to refine the techniques used to extract hydrocarbons with horizontal drilling and hydraulic fracturing, and that allowed production to increase starting in 2017.[1] Louisiana has recorded one of the strongest natural gas production gains since the shale boom. The Louisiana Haynesville parishes produced around 7.2 billion cubic feet more natural gas in fourth quarter 2024 than in first quarter 2008. DeSoto parish alone accounted for 40 percent of this increase.[1] |
| Natural Gas Production Fourth Quarter 2023 |
||
|---|---|---|
| Cubic feet per day (billions) |
Year/year change (percent) |
|
| Texas | ||
| Haynesville counties | 5 | 0 |
| Louisiana | ||
| Haynesville parishes | 8 | -22 |
| SOURCES: WellDatabase; calculations by Federal Reserve Bank of Dallas. |
||
Notes
- For more information on the computation of natural gas production, see Energy Data Explanatory Notes and Resources.
| Highlights |
|---|
The rig count in the Haynesville is currently lower than the levels seen 2007-10. |
| Rig Count in Haynesville Fourth Quarter 2025 |
||
|---|---|---|
| Number of rigs | Year/year change (rigs) |
|
| Total | 41 | 9 |
| SOURCE: Energy Information Administration; Baker Hughes. | ||
| Highlights |
|---|
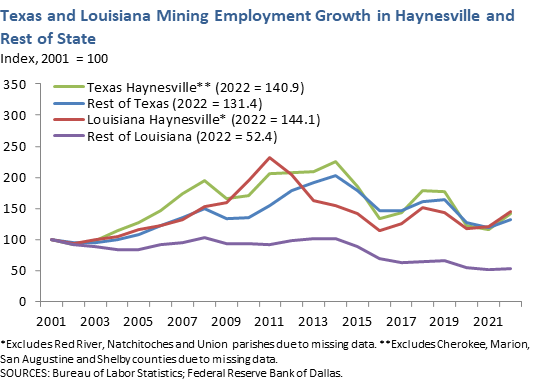
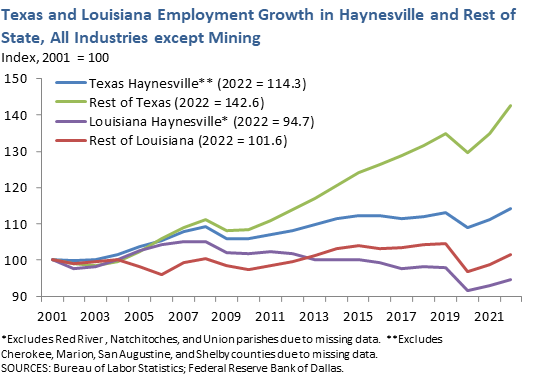
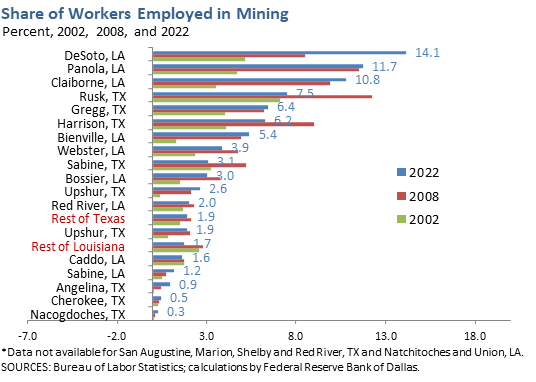
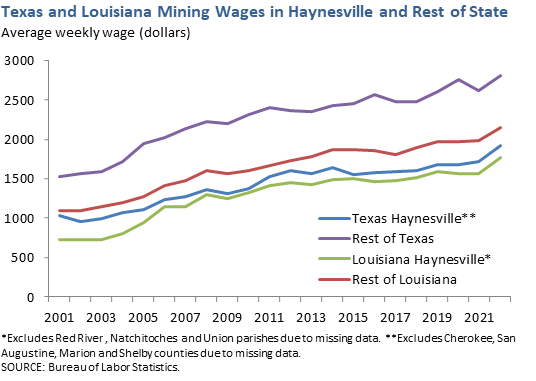
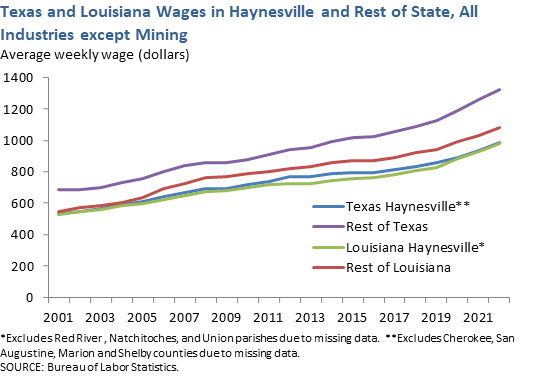
Since 2001, mining employment in the Texas Haynesville counties has grown more than 40 percent; the rest of Texas has also experienced robust employment growth in mining employment.[1] In Louisiana, mining employment in the Haynesville parishes grew rapidly until 2011, but it declined steeply the following two years. Mining employment in the rest of Louisiana remained flat from 2001 to 2014 and has since declined.[2] In both the Texas and Louisiana Haynesville, employment in industries other than mining grew at a much slower pace. As a result of these differences in growth rates, the share of employment in mining increased markedly. The largest increases occurred from 2002 to 2008; mining's share more than doubled in some counties. Since the Haynesville boom began in 2008, mining's employment share has continued growing in some areas. In both mining and industries outside of mining, average weekly wages in the Haynesville are lower than those in the rest of Texas and Louisiana. |
| Employment 2024 Annual Average |
||
|---|---|---|
| Employ- ment (thousands) |
Year/year change (percent) |
|
| Texas | ||
| Haynesville counties | 327 | 0 |
| Rest of Texas | 13,609 | 2 |
| Louisiana | ||
| Haynesville parishes | 207 | 0 |
| Rest of Louisiana | 1,714 | 2 |
| SOURCE: Bureau of Labor Statistics. | ||
| Wages 2023 Annual Average |
||
|---|---|---|
| Average weekly wage (dollars) | Year/year change (percent) |
|
| Texas | ||
| Haynesville counties | $1,076 | 2 |
| Rest of Texas | $1,458 | 4 |
| Louisiana | ||
| Haynesville parishes | $1,071 | 3 |
| Rest of Louisiana | $1,190 | 4 |
| SOURCE: Bureau of Labor Statistics. | ||
Notes
- Mining employment refers to all employment in NAICS 21, which includes mining, quarrying, and oil and gas extraction. The Bureau of Labor Statistics offers more information on this employment category.
- For more information on the interpretation of an indexed series, see Energy Data Explanatory Notes and Resources.
- Energy Data Explanatory Notes and Resources
Explains the computation of state-level and county-level production. - Louisiana Department of Natural Resources
Information about the Haynesville shale and detailed maps and data illustrating current drilling activity in the Louisiana Haynesville parishes. - Railroad Commission of Texas
Offers an overview of the region and detailed data on production and drilling permits for the Texas Haynesville counties. - Natural Gas: Louisiana's Haynesville May Have Overtaken Barnett, Federal Reserve Bank of Dallas, Southwest Economy, Second Quarter 2011.
Brief discussion of production gains and their effects on Louisiana's economy.