Panel 1: Rules of Origin: U.S. Content of Imports, Supply Chains and Trade Diversion
Mexico in the Context of Global Trade Tensions
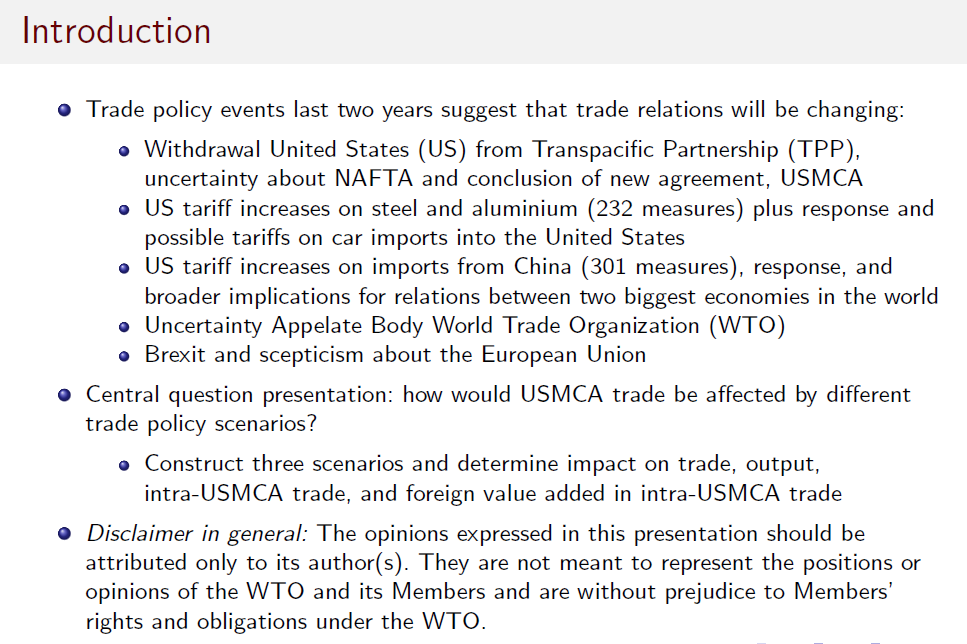
There has been a variety of developments in trade policies in recent years. The U.S. decided not to participate in TPP (the Trans-Pacific Partnership); there was renegotiation of NAFTA (North American Free Trade Agreement); U.S. implementation of Section 332 measures (fact finding related to tariffs and trade); 301 measures (tariffs in response to improper transfer of technology and intellectual property) on China and, of course, responses to all these initiatives.
There is uncertainty about the future of the appellate body of the WTO (World Trade Organization). There is, of course, Brexit and skepticism in other European countries about the European Union. Therefore, the question that could be raised is how trade under the USMCA (United States–Mexico–Canada Agreement, the successor to NAFTA) could be affected by these trade policy events (Chart 1).
Chart 1
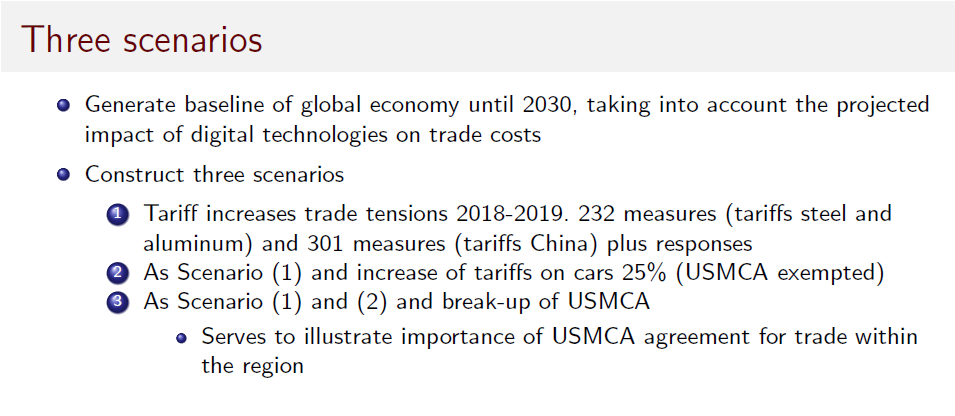
The following three stylized scenarios show the possible effects of recent trade policy changes within the USMCA region.
The first scenario is a realistic scenario that is currently happening: tariffs on steel and aluminum, which are in place since last year, the different 301 measures (tariffs on Chinese goods), plus the responses of China and other trading partners.
In scenario two, we add an increase of tariffs on cars by 25 percent, with USMCA trade exempted. This is not the case so far, but we don’t know yet whether this is going to take place.
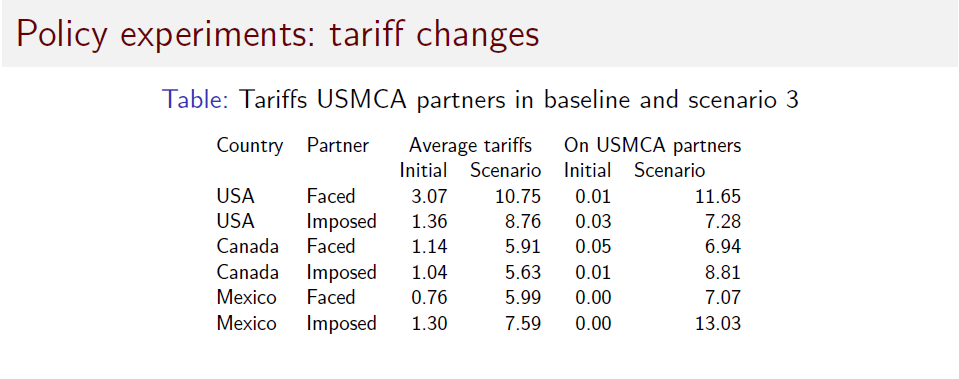
The third scenario shows the value added in the USMCA region and what would happen to global trade if USMCA would break up (Chart 2).
Chart 2
The economic model is a recursive, dynamic CGE model, a “computable general equilibrium” model. The model features intermediate linkages, straight linkages between countries' capital accumulation and investment. The model uses the conventional way to model intermediate linkages. It does not take into account what Alonso de Gortari just presented on auto supply chain ties across North America. Cars exported from Mexico to the U.S. have much more U.S. content than the average exports from Mexico to other countries. Unfortunately, at the global level, we simply don’t have such detailed data.
The baseline for the model includes data aggregated to 24 regions and 25 sectors. We project data out to 2030, imposing macroeconomic projections on our economic model. The macroeconomic projections are from the IMF (International Monetary Fund), including employment, population and GDP (gross domestic product) per capita growth until 2022 or 2023. Then we use United Nations projections and Organization for Economic Cooperation and Development (OECD) projections through 2030. We also use OECD projections for climate change implications.
We have some additional features in the model. In particular, we have differential productivity growth. What does that come down to? Mainly that productivity growth, on average, is larger in agriculture and manufacturing than in services, which is going to lead to a shift in the economy toward services sectors. Then we also account for a change of preferences. We also impose change in savings rates as a function of an empirically specified equation where savings respond through demographics. And finally, we include foreign trade costs.
We also include three types of reactions in trade costs—the interaction of the Trade Facilitation Agreement (expediting movement of goods under the WTO), foreign trade cost because of the extension of e-commerce and the growth of digital technologies.
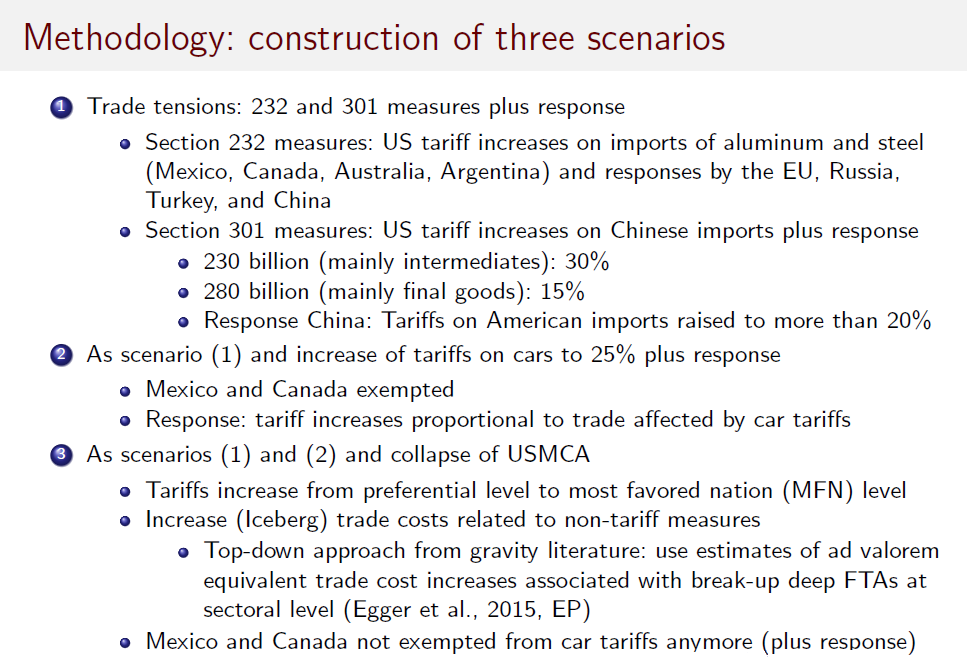
Returning to the three stylized scenarios previously outlined, the first scenario is the realistic scenario, the 232 measures (involving national security and imposition of tariffs) and the 301 measures (involving safeguarding intellectual property and imposition of tariffs) have brought tariffs on imports from China. These tariff packages were announced last year (25 percent) and may possibly grow to 30 percent. There is a new package of tariffs—a 15 percent tariff mainly on final goods. Then, of course, there’s also a response by China. Here I summarize by saying that tariffs on American imports to China are raised to more than 20 percent; but they are about 20 percent currently.
In scenario two, we add tariffs on imports of cars. We exempt Mexico and Canada because that seems to be the realistic scenario. And we include a response. We assume that the response is proportional to the amount of trade, to the amount of cars that countries are exporting to U.S.
The third scenario implies a breakup of USMCA. We assume that tariffs would go to the most-favored nation level under the WTO after the breakup. Then we include an increase in non-tariff measures (NTMs). We use estimates of the average impact of NTMs on free trade agreements in the past and then we convert those estimates into a trade-cost equivalent. In addition, we assumed that the car tariffs would then also be imposed, plus there would be a response (Chart 3).
Chart 3
Emerging countries like China and India are projected to have a much higher GDP per capita growth than countries such as the U.S. or the European Union. In addition, we assume population and labor force aging have actually kicked in (Chart 4). For example, when you look at China, the growth of the labor force between 2018 and 2030 is projected to be negative.
Chart 4
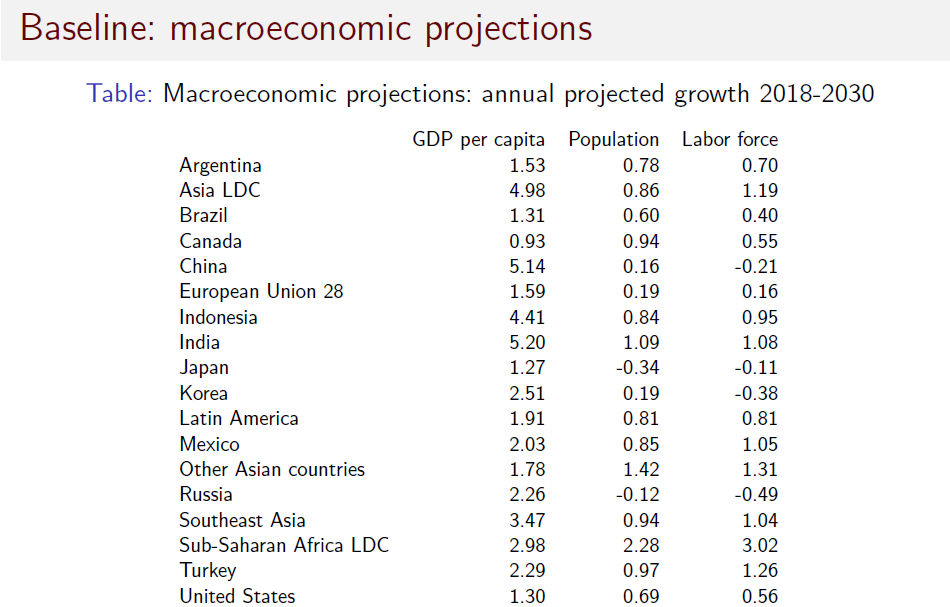
Chart 5 shows the policy experiments from scenarios 1 and 2. Tariffs the U.S. faces will jump from 3.1 percent to more than 7.7 percent once you take into account 232 and 301 measures plus a 25 percent tariff on car imports from the rest of the world outside North America, along with the corresponding retaliation from trading partners. Chart 6 shows tariffs faced by the U.S. if scenarios 1 and 2 are realized, plus the breakdown of the USMCA and the 25 percent tariff on car imports from Mexico and Canada. Tariffs faced by the U.S. will jump to almost 12 percent.
Chart 5
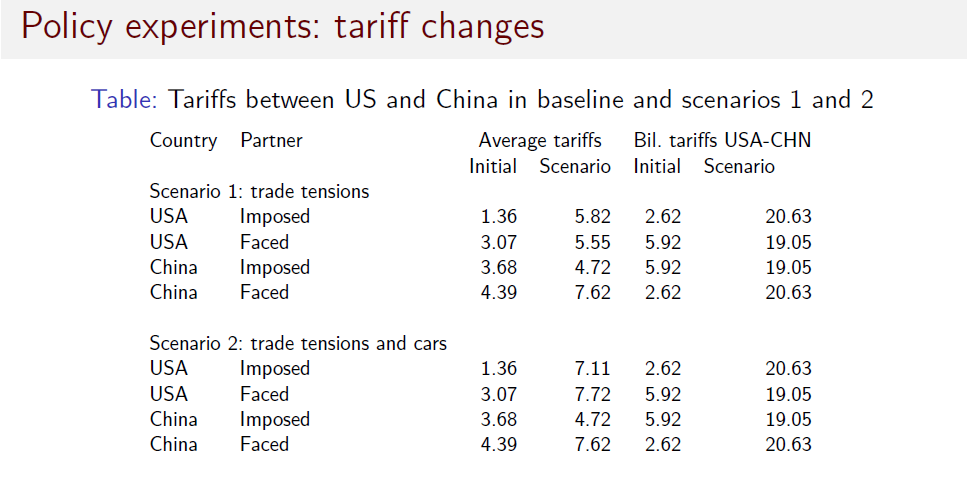
Chart 6
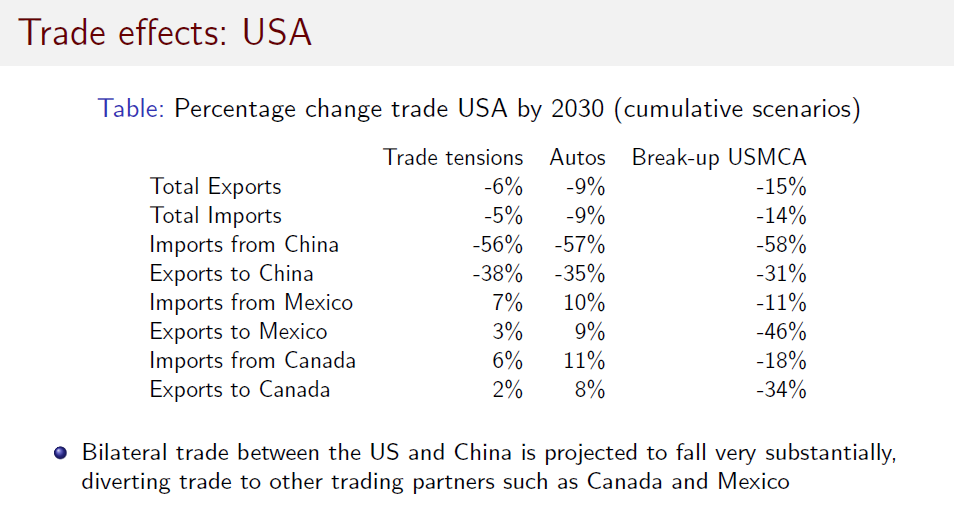
The simulations provide the impact on real exports, real GDP and the change in shares of global trade. According to the simulations, trade will fall by more than 6 percent. If tariffs are imposed on autos, trade will fall 9 percent and even further, 15 percent, if there is a breakup in USMCA. Canada and Mexico will both benefit if trade tensions persist and if auto tariffs are imposed.
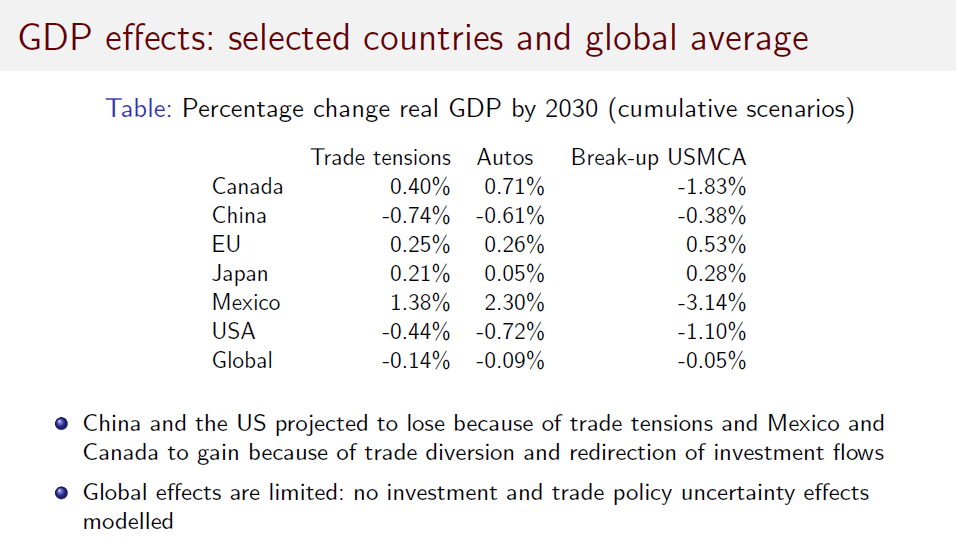
Globally, trade is projected to fall by around 1 percent in the first two scenarios and by about 2 percent with the breakup of USMCA (Chart 7A). In terms of GDP effects, both China and the U.S. will experience a contraction in GDP growth in the three scenarios (Chart 7B). Canada and Mexico will only be negatively affected by the USMCA breakup scenario. As you can see, there are negative implications of continued trade restrictions globally.
It is worth mentioning that these simulations do not take into account effects through investment or policy uncertainty, which could magnify the negative impacts even more.
Chart 7A
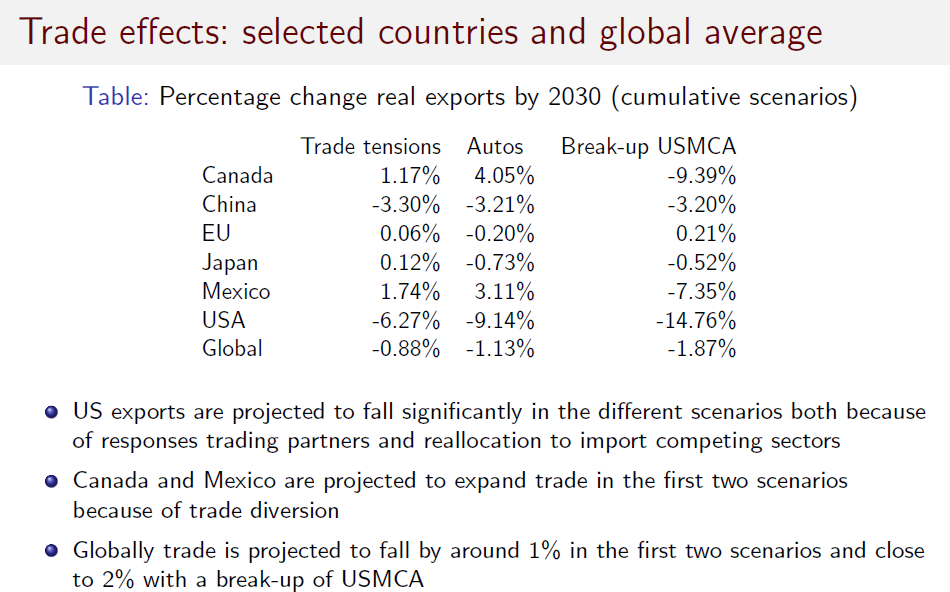
Chart 7B
The results in terms of market share show U.S. market share of world trade will fall from 16 percent to about 14 percent, while China’s will go up to 18 percent. The reason is that trade diversion plays a big role in our models. That means that if China can export less to the U.S., it will start exporting quite a bit more to other markets.
Looking specifically at the U.S., Chart 8 shows that trade between the U.S. and China is projected to fall very substantially, diverting trade to other trading partners, such as Canada and Mexico. The negative effects are magnified if USMCA is not in effect. Additionally, the share of intra-USMCA trade would fall with the breakup of USMCA.
Chart 8