Panel 4: Economic Implications for the U.S. of a North America Without NAFTA or USMCA
Tariffs Only a Fraction of Trade Barrier Costs in Global Supply-Chain Era
What I’m going to talk about really touches on themes that a lot of the earlier speakers already talked about in a lot of detail. I’m just going to go a little bit more high level. One thing I should say is that, as a member of the Dallas Fed, these views are my own and not those of the Dallas Fed or the Federal Reserve System.
I’m going to talk about the implications for the U.S. as well as for Mexico and for Canada of North America without NAFTA (the North American Free Trade Agreement). Just as a background and looking at Mexico’s trade, I wanted to point out a couple of changes in Mexico’s trade following NAFTA. The year before NAFTA, Mexico’s trade with the U.S. was a little under 10 percent of Mexico’s GDP (gross domestic product), and 25 years later, it’s double that as a share of GDP. It’s pretty clear that Mexico and the U.S. are more tightly integrated than before.
In addition, something you can’t tell just from reading that headline number is that a key feature of this increased integration is the increased global value chain (global supply chains)—the idea that production processes are linked sequentially across countries. The way that I think about it is, imported inputs are basically used in production to make goods that are subsequently exported. Some part of the supply chain involves parts and components that are crossing multiple borders while the good is in process. This is an important feature of global supply chains, and I’ll come back to that later.
We have a lot of granular evidence out there, but sometimes you want a national or industry-level number. This is one metric of the extent of global supply chains: It’s the foreign value added from the perspective of a particular country. The foreign value added in, say, a dollar’s worth of exports (Chart 1).
Chart 1
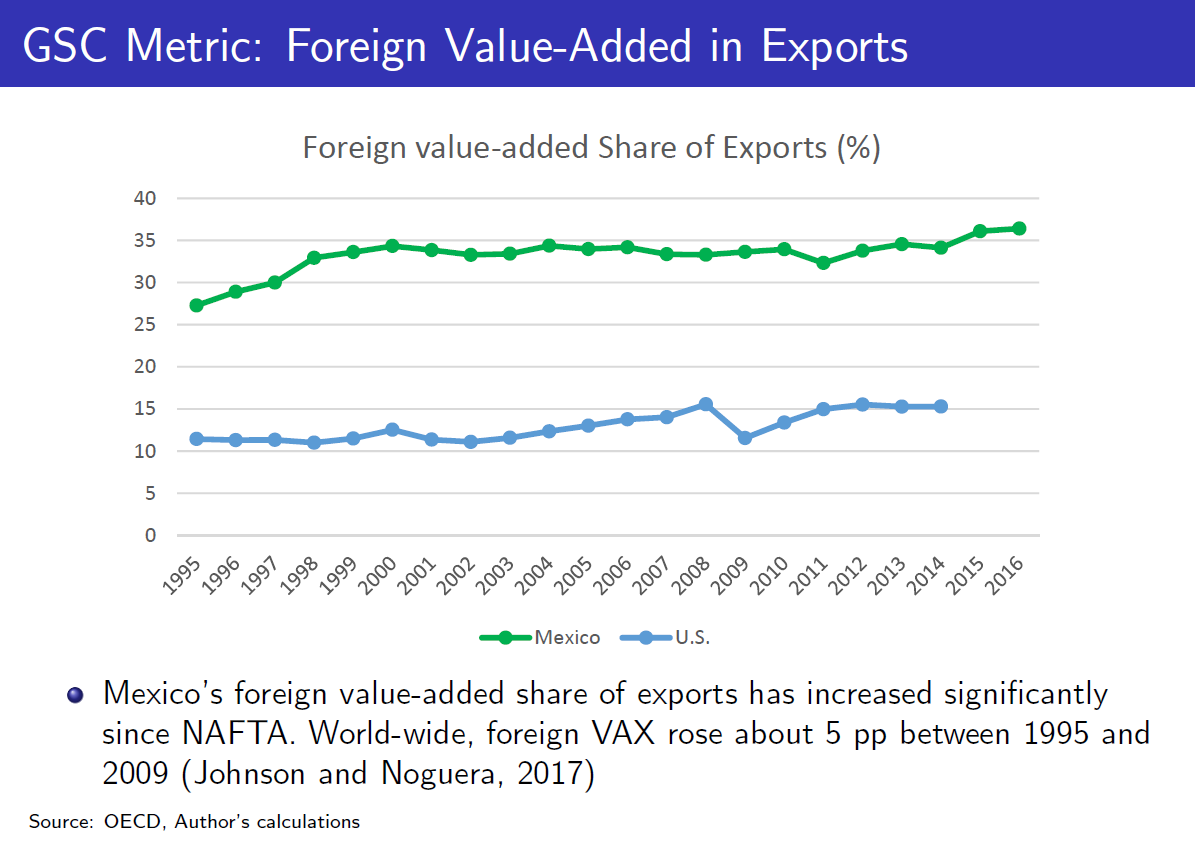
The green line is Mexico, and the time span runs from 1995 to 2016. Right around the time of NAFTA (which began in 1994), roughly 27 cents of every dollar’s worth of Mexican exports represented foreign value added largely from the United States. Since then, it has increased so that, as of 2016, the latest year of these data, it was 36 to 37 cents in every dollar—an increase of 10 percentage points.
We don’t have a definitive cause or reason, but clearly, some of this is due to NAFTA. The United States is in blue (in Chart 1). You wouldn’t expect as much foreign value added embodied in U.S. exports because the U.S. is such a large economy. It has a lot of suppliers within the country. But even in the U.S., that number has increased over time from roughly 11 percent to 15 percent. This is going on globally as well. The bottom line is, firms and entire industries in countries around the world are relying more on imported inputs to make the stuff that they then export.
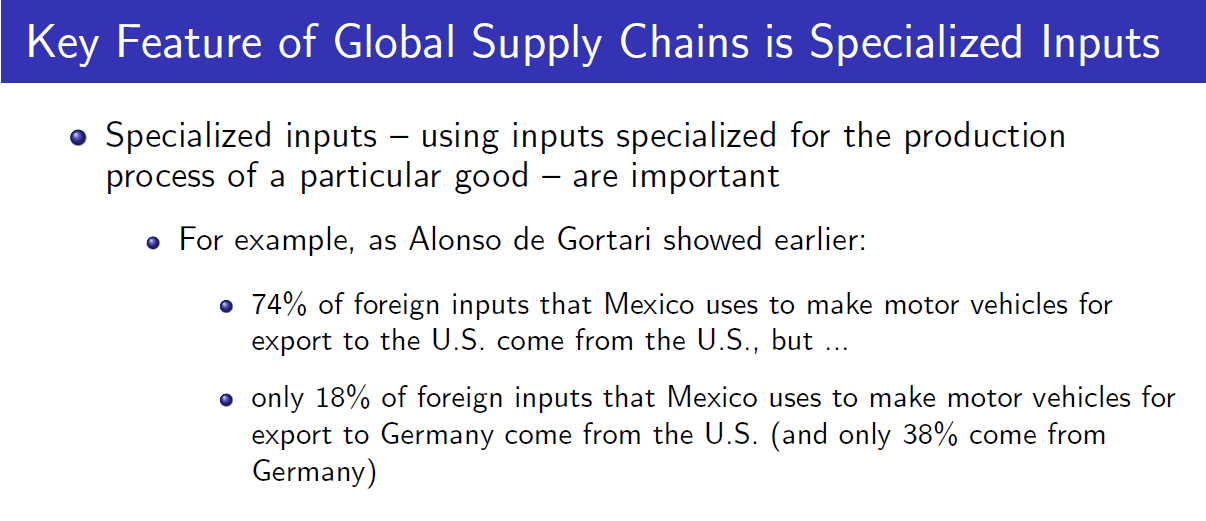
Now, I’m going to get more specifically back to what Alonso de Gortari (of Dartmouth College) talked about. The data that I just showed you comes from particular sources, but that data is too coarse, and is not granular enough to deal with the fact that many global supply chains involve specialized inputs and input specialized for the production process of a particular good. That data is too coarse to capture the examples that Alonzo talked about this morning (during a presentation on cross-border supply chains).
The foreign inputs that Mexico uses to make cars that they then export to the U.S. are very different from the foreign imports that Mexico uses to make cars that are exported to Germany. If you build in that extra granularity, you’ll actually get measures that show an even greater increase in global supply chains, especially for a country like Mexico. It would be useful going forward if we can implement these measures not just for particular goods, but at the national level as well as for industries (Chart 2).
Chart 2
This is the backdrop following the greater trade integration that we all know about—a key part of that greater integration is more global supply chains. Now, we want to get to the question at hand, which is assessing the gains and losses from adding or removing a free-trade agreement and in particular, assessing the effects of, say, canceling NAFTA or the U.S. leaving NAFTA.
I want to just talk about the challenges that economists face in addressing and making these calculations. There are two kinds of calculations or exercises that you would do. One is an after-the-fact calculation: NAFTA happened in 1994; what have been the effects of NAFTA since then on the U.S., Mexico, Canada, etc.?
The key challenge is sorting out the effects of NAFTA from the effects of other events happening at the same time. Recall NAFTA happened in 1994; that was also the year that Mexico had a major financial crisis. Actually, their (Mexico’s) output fell even more then than it did in the Great Recession 10 years ago. During the 1994 financial crisis, the peso depreciated a tremendous amount, which affected their trade flows. It makes it very hard to sort out the specific effect of NAFTA from other things going on. That’s a challenge in doing ex-post analysis.
As I said, there are roughly two kinds of calculations, and I’m going to focus on the kind that virtually all the economists who have talked here today have referred to. I’m going to call it a quantitative theoretical model. In the literature, the jargon is a “computable general equilibrium model.” This is the standard framework that is used to assess the gains or losses from, say, going into a future trade agreement or pulling out of a trade agreement. Now, I should say, parenthetically, they (computable general equilibrium models) haven’t performed well in the past, and that’s why it’s a challenge. In particular, they didn’t perform well in the predictions of NAFTA, especially at the industry and the sector levels. But they are getting better over time. These models are black boxes, and I just want to spend a couple minutes filling back one layer of that black box and just try to explain how they work (Chart 3).
Chart 3
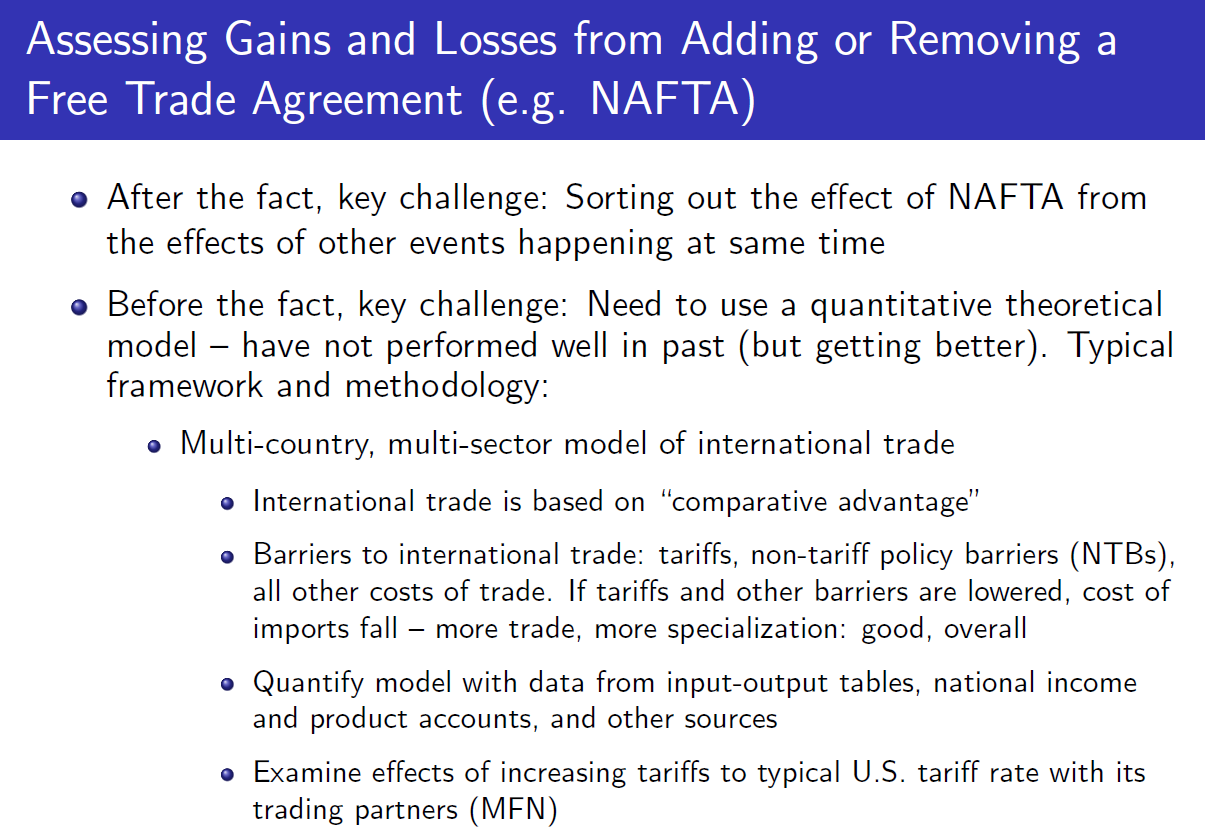
Typically, these frameworks have to have many countries and they have a lot of sectors, and then you have to have a motive for trade in the first place. A lot of these frameworks are based on this famous idea that goes back to David Ricardo, called comparative advantage. The key idea there is that it’s the relative differences in productivity that drive trade, not the absolute differences in productivity, so the fact that the U.S. might be more productive than Mexico in every single good doesn’t mean that the U.S. won’t gain from a trade deal with Mexico. It’s really about relative comparisons.
In these frameworks, since you’re evaluating the effects of trade agreements or the effects of pulling out of a trade agreement, you need to have barriers. Typically, these models have barriers like tariffs and non-tariff policy barriers, which are becoming more important over time because, globally, tariffs in the last 50 years have come down. And then there are other costs of trade, which Christine McDaniel (of George Mason University) alluded to— behind the barriers, behind the border barriers. The basic way these models work is pretty straightforward: If these barriers come down, the costs of imports are just lower. If it’s a broad, across-the-board reduction in barriers, then for everyone, for every country, every firm, every household, the costs of importing are lower, so everybody is importing more. If everybody is importing more, then the other side, of course, is that everybody is exporting more.
What’s happening within a country when you’re importing more and also exporting more? You’re specializing more. You’re getting out of activities that you’re relatively less good at and you’re buying them from abroad, and then you’re focusing more on those activities at which you are relatively good. Those are the activities that you’re exporting.
This actually goes to the idea that specialization is the source of the gains. This idea goes all the way back to Adam Smith; he had the pin factory example of specialization (where workers can produce more pins if the manufacturing is broken down into discrete, specialized tasks). It’s just that idea writ large, but at the national level, that’s the main source of gains from trade.
The next step with these frameworks is, you have to put numbers to them. It’s almost like an engineering exercise. You want to give them numbers or you have to put numbers into the parameters, and then you get data from input/output tables, national product accounts and other sources. Then, you’re basically ready to do a simulation like an analysis of the effects of, say, increasing tariffs in the event that the U.S. pulls out of NAFTA.
I should just say, parenthetically, right now officially, all the tariffs within NAFTA trade are zero. If the U.S pulls out of NAFTA, the standard presumption is tariffs would go up to the typical U.S. tariff rate with its trading partners, which are known as MFN tariffs—most-favored nation tariffs—but as Christine and others have alluded to, there’s no necessary reason why the U.S. would raise them to that level; they could potentially raise them to higher levels.
That’s the way these analytical frameworks worked as was talked about in (Banco de México’s) Daniel Chiquiar’s presentation (on Mexico and global trade tensions) and in the presentation on trade dispute costs by Eddy Bekkers (of the World Trade Organization). Tim Kehoe (of the University of Minnesota), the keynote speaker, also referred to research on that. They all belong to this framework.
So now, I’m going to briefly review the findings from one of these quantitative theoretical models, and it draws from a paper (“The Economics of Revoking NAFTA”) by Raphael Auer, Barthélémy Bonadio and Andrei Levchenko that they did for the IMF (International Monetary Fund). It was specifically about the economic effects of removing NAFTA. These are just a couple of the results. This is the change in real income in each of these three countries from raising tariffs, which are currently zero between the three countries, to MFN levels and reporting two sets of results.
Now, MFN levels are actually not that high—they’re on the order of about 5 percent. There’s a lot of variation across goods. They also have another exercise where they try to implement some of these “behind the border” barriers. NTB stands for non-tariff barrier. There’s another exercise they do— raise a tariff to MFN levels, but then a lot of non-tariff barriers also get imposed between the NAFTA countries. These are the numbers that come out of it (Chart 4).
Chart 4
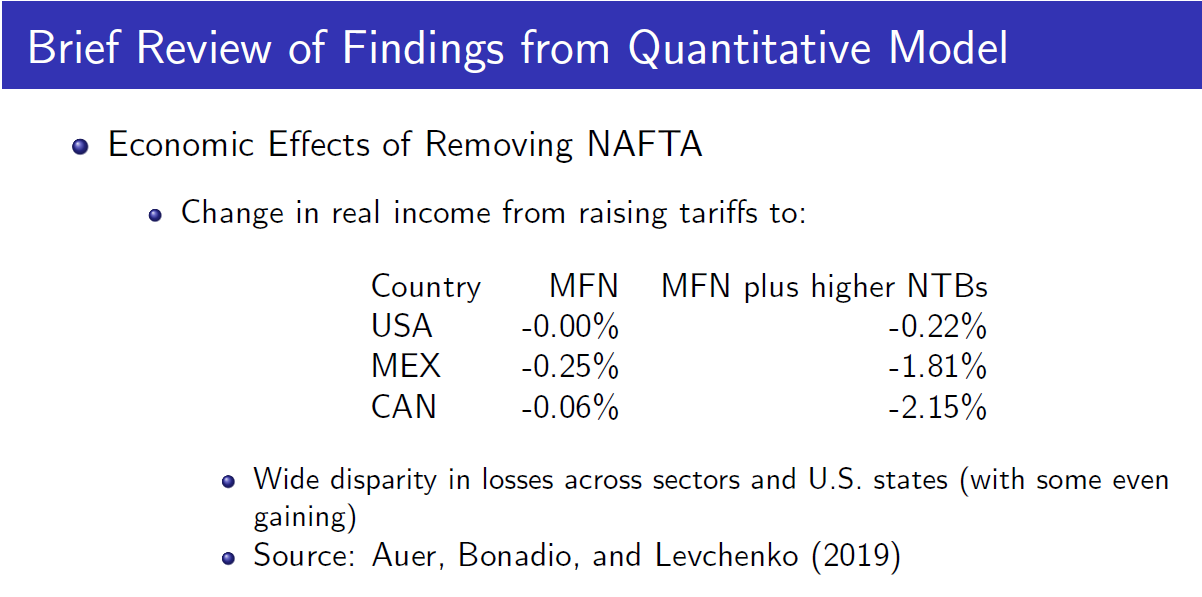
One takeaway is the U.S., as I mentioned earlier and as we all know, has a very large economy, so even though Mexico and Canada are two of the top three trading partners, it’s still a relatively small fraction of U.S. GDP. That’s why the losses to the U.S. are smaller than the losses to Mexico and Canada. I should say, one reason why I chose this study is they also included all 50 states in this—they had about 40 sectors and I’m not reporting all the numbers—but they find a very wide disparity in losses across sectors and across U.S. states.
These overall numbers actually hide the fact that there’s a tremendous disparity. You see, all the numbers here are negative. But, if we looked at the sector level, we would see that pulling out of NAFTA for some sectors would actually be beneficial. To summarize, this study—this quantitative model, which is pretty close to the state of the art—generates interesting and useful findings. That said, it misses on a couple of key things that people have talked about today.
The first, of course, goes back to the global supply chains. The framework that was used for the study I just mentioned doesn’t allow for a global supply chains with specialized inputs. Some of the work that I did a long time ago and, more recently, that Alonzo and his co-author have really generalized and extended in a beautiful way, suggested the losses from higher trade barriers could be magnified. I just heard from him that the number 10 times higher is probably an exaggeration so, I’m going to say 1.5 to two times higher once global supply chains are taken into account. I just want to spend one minute on why that is.
Why are the effects from higher trade barriers magnified? The basic idea is just that, once you have tariffs on both sides of the U.S.–Mexico border, if you’re still going to do a supply-chain thing, then those like parts, like motor vehicle parts that the U.S. sends to Mexico, they’re going to be hit by a tariff once they go into Mexico. Then they get put in a car. When the car comes back to the U.S., the car will be hit by a (another) tariff.
In effect, all of those parts that went to Mexico and came back are hit by a tariff twice. That’s the basic reasoning why the higher tariffs affect global supply chains more negatively than standard conventional trade. The flip side is true, too, in a world where due to technological advances, global supply-chain possibilities are greater than the gains from even a small tariff reduction. That’s the main intuition as to why, once you are in a world of global supply chains, then the effects of higher tariffs can be larger than, say, what you might think if they just go from 0 percent to 5 percent in a standard setting.
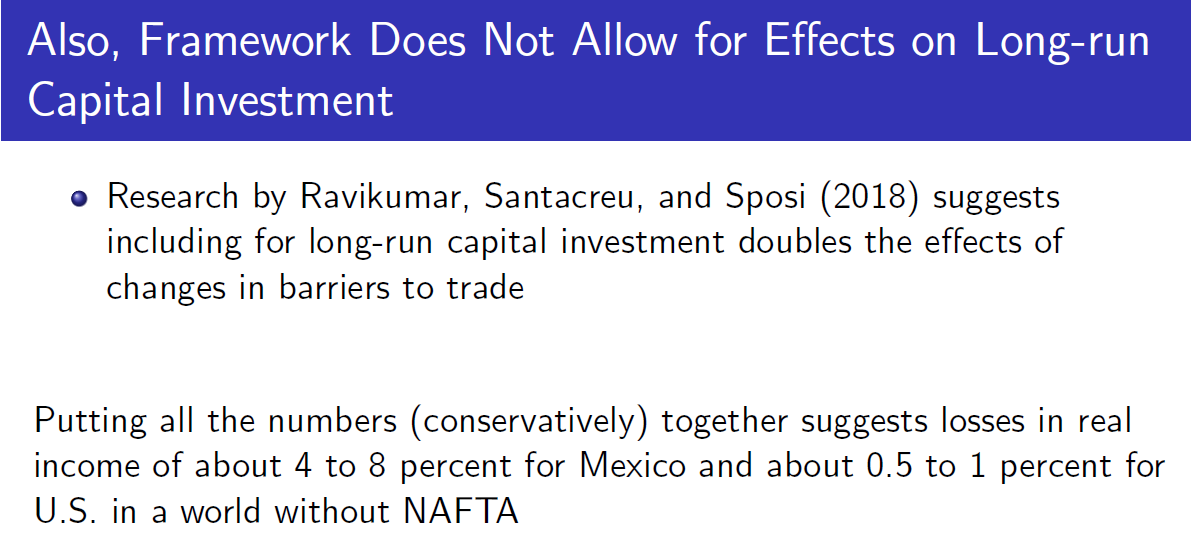
Then there’s one other point that the framework in the study that I alluded to two slides ago doesn’t account for, which is the long-run effects on capital investment. We saw in our energy panel today a lot of discussion about capital investment. If you get rid of a trade agreement, that could affect capital investment, and that’s going to have follow-on effects, negative effects on real income. Some other research by Michael Sposi (of Southern Methodist University) and a co-author say that also could double the magnitude of the effects.
Putting the original numbers from the table that I showed a couple slides ago together with global supply chains and then capital investment, I’m just going to get a rough number (Chart 5).
Chart 5
I want to put those numbers in context. I’m going to put them in the context of the Great Recession. In the Great Recession, U.S. real, or inflation-adjusted, GDP fell 4 percent. This was the worst economic crisis since the Great Depression; so, the worst event in 80-plus years. Another metric, the employment-to-population ratio fell 4 percentage points. In that context, then, pulling out of NAFTA could be like a quarter of the Great Recession.
So, it’s not small potatoes and for Mexico, of course, it would be worse than the Great Recession there (when) inflation-adjusted GDP fell 7.5 percent in the peak-to-trough fall. Pulling out of NAFTA could be the equivalent of a Great Recession event for Mexico.
All of my discussions so far have completely excluded what’s going on in real time. (By that) I mean, this NAFTA pulling-out thing at least for now still appears hypothetical. But what’s going on in real time, of course, is the U.S. trade war with China. If that’s going on and we pull out of NAFTA, then obviously, the losses to the U.S. would be greater, and it would become closer to a Great Recession-type event.
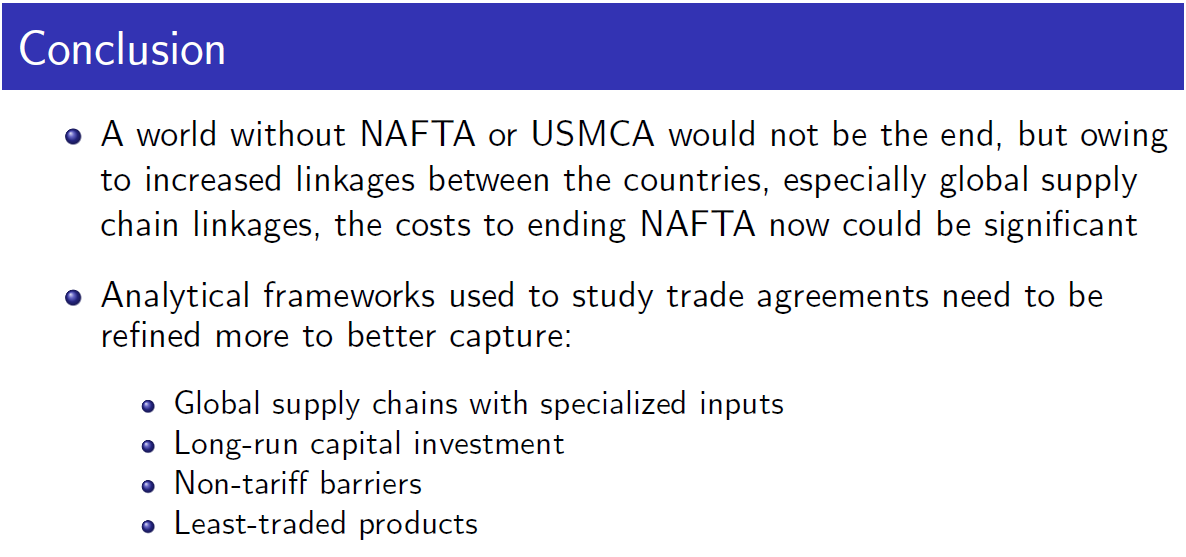
So, that’s it. A world without NAFTA or the USMCA (the United States–Mexico–Canada Agreement) wouldn’t be the end, but owing to increased linkages between the countries, the cost to ending NAFTA now could be significant (Chart 6). I’ve mentioned these analytical frameworks that economists use to study these agreements, and we still need to improve them.
Briefly, the last two bullets (in Chart 6), the non-tariff barriers—for example, labor market regulations or environmental regulations—they may have good consequences, but you do have to factor in the restrictions that they would impose on free-market activity. Research by Tim Kehoe—he didn’t talk about it at lunchtime—shows that a lot of activity tends to happen in what are known as the least-traded products. I think our models need to capture that as well.
Chart 6