Banking Conditions Survey

Loan demand falls and outlooks worsen
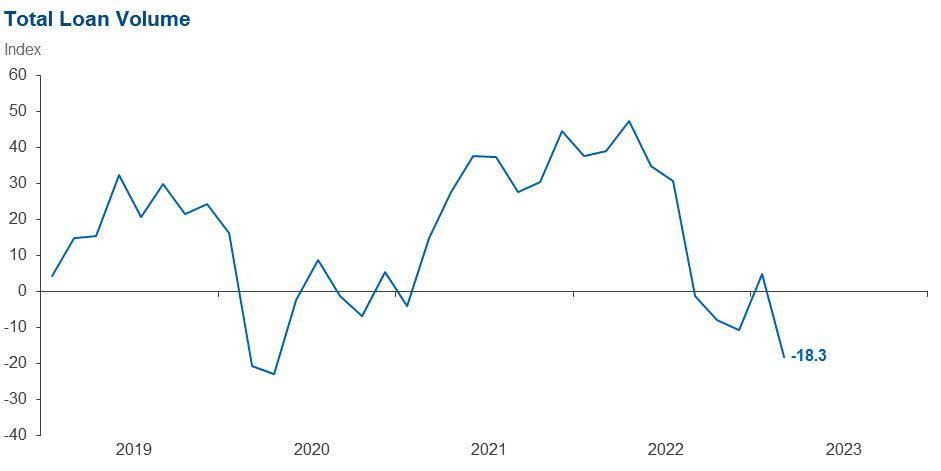
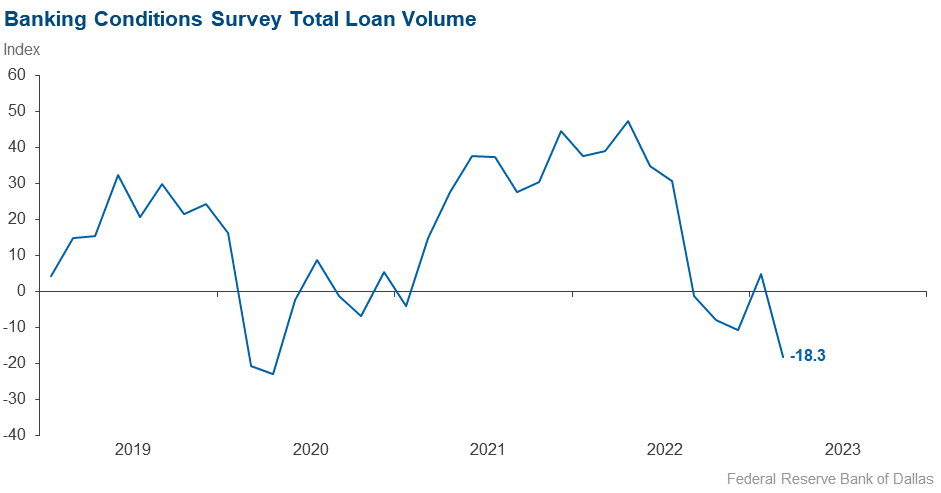
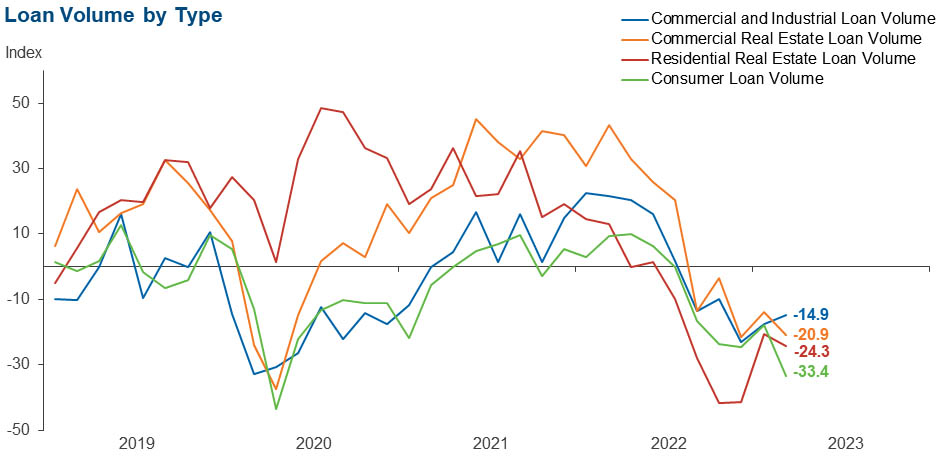
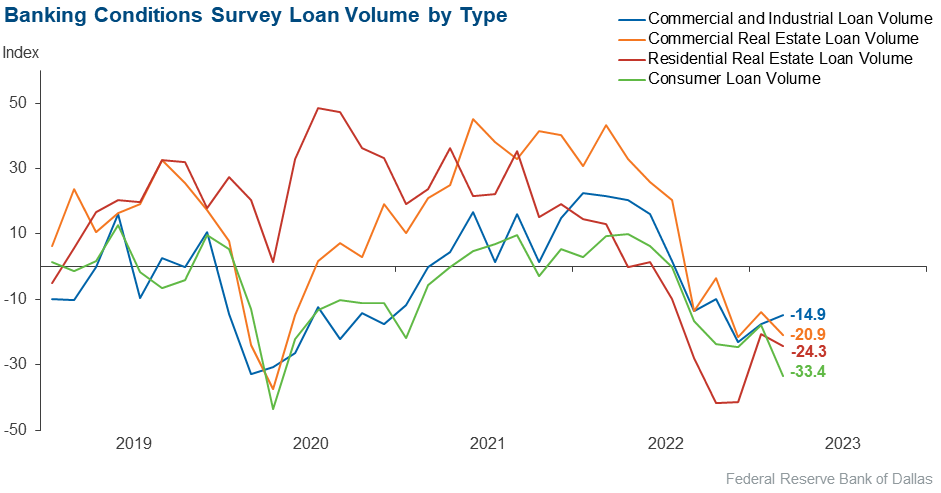
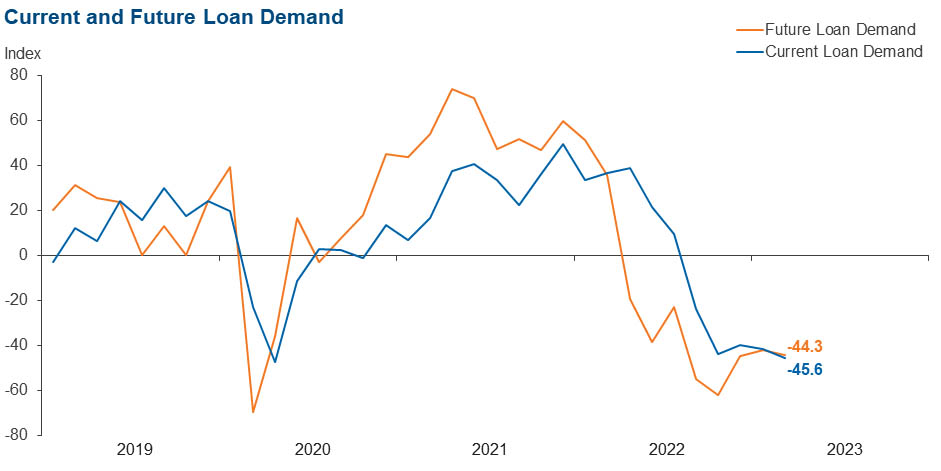
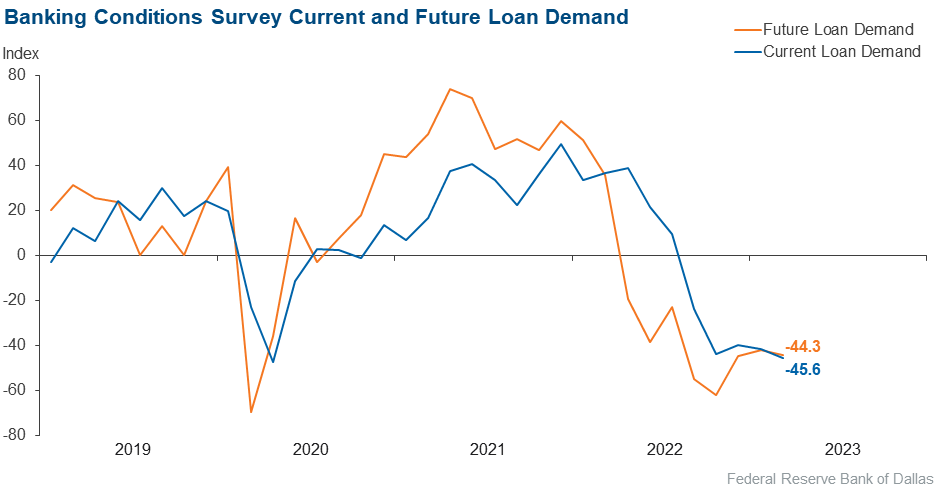
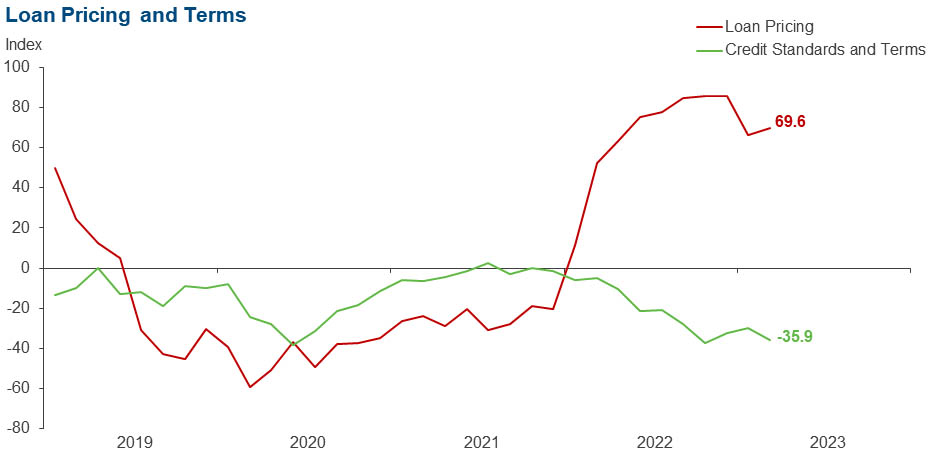
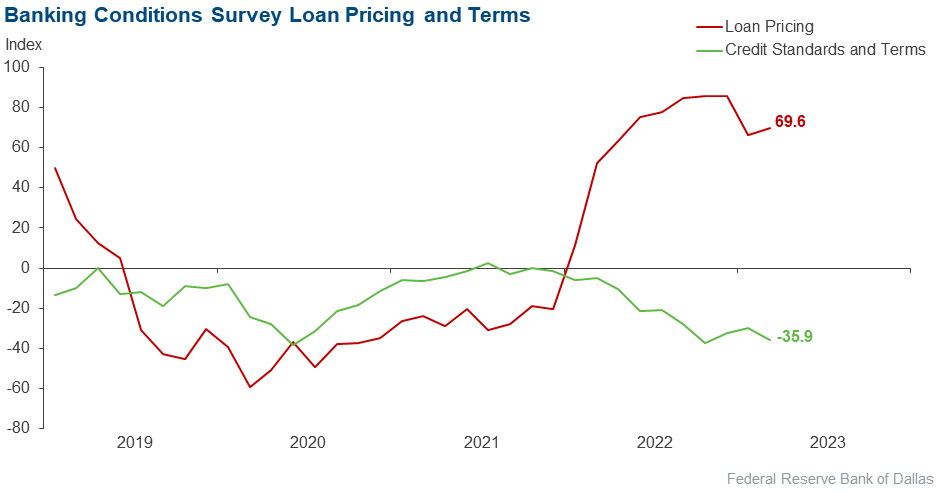
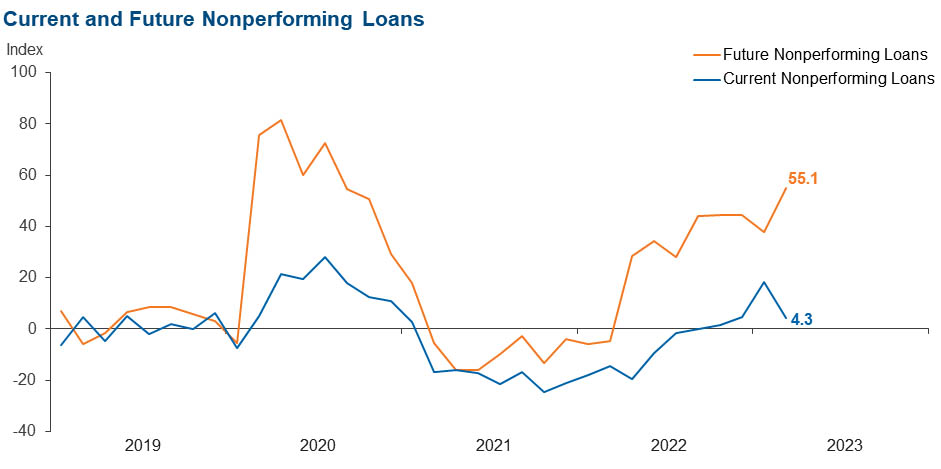
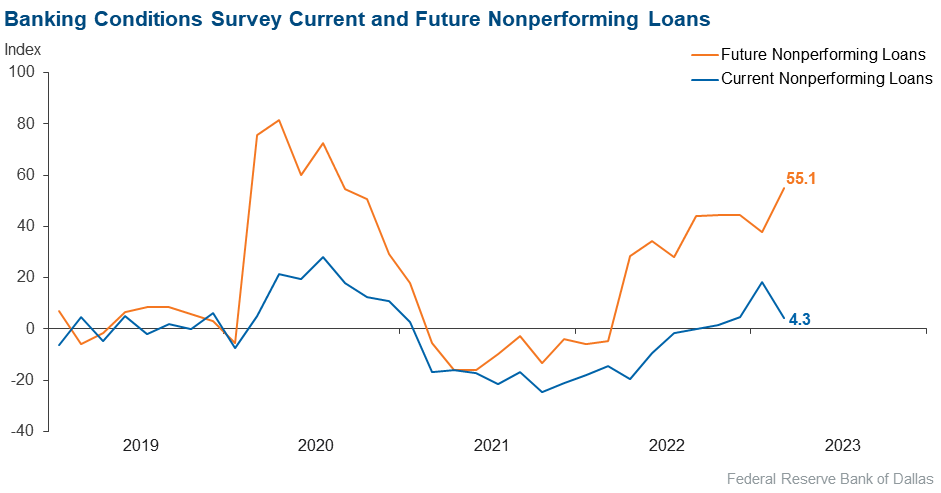
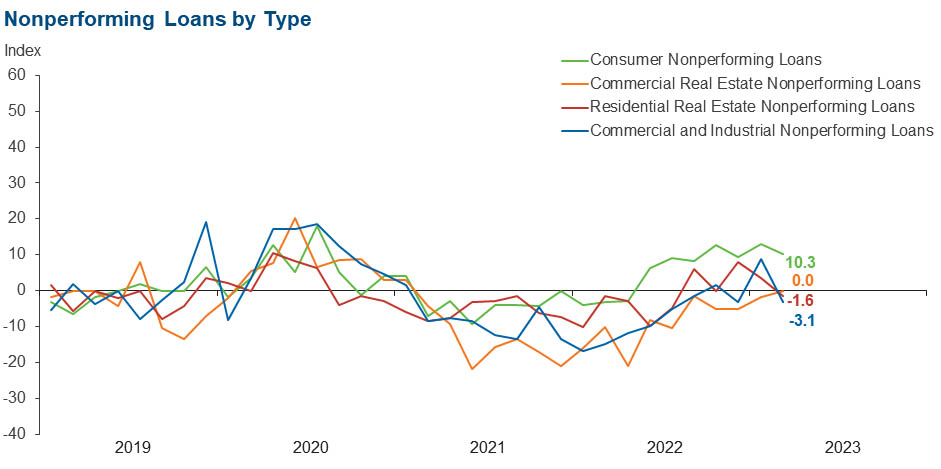
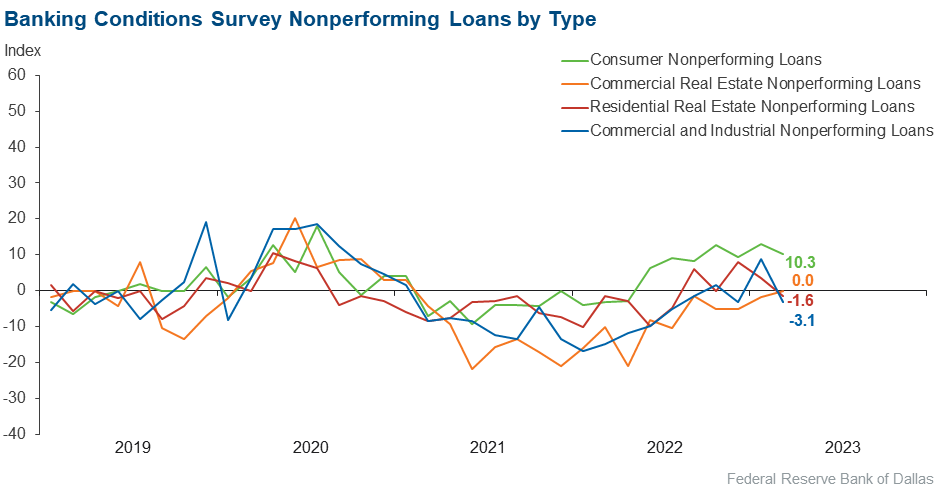
Loan demand declined for the fifth period in a row as bankers in the March survey reported worsening business activity. Loan volumes fell, driven largely by a sharp contraction in consumer loans. Loan nonperformance increased slightly overall, with the only notable rise over the past six weeks coming from consumer lending. Credit standards and terms continued to tighten sharply, and marked rises in loan pricing were also noted over the reporting period. Banking outlooks continued to deteriorate, with contacts expecting a contraction in loan demand and business activity and an increase in nonperforming loans over the next six months. Some contacts cited waning consumer confidence from recent financial instability as a concern.
Next release: May 15, 2023
Data were collected March 21–29, and 71 financial institutions responded to the survey. The Federal Reserve Bank of Dallas conducts the Banking Conditions Survey twice each quarter to obtain a timely assessment of activity at banks and credit unions headquartered in the Eleventh Federal Reserve District. CEOs or senior loan officers of financial institutions report on how conditions have changed for indicators such as loan volume, nonperforming loans and loan pricing. Respondents are also asked to report on their banking outlook and their evaluation of general business activity.
Survey responses are used to calculate an index for each indicator. Each index is calculated by subtracting the percentage of respondents reporting a decrease (or tightening) from the percentage reporting an increase (or easing). When the share of respondents reporting an increase exceeds the share reporting a decrease, the index will be greater than zero, suggesting the indicator has increased over the prior reporting period. If the share of respondents reporting a decrease exceeds the share reporting an increase, the index will be below zero, suggesting the indicator has decreased over the prior reporting period. An index will be zero when the number of respondents reporting an increase is equal to the number reporting a decrease.
Results Summary
Historical data are available from March 2017.
| Total Loans: Over the past six weeks, how have the following changed? | |||||
| Indicator | Current Index | Previous Index | % Reporting Increase | % Reporting No Change | % Reporting Decrease |
Loan volume | –18.3 | 4.8 | 28.2 | 25.4 | 46.5 |
Loan demand | –45.6 | –41.7 | 8.8 | 36.8 | 54.4 |
Nonperforming loans | 4.3 | 18.3 | 12.9 | 78.6 | 8.6 |
Loan pricing | 69.6 | 66.1 | 69.6 | 30.4 | 0.0 |
| Indicator | Current Index | Previous Index | % Reporting Eased | % Reporting No Change | % Reporting Tightened |
Credit standards and terms | –35.9 | –29.8 | 1.6 | 60.9 | 37.5 |
| Commercial and Industrial Loans: Over the past six weeks, how have the following changed? | |||||
| Indicator | Current Index | Previous Index | % Reporting Increase | % Reporting No Change | % Reporting Decrease |
Loan volume | –14.9 | –17.6 | 16.4 | 52.2 | 31.3 |
Nonperforming loans | –3.1 | 8.8 | 3.0 | 90.9 | 6.1 |
| Indicator | Current Index | Previous Index | % Reporting Eased | % Reporting No Change | % Reporting Tightened |
Credit standards and terms | –27.7 | –23.2 | 3.1 | 66.2 | 30.8 |
| Commercial Real Estate Loans: Over the past six weeks, how have the following changed? | |||||
| Indicator | Current Index | Previous Index | % Reporting Increase | % Reporting No Change | % Reporting Decrease |
Loan volume | –20.9 | –14.0 | 22.4 | 34.3 | 43.3 |
Nonperforming loans | 0.0 | –1.8 | 6.1 | 87.9 | 6.1 |
| Indicator | Current Index | Previous Index | % Reporting Eased | % Reporting No Change | % Reporting Tightened |
Credit standards and terms | –31.8 | –26.8 | 3.0 | 62.1 | 34.8 |
| Residential Real Estate Loans: Over the past six weeks, how have the following changed? | |||||
| Indicator | Current Index | Previous Index | % Reporting Increase | % Reporting No Change | % Reporting Decrease |
Loan volume | –24.3 | –20.7 | 21.2 | 33.3 | 45.5 |
Nonperforming loans | –1.6 | 3.5 | 4.6 | 89.2 | 6.2 |
| Indicator | Current Index | Previous Index | % Reporting Eased | % Reporting No Change | % Reporting Tightened |
Credit standards and terms | –10.8 | –6.9 | 1.5 | 86.2 | 12.3 |
| Consumer Loans: Over the past six weeks, how have the following changed? | |||||
| Indicator | Current Index | Previous Index | % Reporting Increase | % Reporting No Change | % Reporting Decrease |
Loan volume | –33.4 | –17.8 | 7.2 | 52.2 | 40.6 |
Nonperforming loans | 10.3 | 12.9 | 11.8 | 86.8 | 1.5 |
| Indicator | Current Index | Previous Index | % Reporting Eased | % Reporting No Change | % Reporting Tightened |
Credit standards and terms | –9.1 | –12.9 | 3.0 | 84.8 | 12.1 |
| Banking Outlook: What is your expectation for the following items six months from now? | |||||
| Indicator | Current Index | Previous Index | % Reporting Increase | % Reporting No Change | % Reporting Decrease |
Total loan demand | –44.3 | –41.9 | 18.6 | 18.6 | 62.9 |
Nonperforming loans | 55.1 | 37.7 | 56.5 | 42.0 | 1.4 |
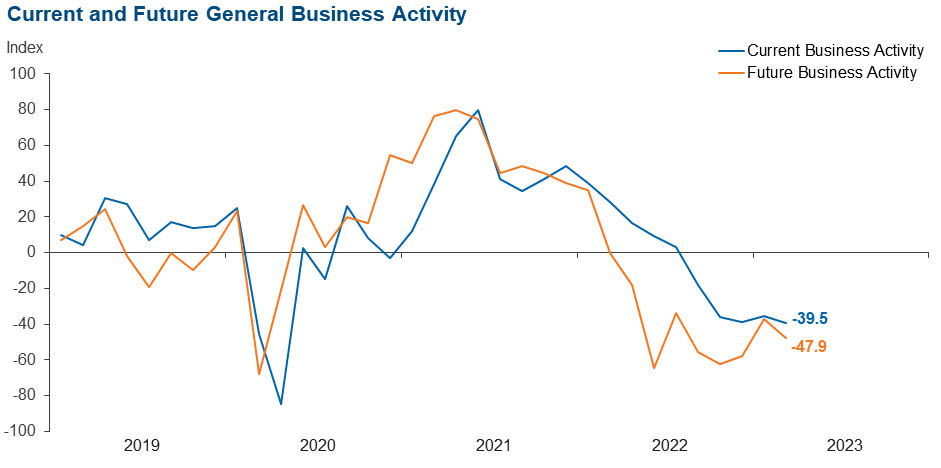
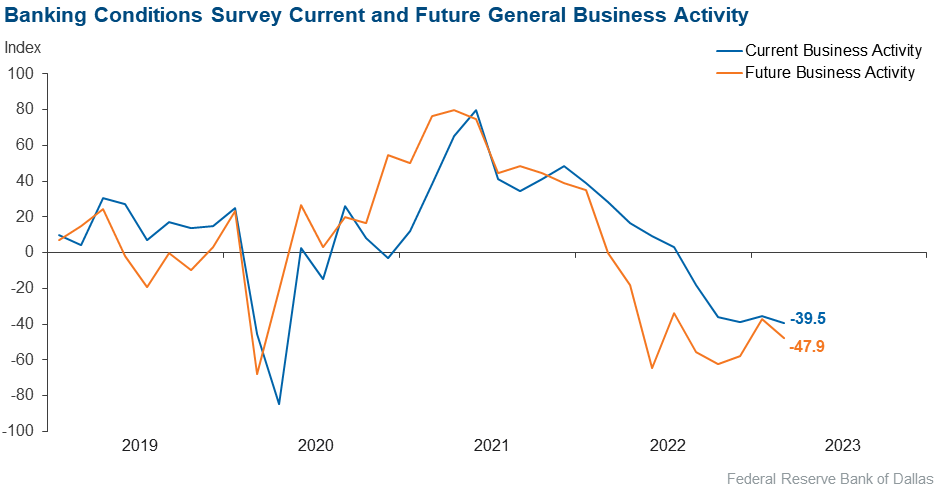
| General Business Activity: What is your evaluation of the level of activity? | |||||
| Indicator | Current Index | Previous Index | % Reporting Better | % Reporting No Change | % Reporting Worse |
Over the past six weeks | –39.5 | –35.4 | 5.6 | 49.3 | 45.1 |
Six months from now | –47.9 | –37.1 | 15.9 | 20.3 | 63.8 |
Comments from Survey Respondents
Respondents were given an opportunity to comment on any issues that may be affecting their business.
These comments are from respondents’ completed surveys and have been edited for publication.
- The macro impact of the failures of Silicon Valley Bank, Signature Bank and Credit Suisse plus the downgrades of several regional banks has resulted in a crisis of confidence in our banking system. The additional macro impact of interest rate hikes has put the economy in a hard-landing recession, in my opinion.
- I think Texas will be isolated to a degree from the slowdown and commercial real estate issues that will affect many major metro markets on both coasts.
- Financial uncertainty in the marketplace and lack of consumer confidence [are issues of concern].
- A run on any Texas bank would be catastrophic. The system is just not built to withstand any pressure like Silicon Valley Bank experienced. I believe we need the markets to settle down, bring trust back to the regional banks and do a complete autopsy on Silicon Valley Bank. There are some lessons to be learned.
- The effects of rising interest rates on balance sheets [are a concern]—as are recent bank failures in the news and the possibility of contagion, the rising debt of the federal government and other possible bank failures internationally.
- Our commercial customers are having sticker shock when their three- or five-year rate adjustments are coming due. Pricing for good commercial loans is getting very competitive.
- We are fortunate to be in a growing market.
Historical Data
Historical data can be downloaded dating back to March 2017. For the definitions, see data definitions.
NOTE: The following series were discontinued in May 2020: volume of core deposits, cost of funds, non-interest income and net interest margin.
Questions regarding the Banking Conditions Survey can be addressed to Emily Kerr at emily.kerr@dal.frb.org.
Sign up for our email alert to be automatically notified as soon as the latest Banking Conditions Survey is released on the web.