Banking Conditions Survey


For this survey, Eleventh District banking executives were asked supplemental questions on outlook concerns, core deposits and lending standards. Read the special questions results.
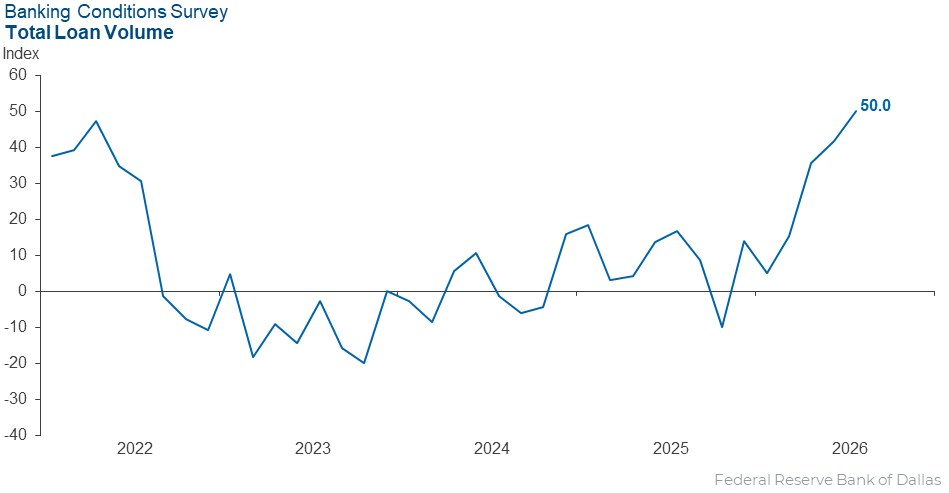
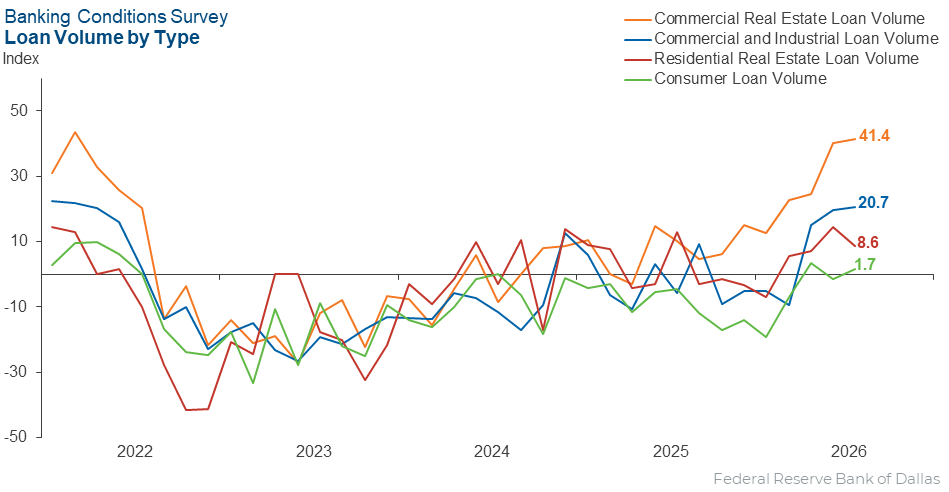
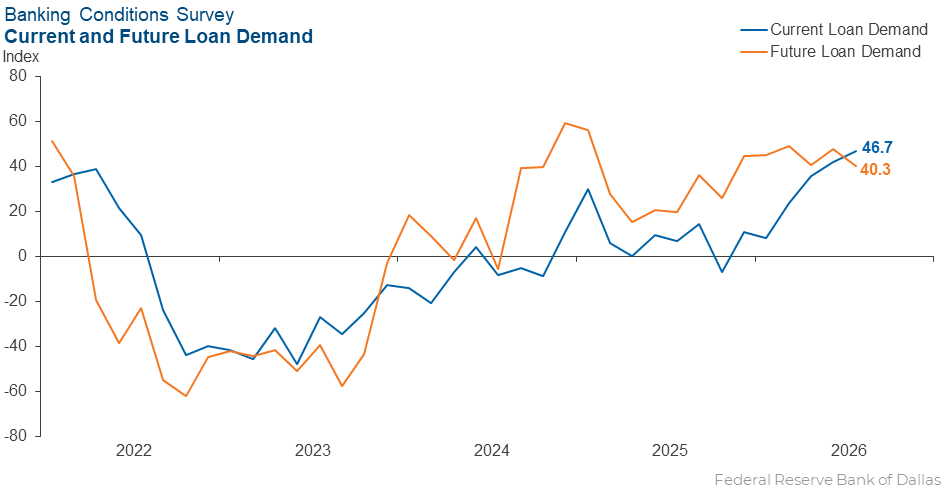
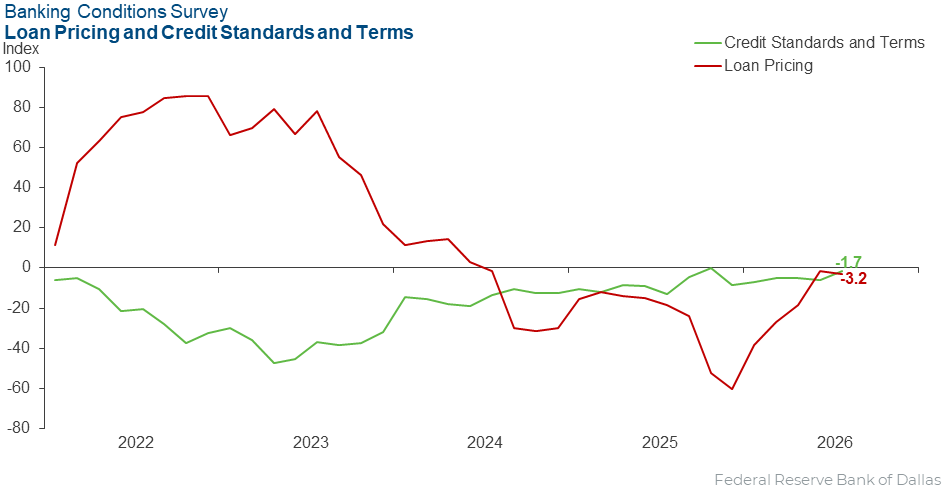
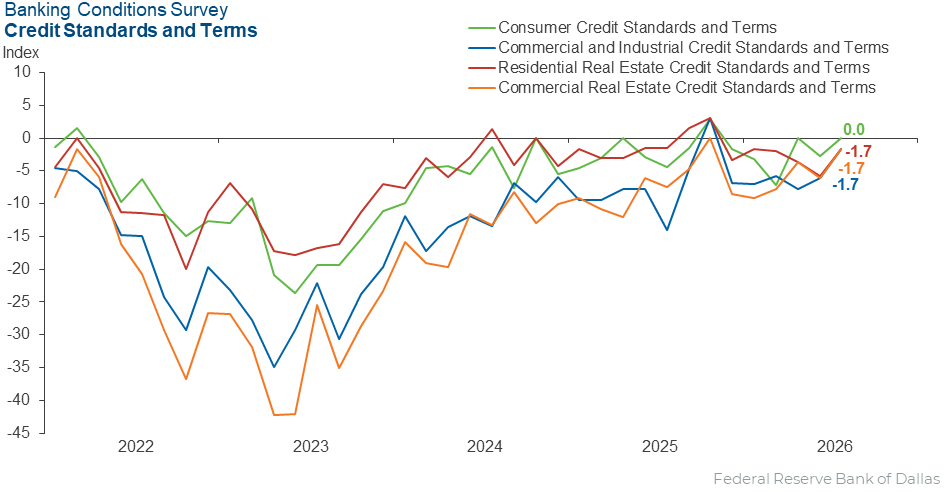
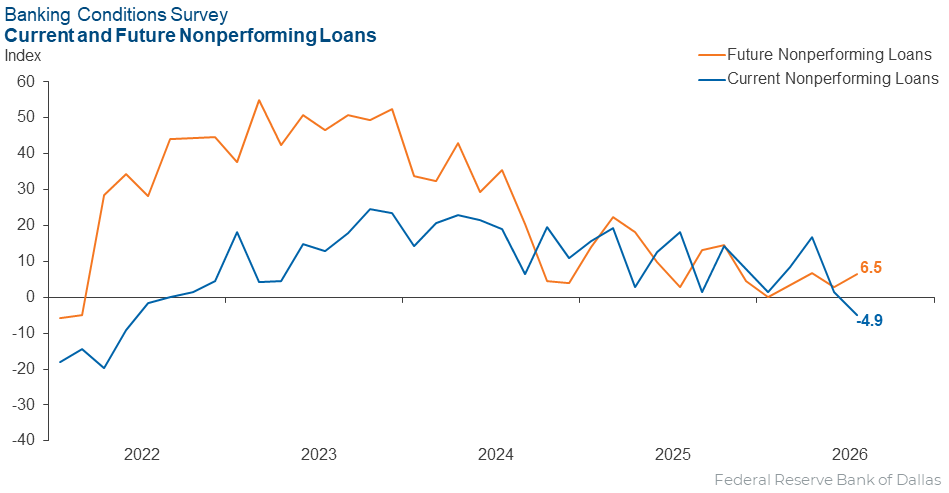
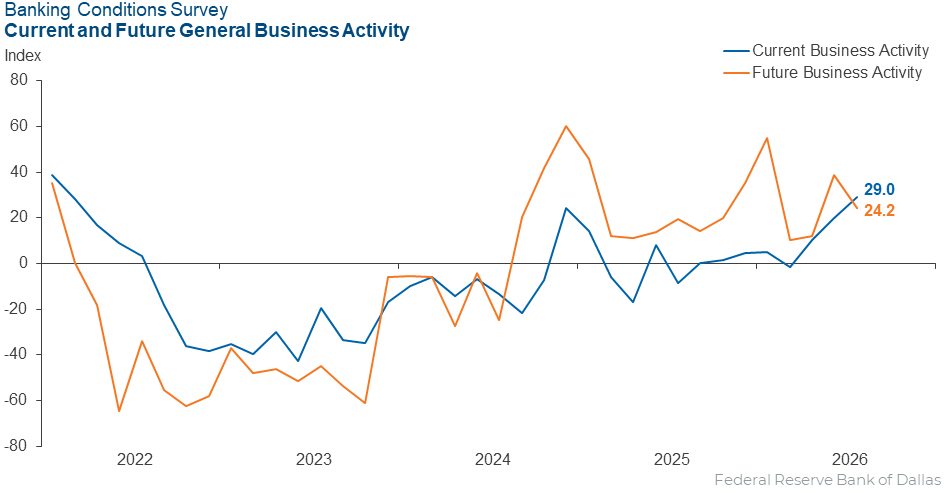
Loan volume and demand continued to grow sizably in August. Volume rose across all loan types. Credit standards and terms tightened slightly, but loan pricing declined. Overall loan performance improved for the first time since 2022. Bankers reported expanding general business activity and remain optimistic about the future. Survey respondents expect strong growth in loan demand and business activity with a very slight deterioration in loan performance six months from now.
Next release: September 28, 2026
Data were collected August 4–12, and 62 financial institutions responded to the survey. The Federal Reserve Bank of Dallas conducts the Banking Conditions Survey twice each quarter to obtain a timely assessment of activity at banks and credit unions headquartered in the Eleventh Federal Reserve District. CEOs or senior loan officers of financial institutions report on how conditions have changed for indicators such as loan volume, nonperforming loans and loan pricing. Respondents are also asked to report on their banking outlook and their evaluation of general business activity.
Survey responses are used to calculate an index for each indicator. Each index is calculated by subtracting the percentage of respondents reporting a decrease (or tightening) from the percentage reporting an increase (or easing). When the share of respondents reporting an increase exceeds the share reporting a decrease, the index will be greater than zero, suggesting the indicator has increased over the prior reporting period. If the share of respondents reporting a decrease exceeds the share reporting an increase, the index will be below zero, suggesting the indicator has decreased over the prior reporting period. An index will be zero when the number of respondents reporting an increase is equal to the number reporting a decrease.
Results summary
Historical data are available from March 2017.
| Total Loans: Over the past six weeks, how have the following changed? | |||||
| Indicator | Current Index | Previous Index | % Reporting Increase | % Reporting No Change | % Reporting Decrease |
Loan volume | 50.0 | 41.7 | 61.3 | 27.4 | 11.3 |
Loan demand | 46.7 | 42.2 | 54.8 | 37.1 | 8.1 |
Nonperforming loans | –4.9 | 1.4 | 14.5 | 66.1 | 19.4 |
Loan pricing | –3.2 | –1.4 | 8.1 | 80.6 | 11.3 |
| Indicator | Current Index | Previous Index | % Reporting Eased | % Reporting No Change | % Reporting Tightened |
Credit standards and terms | –1.7 | –5.9 | 5.1 | 88.1 | 6.8 |
| Commercial and Industrial Loans: Over the past six weeks, how have the following changed? | |||||
| Indicator | Current Index | Previous Index | % Reporting Increase | % Reporting No Change | % Reporting Decrease |
Loan volume | 20.7 | 19.7 | 25.9 | 69.0 | 5.2 |
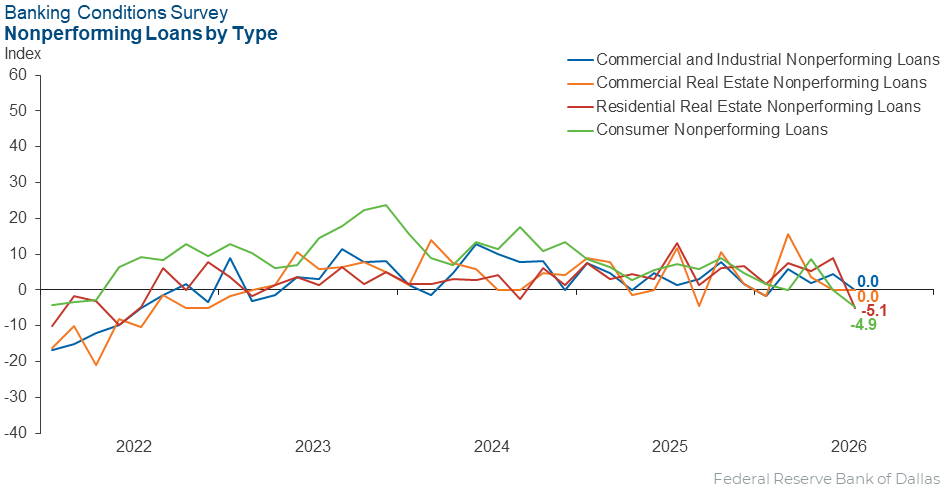
Nonperforming loans | 0.0 | 4.5 | 8.6 | 82.8 | 8.6 |
| Indicator | Current Index | Previous Index | % Reporting Eased | % Reporting No Change | % Reporting Tightened |
Credit standards and terms | –1.7 | –6.1 | 1.7 | 94.8 | 3.4 |
| Commercial Real Estate Loans: Over the past six weeks, how have the following changed? | |||||
| Indicator | Current Index | Previous Index | % Reporting Increase | % Reporting No Change | % Reporting Decrease |
Loan volume | 41.4 | 40.3 | 50.0 | 41.4 | 8.6 |
Nonperforming loans | 0.0 | 0.0 | 10.3 | 79.3 | 10.3 |
| Indicator | Current Index | Previous Index | % Reporting Eased | % Reporting No Change | % Reporting Tightened |
Credit standards and terms | –1.7 | –6.1 | 5.2 | 87.9 | 6.9 |
| Residential Real Estate Loans: Over the past six weeks, how have the following changed? | |||||
| Indicator | Current Index | Previous Index | % Reporting Increase | % Reporting No Change | % Reporting Decrease |
Loan volume | 8.6 | 14.5 | 29.3 | 50.0 | 20.7 |
Nonperforming loans | –5.1 | 8.8 | 5.2 | 84.5 | 10.3 |
| Indicator | Current Index | Previous Index | % Reporting Eased | % Reporting No Change | % Reporting Tightened |
Credit standards and terms | –1.7 | –5.8 | 0.0 | 98.3 | 1.7 |
| Consumer Loans: Over the past six weeks, how have the following changed? | |||||
| Indicator | Current Index | Previous Index | % Reporting Increase | % Reporting No Change | % Reporting Decrease |
Loan volume | 1.7 | –1.4 | 19.7 | 62.3 | 18.0 |
Nonperforming loans | –4.9 | 0.0 | 6.6 | 82.0 | 11.5 |
| Indicator | Current Index | Previous Index | % Reporting Eased | % Reporting No Change | % Reporting Tightened |
Credit standards and terms | 0.0 | –2.8 | 0.0 | 100.0 | 0.0 |
| Banking Outlook: What is your expectation for the following items six months from now? | |||||
| Indicator | Current Index | Previous Index | % Reporting Increase | % Reporting No Change | % Reporting Decrease |
Total loan demand | 40.3 | 47.9 | 54.8 | 30.6 | 14.5 |
Nonperforming loans | 6.5 | 2.8 | 24.2 | 58.1 | 17.7 |
| General Business Activity: What is your evaluation of the level of activity? | |||||
| Indicator | Current Index | Previous Index | % Reporting Better | % Reporting No Change | % Reporting Worse |
Over the past six weeks | 29.0 | 19.7 | 38.7 | 51.6 | 9.7 |
Six months from now | 24.2 | 38.6 | 41.9 | 40.3 | 17.7 |
Survey participants are given the opportunity to submit comments on current issues that may be affecting their businesses. Some comments have been edited for grammar and clarity.
- A firm is building a $50 billion data center where we have three branches within 40 miles, and it’s producing lots of activity in our markets.
- One of our biggest concerns is increasing rates, which put pressure on our margins. Other concerns are the November midterm election and the stabilization of oil prices.
- We believe that the Federal Open Market Committee (FOMC) will try to transition back to a 1990s-era FOMC. Treasury yields will continue to be elevated, and any discussion of a ceasefire with Iran will be just talk. These will all slow the economy and put downward pressure on inflation. We will go into a slowdown, and the FOMC will not step in to lower rates until it is too late.
- Hiring of two new loan officers from another local bank due to [mergers and acquisitions].
- Multifamily is beginning to revert to how the business was always meant to operate. Multifamily was always a get-rich-slow business, but the 2010–2022 period was the anomaly, not the norm. The market seems to be returning to the fundamentals, though there is still pain to come.
- High level of uncertainty affecting ability to plan going forward. Experiencing lower credit risk in some areas and higher in others, with some signs of overextension by a small number of borrowers. That said, overall credit risk lower than historic levels, with no indication of material cause for concern.
- The national economy and regional water issues [are our top concerns.]
Historical data can be downloaded dating back to March 2017. For the definitions, see data definitions.
NOTE: The following series were discontinued in May 2020: volume of core deposits, cost of funds, non-interest income and net interest margin.
Questions regarding the Banking Conditions Survey can be addressed to Mariam Yousuf at mariam.yousuf@dal.frb.org.
Sign up for our email alert to be automatically notified as soon as the latest Banking Conditions Survey is released on the web.