Special Questions

Special Questions
August 27, 2018
Results below include responses from participants of all three surveys: Texas Manufacturing Outlook Survey, Texas Service Sector Outlook Survey and Texas Retail Outlook Survey.
Texas Business Outlook Surveys
Data were collected Aug. 14–22, and 358 Texas business executives responded to the surveys.
See data files with a full history of results.
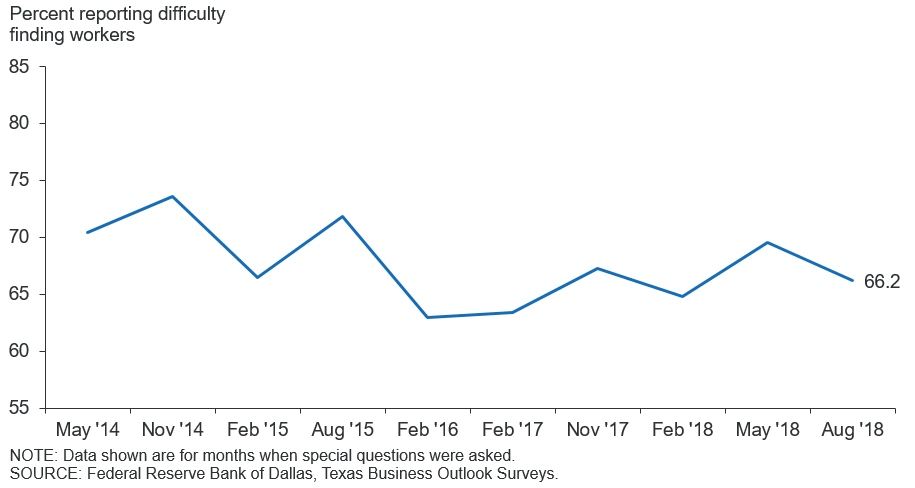
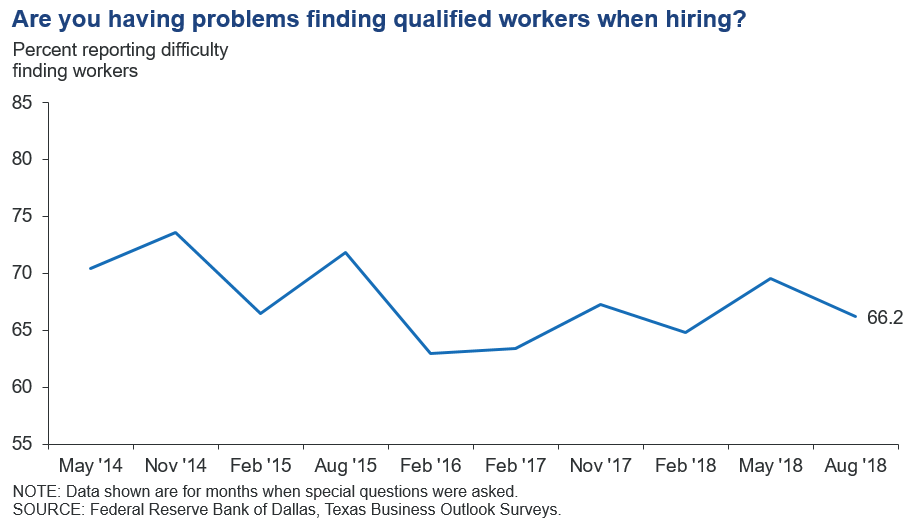
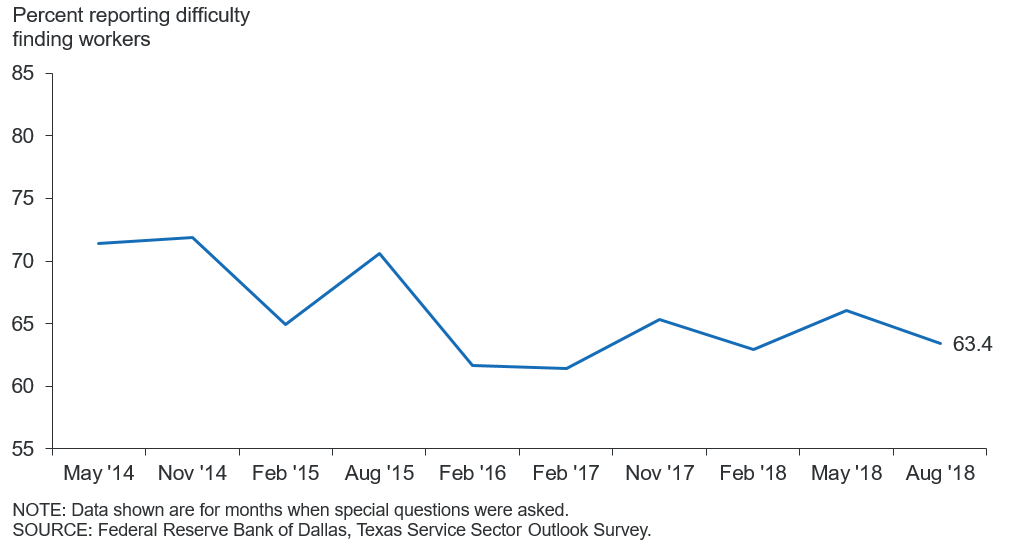
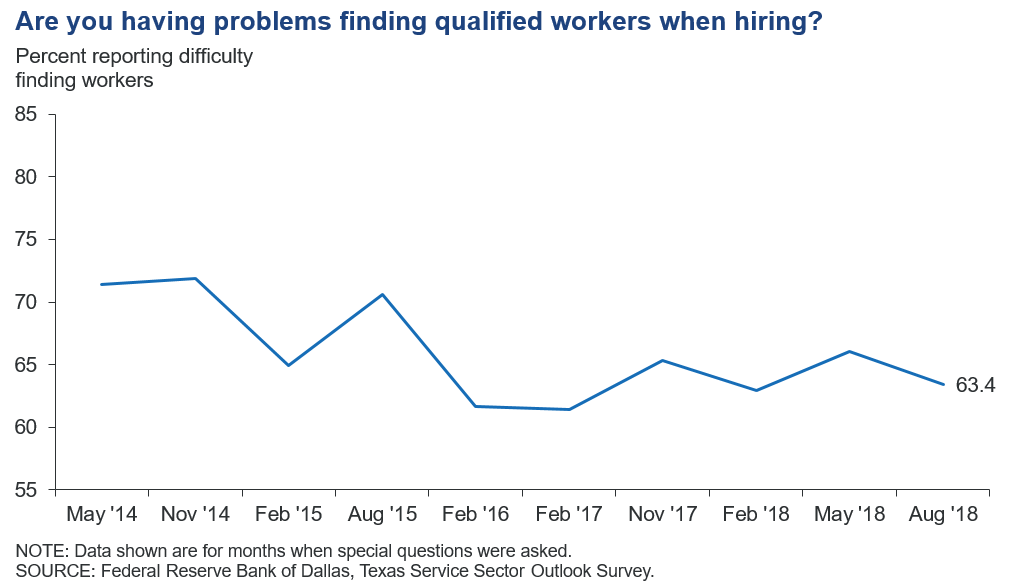
Are you having problems finding qualified workers when hiring?
| Nov. ’17 (percent) |
Feb. ’18 (percent) |
May ’18 (percent) |
Aug. ’18 (percent) |
|
| Yes | 67.3 | 64.8 | 69.5 | 66.2 |
| No | 32.7 | 35.2 | 30.5 | 33.8 |
If you are having problems finding qualified workers, in which categories are you experiencing difficulty? Please check all that apply.*
| Nov. ’17 (percent) |
Feb. ’18 (percent) |
May ’18 (percent) |
Aug. ’18 (percent) |
|
| Low-skill positions (typically require high school diploma or less and minimal work experience) | 47.2 | 51.1 | 53.4 | 56.5 |
| Mid-skill positions (typically require some college or technical schooling) | 60.4 | 61.2 | 66.7 | 68.1 |
| High-skill positions (typically require college degree or higher) | 37.6 | 39.6 | 37.4 | 37.1 |
If you are having problems finding qualified workers, what are the main reasons? Please check all that apply.*
| Feb. ’17 (percent) |
Nov. ’17 (percent) |
Feb. ’18 (percent) |
Aug. ’18 (percent) |
|
| Lack of available applicants/no applicants | 43.2 | 58.6 | 62.6 | 72.8 |
| Lack of technical competencies (hard skills) | 59.8 | 49.8 | 50.2 | 47.0 |
| Looking for more pay than is offered | 34.4 | 39.0 | 40.1 | 41.4 |
| Lack of experience | 40.5 | 32.5 | 37.0 | 37.1 |
| Lack of workplace competencies (soft skills) | 43.2 | 37.3 | 39.6 | 34.5 |
| Inability to pass drug test and/or background check | 29.3 | 32.1 | 30.0 | 31.0 |
What, if anything, are you doing to recruit and retain employees? Please check all that apply.
| Nov. ’17 (percent) |
Feb. ’18 (percent) |
May ’18 (percent) |
Aug. ’18 (percent) |
|
| Increasing wages and or benefits | 49.4 | 53.3 | 61.6 | 63.4 |
| Intensifying recruiting, including advertising, paying recruiting bonuses, utilizing employment agencies, etc. | 63.5 | 62.1 | 52.6 | 59.6 |
| Offering additional training | 35.7 | 38.2 | 27.8 | 36.6 |
| Increasing variable pay, including bonuses | 29.2 | 33.3 | 31.5 | 26.8 |
| Improving working conditions | 23.4 | 22.2 | 27.2 | 25.9 |
| Reducing education and other requirements for new hires | 8.8 | 6.5 | 8.3 | 12.9 |
| Other | 6.7 | 7.8 | 7.3 | 6.3 |
If labor costs are increasing, are you passing the cost on to customers in the way of price increases?
| Feb. ’17 (percent) |
Nov. ’17 (percent) |
Feb. ’18 (percent) |
Aug. ’18 (percent) |
|
| Yes | 40.6 | 40.8 | 42.6 | 41.4 |
| No | 59.4 | 59.2 | 57.4 | 58.6 |
*This question only posed to firms that noted they are having problems finding qualified workers when hiring.
NOTE: Survey respondents were given the opportunity to provide comments. These comments can be found on the individual survey Special Questions results pages, accessible by the tabs above.
Texas Manufacturing Outlook Survey
Data were collected Aug. 14–22, and 104 Texas manufacturers responded to the survey.
See data files with a full history of results.
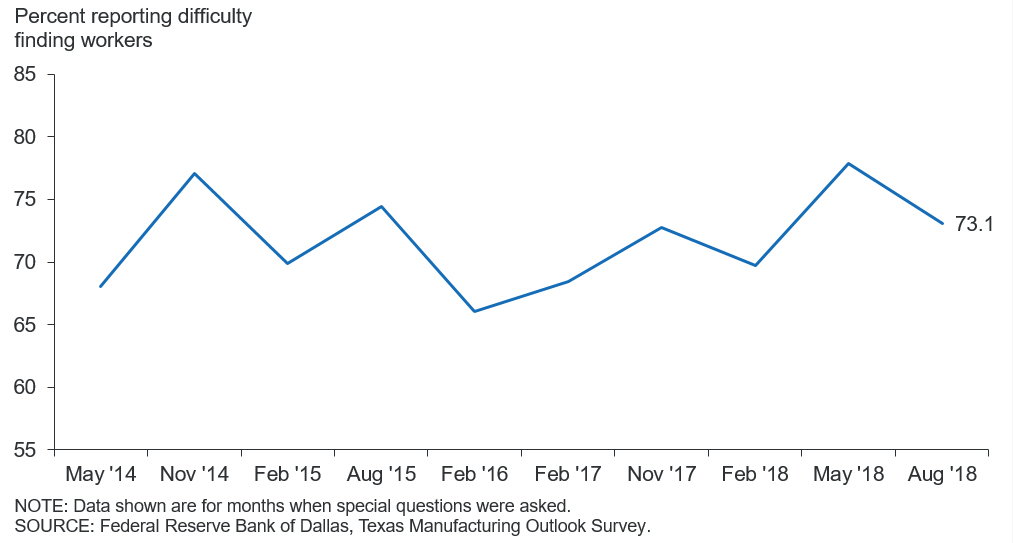
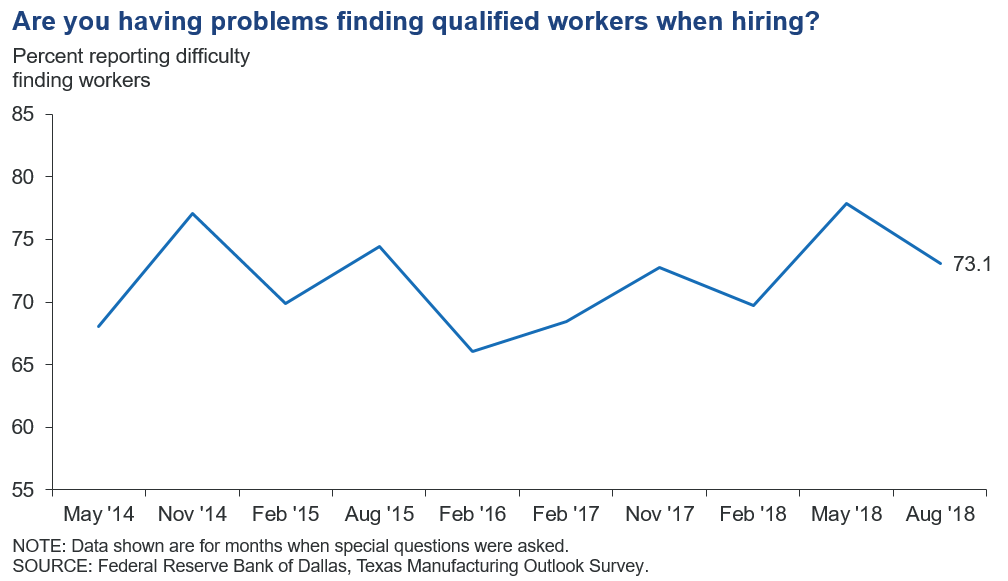
Are you having problems finding qualified workers when hiring?
| Nov. ’17 (percent) |
Feb. ’18 (percent) |
May ’18 (percent) |
Aug. ’18 (percent) |
|
| Yes | 72.7 | 69.7 | 77.9 | 73.1 |
| No | 27.3 | 30.3 | 22.1 | 26.9 |
If you are having problems finding qualified workers, in which categories are you experiencing difficulty? Please check all that apply.*
| Nov. ’17 (percent) |
Feb. ’18 (percent) |
May ’18 (percent) |
Aug. ’18 (percent) |
|
| Low-skill positions (typically require high school diploma or less and minimal work experience) | 61.1 | 64.7 | 62.9 | 68.9 |
| Mid-skill positions (typically require some college or technical schooling) | 66.7 | 70.6 | 70.0 | 71.6 |
| High-skill positions (typically require college degree or higher) | 30.6 | 32.4 | 28.6 | 27.0 |
If you are having problems finding qualified workers, what are the main reasons? Please check all that apply.*
| Feb. ’17 (percent) |
Nov. ’17 (percent) |
Feb. ’18 (percent) |
Aug. ’18 (percent) |
|
| Lack of available applicants/no applicants | 44.3 | 51.4 | 72.1 | 70.3 |
| Lack of technical competencies (hard skills) | 72.2 | 61.1 | 60.3 | 64.9 |
| Looking for more pay than is offered | 36.7 | 36.1 | 38.2 | 47.3 |
| Lack of workplace competencies (soft skills) | 45.6 | 37.5 | 44.1 | 36.5 |
| Lack of experience | 44.3 | 31.9 | 44.1 | 35.1 |
| Inability to pass drug test and/or background check | 29.1 | 45.8 | 41.2 | 35.1 |
What, if anything, are you doing to recruit and retain employees? Please check all that apply.
| Nov. ’17 (percent) |
Feb. ’18 (percent) |
May ’18 (percent) |
Aug. ’18 (percent) |
|
| Intensifying recruiting, including advertising, paying recruiting bonuses, utilizing employment agencies, etc. | 67.4 | 65.1 | 53.5 | 67.3 |
| Increasing wages and or benefits | 51.7 | 53.5 | 55.8 | 64.3 |
| Offering additional training | 40.4 | 43.0 | 30.2 | 38.8 |
| Improving working conditions | 24.7 | 18.6 | 24.4 | 24.5 |
| Increasing variable pay, including bonuses | 28.1 | 31.4 | 26.7 | 21.4 |
| Reducing education and other requirements for new hires | 11.2 | 4.7 | 14.0 | 19.4 |
| Other | 5.6 | 7.0 | 7.0 | 0.0 |
If labor costs are increasing, are you passing the cost on to customers in the way of price increases?
| Feb. ’17 (percent) |
Nov. ’17 (percent) |
Feb. ’18 (percent) |
Aug. ’18 (percent) |
|
| Yes | 39.4 | 41.6 | 45.2 | 42.7 |
| No | 60.6 | 58.4 | 54.8 | 57.3 |
*This question only posed to firms that noted they are having problems finding qualified workers when hiring.
Special Questions Comments
These comments have been edited for publication.
Nonmetallic Mineral Product Manufacturing
- Steel and cement prices are increasing due to new tariffs. This has hurt profit margins because they are fixed-price contracts entered into last year with no ability to pass on price increases. Future contracts have increased pricing included.
Primary Metal Manufacturing
- All cost increases will be passed on sooner or later.
Machinery Manufacturing
- We are being pinched on both sides, where our raw material costs are going up but we are unable to increase our prices due to increased competition. Labor is also tough to find, where they have the competencies we require.
- We are losing employees to the big companies at salaries that are ridiculous to us. Therefore, we are still hiring and training inexperienced young workers. I believe these higher-than-normal salaries will come to bite others in the near future. Layoffs will occur if they can’t sustain their order book and cost control. We will pay bonuses at the end of this year after we pay off all of our debt. That will put us in a great place for the future growth we expect. We are planning a new building for our machine shop and new tank manufacturing equipment.
Transportation Equipment Manufacturing
- We are partially passing on increased labor costs and working to improve productivity.
Food Manufacturing
- We are trying to pass on increasing costs, but our products are commodities that are very sensitive to supply and demand, and it is not always possible. Tariff/trade war talks are having a negative effect on demand and prices.
- We have plants in five states, and labor is exceptionally tight in our Georgia, California and Texas facilities.
Apparel Manufacturing
- It is tough to pass on price increases to the federal government in a timely manner.
Texas Service Sector Outlook Survey
Data were collected Aug. 14–22, and 254 Texas business executives responded to the survey.
See data files with a full history of results.
Are you having problems finding qualified workers when hiring?
| Nov. ’17 (percent) |
Feb. ’18 (percent) |
May ’18 (percent) |
Aug. ’18 (percent) |
|
| Yes | 65.3 | 62.9 | 66.1 | 63.4 |
| No | 34.7 | 37.1 | 33.9 | 36.6 |
If you are having problems finding qualified workers, in which categories are you experiencing difficulty? Please check all that apply.*
| Nov. ’17 (percent) |
Feb. ’18 (percent) |
May ’18 (percent) |
Aug. ’18 (percent) |
|
| Low-skill positions (typically require high school diploma or less and minimal work experience) | 41.6 | 45.3 | 49.0 | 50.6 |
| Mid-skill positions (typically require some college or technical schooling) | 57.9 | 57.2 | 65.1 | 66.5 |
| High-skill positions (typically require college degree or higher) | 40.4 | 42.8 | 41.6 | 41.8 |
If you are having problems finding qualified workers, what are the main reasons? Please check all that apply.*
| Feb. ’17 (percent) |
Nov. ’17 (percent) |
Feb. ’18 (percent) |
Aug. ’18 (percent) |
|
| Lack of available applicants/no applicants | 42.8 | 61.6 | 58.5 | 74.1 |
| Lack of technical competencies (hard skills) | 54.4 | 45.2 | 45.9 | 38.6 |
| Looking for more pay than is offered | 33.3 | 40.1 | 40.9 | 38.6 |
| Lack of experience | 38.9 | 32.8 | 34.0 | 38.0 |
| Lack of workplace competencies (soft skills) | 42.2 | 37.3 | 37.7 | 33.5 |
| Inability to pass drug test and/or background check | 29.4 | 26.6 | 25.2 | 29.1 |
What, if anything, are you doing to recruit and retain employees? Please check all that apply.
| Nov. ’17 (percent) |
Feb. ’18 (percent) |
May ’18 (percent) |
Aug. ’18 (percent) |
|
| Increasing wages and or benefits | 48.6 | 53.2 | 63.9 | 63.0 |
| Intensifying recruiting, including advertising, paying recruiting bonuses, utilizing employment agencies, etc. | 62.1 | 60.9 | 52.3 | 56.2 |
| Offering additional training | 34.0 | 36.4 | 26.9 | 35.6 |
| Increasing variable pay, including bonuses | 29.6 | 34.1 | 33.3 | 29.2 |
| Improving working conditions | 22.9 | 23.6 | 28.2 | 26.5 |
| Reducing education and other requirements for new hires | 7.9 | 7.3 | 6.0 | 10.0 |
| Other | 7.1 | 8.2 | 7.4 | 9.1 |
If labor costs are increasing, are you passing the cost on to customers in the way of price increases?
| Feb. ’17 (percent) |
Nov. ’17 (percent) |
Feb. ’18 (percent) |
Aug. ’18 (percent) |
|
| Yes | 41.1 | 40.5 | 41.5 | 40.9 |
| No | 58.9 | 59.5 | 58.5 | 59.1 |
*This question only posed to firms that noted they are having problems finding qualified workers when hiring.
Special Questions Comments
These comments have been edited for publication.
Broadcasting (Except Internet)
- We are having difficulty finding qualified outside sales people with a marketing background or college degree. There are very few applicants.
Securities, Commodity Contracts, and Other Financial Investments and Related Activities
- We are scared about the increasing deficit and continued growth of entitlement programs.
Professional, Scientific and Technical Services
- While my cost of doing business may increase, in the consulting business, you charge what the client is willing to pay, which has been going down over the past several years.
- It is hard to pass on those costs immediately. We will see more aggressive pricing in 2019. I will say lead time to fill is lengthening with some positions, but we are having success. It just takes more focus.
- We are a professional engineering firm with an audited multiplier, which is added to our labor rates. Thus, when we increase rates, the cost effect is passed on to the client.
- We will soon have to pass the labor cost increases to our clients. It’s not sustainable to go on like this.
- The workforce is tighter than I ever recall in Dallas. Competitors are raiding companies and are offering higher wages. They call our employees, ask what they are paid and offer them more to leave. It is a ruthless recruiting market. Fortunately, Dallas’ cost of living is highly competitive and helps in recruiting efforts.
Administrative and Support Services
- We find that social media and a current website are very helpful. Also, thorough and smart interviewing is necessary to ensure that applicants will stay on the assignment. Employee turnover is as bad as an inability to fill the job order.
- The customers are very aware of pricing, and there is not a lot of flexibility in the current price structure.
- All costs of sales will affect pricing if we can't figure out a way to produce our services more affordably.
- The quality of applicants and hires is pretty sad. There is a very poor work ethic, no experience and very low skill set. We wonder exactly what the schools are teaching, because they are not teaching what is required to hold a job.
Ambulatory Health Care Services
- It is really hard to find plug-and-play employees; it requires a lot of training to get them up to speed.
Hospitals
- Housing costs and availability are in crisis in our area, dramatically affecting hiring and retention.
Amusement, Gambling and Recreation Industries
- Food service is not only competing with other food service and hotel establishments but also with the construction firms that are building everywhere. The cost of living in Austin is a significant challenge for entry-level employees. Rents are way too high, public transportation is either not available to where they live or does not run on a schedule that corresponds to their work schedules (i.e., late-night or early-morning services). Therefore, to retain employees, we have had to provide parking and increase the benefits we provide while keeping the wages competitive. As labor remains tight, we are constantly having to evaluate wages just to keep our employees.
Personal and Laundry Services
- Unfortunately, my business is at peak pricing given the current economic cycle. Customers will not be able to endure a price increase, so the higher employee wages cannot be absorbed by the customers.
Texas Retail Outlook Survey
Data were collected Aug. 14–22, and 51 Texas retailers responded to the survey.
See data files with a full history of results.
Are you having problems finding qualified workers when hiring?

| Nov. ’17 (percent) |
Feb. ’18 (percent) |
May ’18 (percent) |
Aug. ’18 (percent) |
|
| Yes | 76.4 | 75.5 | 82.2 | 76.5 |
| No | 23.6 | 24.5 | 17.8 | 23.5 |
If you are having problems finding qualified workers, in which categories are you experiencing difficulty? Please check all that apply.*
| Nov. ’17 (percent) |
Feb. ’18 (percent) |
May ’18 (percent) |
Aug. ’18 (percent) |
|
| Low-skill positions (typically require high school diploma or less and minimal work experience) | 54.8 | 55.6 | 69.4 | 56.8 |
| Mid-skill positions (typically require some college or technical schooling) | 66.7 | 69.4 | 75.0 | 86.5 |
| High-skill positions (typically require college degree or higher) | 21.4 | 13.9 | 30.6 | 24.3 |
If you are having problems finding qualified workers, what are the main reasons? Please check all that apply.*
| Feb. ’17 (percent) |
Nov. ’17 (percent) |
Feb. ’18 (percent) |
Aug. ’18 (percent) |
|
| Lack of available applicants/no applicants | 46.7 | 59.5 | 56.8 | 78.9 |
| Lack of technical competencies (hard skills) | 55.6 | 54.8 | 48.6 | 52.6 |
| Inability to pass drug test and/or background check | 48.9 | 47.6 | 37.8 | 42.1 |
| Lack of workplace competencies (soft skills) | 46.7 | 33.3 | 40.5 | 36.8 |
| Lack of experience | 37.8 | 35.7 | 35.1 | 34.2 |
| Looking for more pay than is offered | 28.9 | 38.1 | 24.3 | 23.7 |
What, if anything, are you doing to recruit and retain employees? Please check all that apply.
| Nov. ’17 (percent) |
Feb. ’18 (percent) |
May ’18 (percent) |
Aug. ’18 (percent) |
|
| Increasing wages and or benefits | 56.6 | 41.3 | 56.8 | 63.0 |
| Intensifying recruiting, including advertising, paying recruiting bonuses, utilizing employment agencies, etc. | 66.0 | 60.9 | 65.9 | 54.3 |
| Increasing variable pay, including bonuses | 39.6 | 43.5 | 36.4 | 37.0 |
| Improving working conditions | 24.5 | 26.1 | 27.3 | 32.6 |
| Offering additional training | 34.0 | 32.6 | 18.2 | 30.4 |
| Reducing education and other requirements for new hires | 13.2 | 10.9 | 6.8 | 10.9 |
| Other | 5.7 | 4.3 | 4.5 | 8.7 |
If labor costs are increasing, are you passing the cost on to customers in the way of price increases?
| Feb. ’17 (percent) |
Nov. ’17 (percent) |
Feb. ’18 (percent) |
Aug. ’18 (percent) |
|
| Yes | 43.8 | 47.9 | 36.4 | 43.8 |
| No | 56.3 | 52.1 | 63.6 | 56.3 |
*This question only posed to firms that noted they are having problems finding qualified workers when hiring.
Special Questions Comments
These comments have been edited for publication.
Merchant Wholesalers, Nondurable Goods
- We are trying to raise margins to offset wage increases. Some commodities will not allow increased margins.
Motor Vehicle and Parts Dealers
- Our biggest problem is finding qualified service technicians.
- There is a huge need in the U.S. for more technical schools (versus colleges/universities). It is certainly hampering our economy.
Building Material and Garden Equipment and Supplies Dealers
- We need immigration reform and a permanent lift on the cap for H-2B workers.
- We have a reputation as a great place to work, especially for people who love gardening and horticulture. This gives us a competitive advantage in the labor market.
Clothing and Clothing Accessories Stores
- Retail is not a very popular industry.
Questions regarding the Texas Business Outlook Surveys can be addressed to Emily Kerr at emily.kerr@dal.frb.org,
Sign up for our email alert to be automatically notified as soon as the latest surveys are released on the web.