Special Questions

Special Questions
November 26, 2018
Results below include responses from participants of all three surveys: Texas Manufacturing Outlook Survey, Texas Service Sector Outlook Survey and Texas Retail Outlook Survey.
Texas Business Outlook Surveys
Data were collected Nov. 12–20, and 359 Texas business executives responded to the surveys.
See data files with a full history of results.
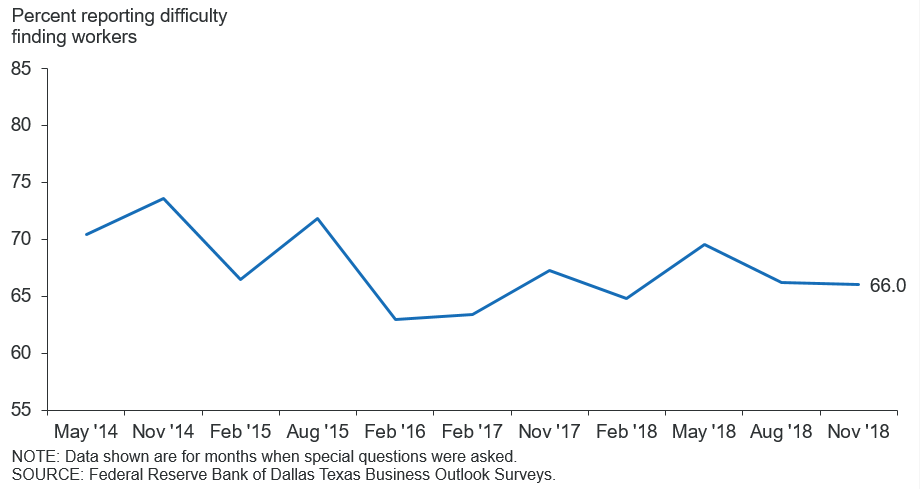
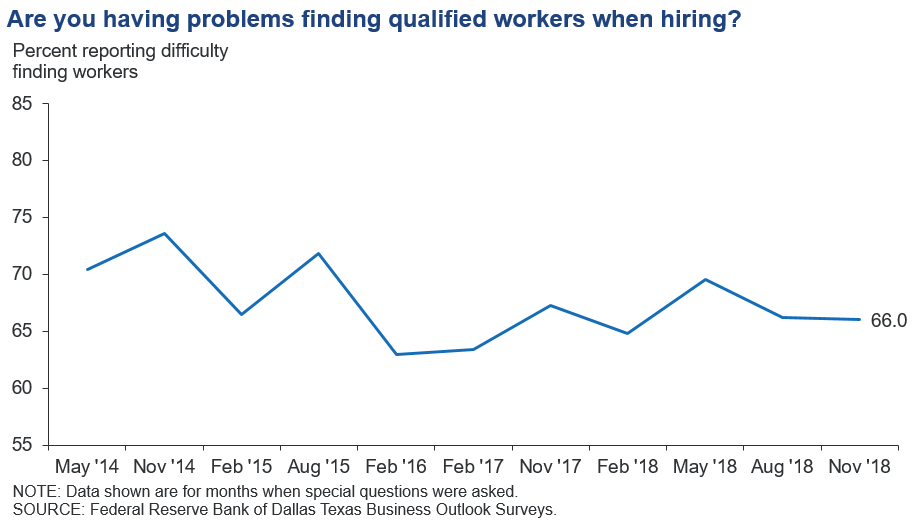
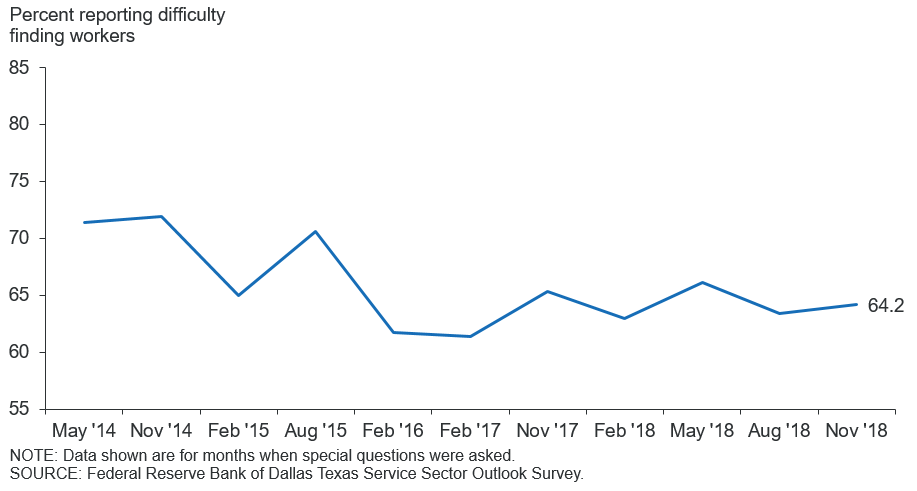
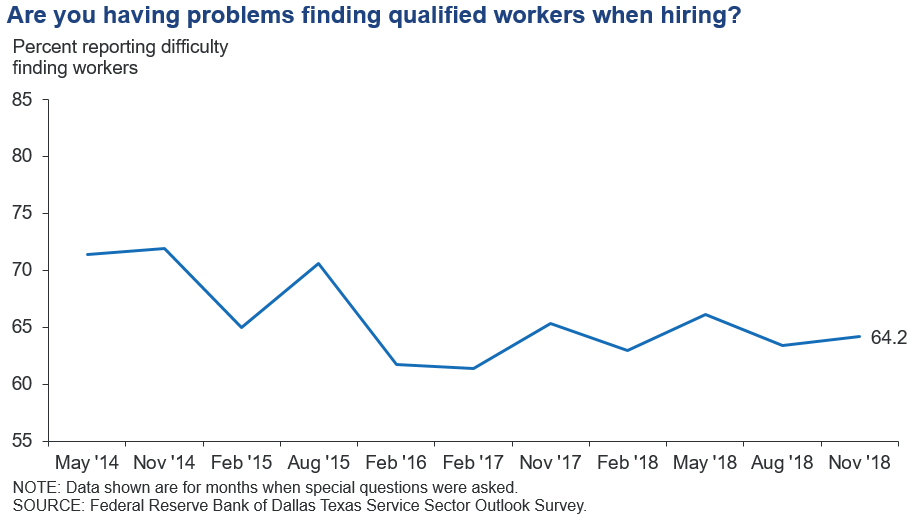
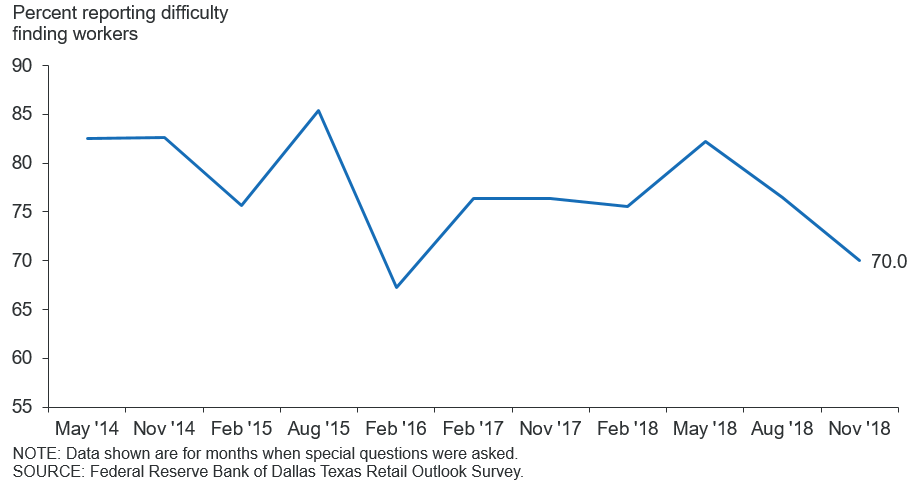
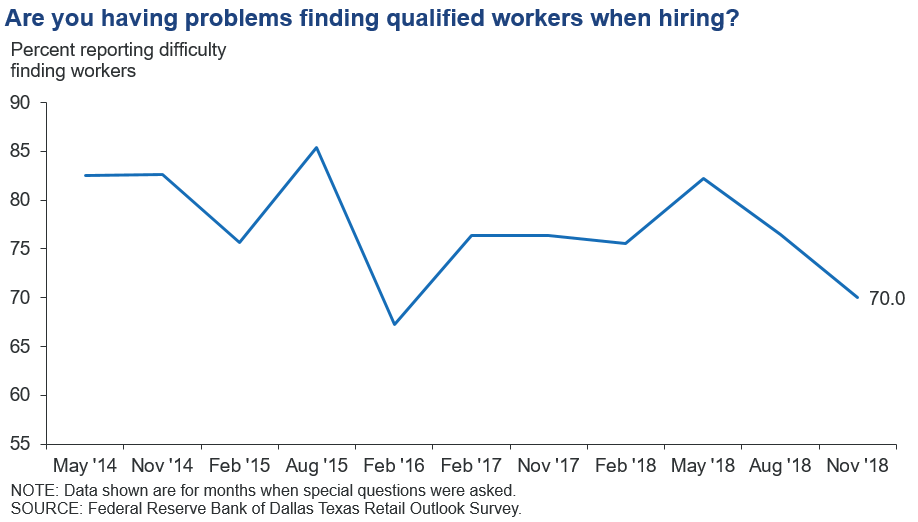
Are you having problems finding qualified workers when hiring?
| Nov. ’17 (percent) |
Feb. ’18 (percent) |
May ’18 (percent) |
Aug. ’18 (percent) |
Nov. ’18 (percent) |
|
| Yes | 67.3 | 64.8 | 69.5 | 66.2 | 66.0 |
| No | 32.7 | 35.2 | 30.5 | 33.8 | 34.0 |
If you are having problems finding qualified workers, in which categories are you experiencing difficulty? Please check all that apply.*
| Nov. ’17 (percent) |
Feb. ’18 (percent) |
May ’18 (percent) |
Aug. ’18 (percent) |
Nov. ’18 (percent) |
|
| Low-skill positions (typically require high school diploma or less and minimal work experience) | 47.2 | 51.1 | 53.4 | 56.5 | 54.1 |
| Mid-skill positions (typically require some college or technical training) | 60.4 | 61.2 | 66.7 | 68.1 | 71.4 |
| High-skill positions (typically require college degree or higher) | 37.6 | 39.6 | 37.4 | 37.1 | 36.4 |
If you are having problems finding qualified workers, what are the main reasons? Please check all that apply.*
| Feb. ’17 (percent) |
Nov. ’17 (percent) |
Feb. ’18 (percent) |
Aug. ’18 (percent) |
Nov. ’18 (percent) |
|
| Lack of available applicants/no applicants | 43.2 | 58.6 | 62.6 | 72.8 | 70.6 |
| Looking for more pay than is offered | 34.4 | 39.0 | 40.1 | 41.4 | 45.0 |
| Lack of technical competencies (hard skills) | 59.8 | 49.8 | 50.2 | 47.0 | 43.3 |
| Lack of experience | 40.5 | 32.5 | 37.0 | 37.1 | 40.7 |
| Lack of workplace competencies (soft skills) | 43.2 | 37.3 | 39.6 | 34.5 | 39.0 |
| Inability to pass drug test and/or background check | 29.3 | 32.1 | 30.0 | 31.0 | 32.5 |
What, if anything, are you doing to recruit and retain employees? Please check all that apply.**
| Nov. ’17 (percent) |
Feb. ’18 (percent) |
May ’18 (percent) |
Aug. ’18 (percent) |
Nov. ’18 (percent) |
|
| Increasing wages and/or benefits | 49.4 | 53.3 | 61.6 | 63.4 | 66.6 |
| Increasing wages | 61.9 | ||||
| Intensifying recruiting, including advertising, paying recruiting bonuses, utilizing employment agencies, etc. | 63.5 | 62.1 | 52.6 | 59.6 | 60.7 |
| Offering additional training | 35.7 | 38.2 | 27.8 | 36.6 | 35.9 |
| Increasing variable pay, including bonuses | 29.2 | 33.3 | 31.5 | 26.8 | 29.1 |
| Improving working conditions | 23.4 | 22.2 | 27.2 | 25.9 | 27.6 |
| Increasing benefits | 20.1 | ||||
| Reducing education and other requirements for new hires | 8.8 | 6.5 | 8.3 | 12.9 | 12.1 |
| Other | 6.7 | 7.8 | 7.3 | 6.3 | 9.3 |
For each category below, please select the extent to which your firm raised wages (excluding benefits) over the past 12 months:
| Nov. ’18 (percent) |
|||
| None | < 4% | ≥ 4% | |
| Low-skill positions (typically require high school diploma or less and minimal work experience) | 23.5 | 43.7 | 32.8 |
| Mid-skill positions (typically require some college or technical training) | 19.3 | 44.9 | 35.8 |
| High-skill positions (typically require college degree or higher) | 27.4 | 36.5 | 36.2 |
*This question only posed to firms that noted they are having problems finding qualified workers when hiring.
**Starting in November 2018, "increasing wages" appears as a separate answer choice from "increasing benefits." We will continue to include the share of firms reporting increasing wages and/or benefits but as a calculation based on responses to “increasing wages” and “increasing benefits.”
NOTES: Survey respondents were given the opportunity to provide comments. These comments can be found on the individual survey Special Questions results pages, accessible by the tabs above.
Texas Manufacturing Outlook Survey
Data were collected Nov. 12–20, and 105 Texas manufacturers responded to the survey.
See data files with a full history of results.
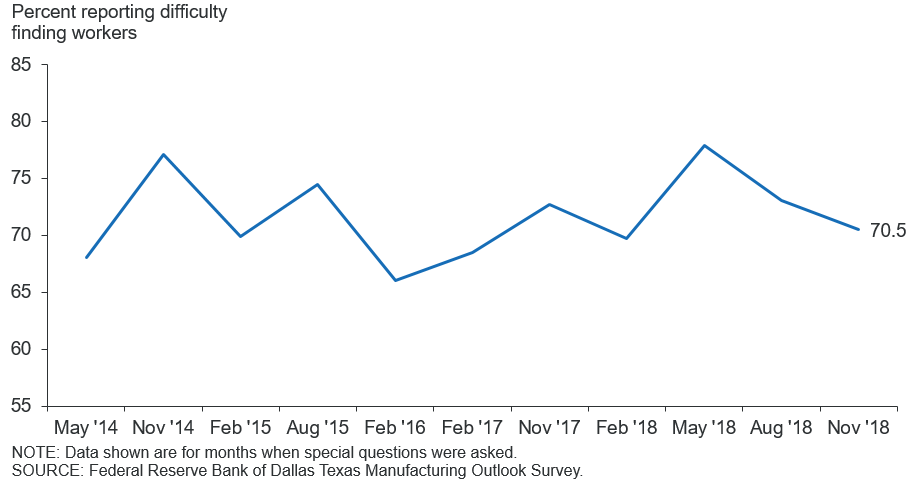
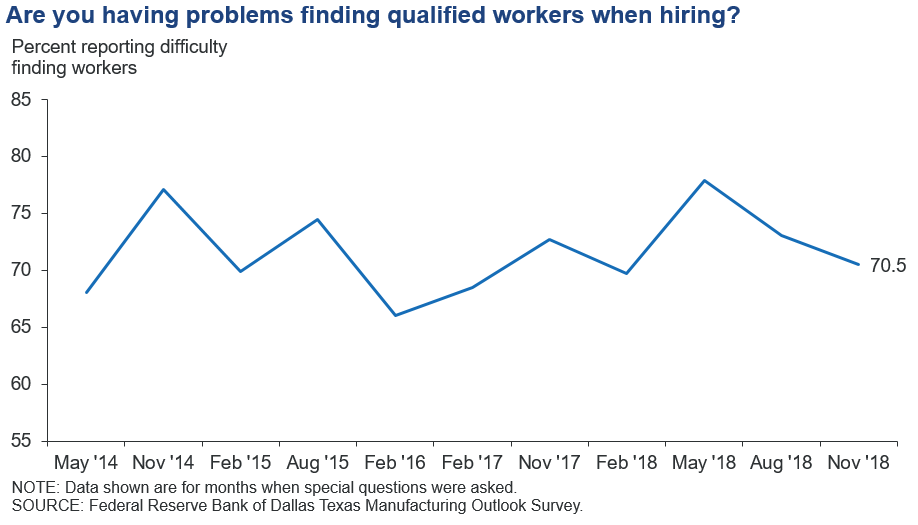
Are you having problems finding qualified workers when hiring?
| Nov. ’17 (percent) |
Feb. ’18 (percent) |
May ’18 (percent) |
Aug. ’18 (percent) |
Nov. ’18 (percent) |
|
| Yes | 72.7 | 69.7 | 77.9 | 73.1 | 70.5 |
| No | 27.3 | 30.3 | 22.1 | 26.9 | 29.5 |
If you are having problems finding qualified workers, in which categories are you experiencing difficulty? Please check all that apply.*
| Nov. ’17 (percent) |
Feb. ’18 (percent) |
May ’18 (percent) |
Aug. ’18 (percent) |
Nov. ’18 (percent) |
|
| Low-skill positions (typically require high school diploma or less and minimal work experience) | 61.1 | 64.7 | 62.9 | 68.9 | 66.2 |
| Mid-skill positions (typically require some college or technical training) | 66.7 | 70.6 | 70.0 | 71.6 | 77.5 |
| High-skill positions (typically require college degree or higher) | 30.6 | 32.4 | 28.6 | 27.0 | 26.8 |
If you are having problems finding qualified workers, what are the main reasons? Please check all that apply.*
| Feb. ’17 (percent) |
Nov. ’17 (percent) |
Feb. ’18 (percent) |
Aug. ’18 (percent) |
Nov. ’18 (percent) |
|
| Lack of available applicants/no applicants | 44.3 | 51.4 | 72.1 | 70.3 | 69.9 |
| Lack of technical competencies (hard skills) | 72.2 | 61.1 | 60.3 | 64.9 | 57.5 |
| Lack of workplace competencies (soft skills) | 45.6 | 37.5 | 44.1 | 36.5 | 45.2 |
| Looking for more pay than is offered | 36.7 | 36.1 | 38.2 | 47.3 | 43.8 |
| Inability to pass drug test and/or background check | 29.1 | 45.8 | 41.2 | 35.1 | 42.5 |
| Lack of experience | 44.3 | 31.9 | 44.1 | 35.1 | 38.4 |
What, if anything, are you doing to recruit and retain employees? Please check all that apply.**
| Nov. ’17 (percent) |
Feb. ’18 (percent) |
May ’18 (percent) |
Aug. ’18 (percent) |
Nov. ’18 (percent) |
|
| Increasing wages and/or benefits | 51.7 | 53.5 | 55.8 | 64.3 | 68.4 |
| Increasing wages | 63.3 | ||||
| Intensifying recruiting, including advertising, paying recruiting bonuses, utilizing employment agencies, etc. | 67.4 | 65.1 | 53.5 | 67.3 | 61.2 |
| Offering additional training | 40.4 | 43.0 | 30.2 | 38.8 | 32.7 |
| Improving working conditions | 24.7 | 18.6 | 24.4 | 24.5 | 30.6 |
| Increasing variable pay, including bonuses | 28.1 | 31.4 | 26.7 | 21.4 | 24.5 |
| Reducing education and other requirements for new hires | 11.2 | 4.7 | 14.0 | 19.4 | 16.3 |
| Increasing benefits | 16.3 | ||||
| Other | 5.6 | 7.0 | 7.0 | 0.0 | 7.1 |
For each category below, please select the extent to which your firm raised wages (excluding benefits) over the past 12 months:
| Nov. ’18 (percent) |
|||
| None | < 4% | ≥ 4% | |
| Low-skill positions (typically require high school diploma or less and minimal work experience) | 10.8 | 53.9 | 35.3 |
| Mid-skill positions (typically require some college or technical training) | 11.7 | 49.5 | 38.8 |
| High-skill positions (typically require college degree or higher) | 20.4 | 39.8 | 39.8 |
*This question only posed to firms that noted they are having problems finding qualified workers when hiring.
**Starting in November 2018, "increasing wages" appears as a separate answer choice from "increasing benefits." We will continue to include the share of firms reporting increasing wages and/or benefits but as a calculation based on responses to “increasing wages” and “increasing benefits.”
Special Questions Comments
These comments have been edited for publication.
Food Manufacturing
- We have had some success advertising on radio during “drive time” which enables us to “steal” workers from other businesses in our area. With unemployment at 3.7 percent, it appears almost everyone who wants a job, has a job. We have raised our hourly compensation for blue-collar jobs as well. It is a tough labor market. On another subject, there is a significant shortage of truck drivers right now. One national vendor of ours tells us the U.S. is short 60,000 truck drivers. They are currently 32 truckloads behind in picking up merchandise we have manufactured, per their orders, which creates a bottleneck for us from a warehousing point of view.
- We plan on a significant (more than 4 percent) raise for all positions effective January 2019.
Textile Product Mills
- We have a higher level of orders, so we are increasing wages to keep workers happy and here!
Nonmetallic Mineral Product Manufacturing
- In the Austin area, unemployment is very low, which affects the pool of available candidates. Those individuals left in the market are typically ones that don't want to work or can't find jobs; therefore, we have to be able to pull potential employees away from established positions.
Fabricated Metal Product Manufacturing
- In the steel fabrication industry, skilled welders and fitters (with the ability to read fabrication drawings) are going to the oil and gas industry, which pays almost double what the fabrication industry pays. Because of this and other issues, other steel lattice fabricators have moved offshore.
Machinery Manufacturing
- We have increased wages for entry-level positions to improve the applicant pool.
Computer and Electronic Product Manufacturing
- We always have trouble finding enough technical talent in the U.S. but can hire in other regions of the world to meet demand.
Electrical Equipment, Appliance and Component Manufacturing
- In our plants (which is where 85 percent of our employees work), drug testing washes out more people than you would think. Random testing in our office has also nailed a couple. We are not in favor of pot laws. Also, we need a better pot test that tells if people are high or not.
Texas Service Sector Outlook Survey
Data were collected Nov. 12–20, and 254 Texas business executives responded to the survey.
See data files with a full history of results.
Are you having problems finding qualified workers when hiring?
| Nov. ’17 (percent) |
Feb. ’18 (percent) |
May ’18 (percent) |
Aug. ’18 (percent) |
Nov. ’18 (percent) |
|
| Yes | 65.3 | 62.9 | 66.1 | 63.4 | 64.2 |
| No | 34.7 | 37.1 | 33.9 | 36.6 | 35.8 |
If you are having problems finding qualified workers, in which categories are you experiencing difficulty? Please check all that apply.*
| Nov. ’17 (percent) |
Feb. ’18 (percent) |
May ’18 (percent) |
Aug. ’18 (percent) |
Nov. ’18 (percent) |
|
| Low-skill positions (typically require high school diploma or less and minimal work experience) | 41.6 | 45.3 | 49.0 | 50.6 | 48.8 |
| Mid-skill positions (typically require some college or technical training) | 57.9 | 57.2 | 65.1 | 66.5 | 68.8 |
| High-skill positions (typically require college degree or higher) | 40.4 | 42.8 | 41.6 | 41.8 | 40.6 |
If you are having problems finding qualified workers, what are the main reasons? Please check all that apply.*
| Feb. ’17 (percent) |
Nov. ’17 (percent) |
Feb. ’18 (percent) |
Aug. ’18 (percent) |
Nov. ’18 (percent) |
|
| Lack of available applicants/no applicants | 42.8 | 61.6 | 58.5 | 74.1 | 70.9 |
| Looking for more pay than is offered | 33.3 | 40.1 | 40.9 | 38.6 | 45.6 |
| Lack of experience | 38.9 | 32.8 | 34.0 | 38.0 | 41.8 |
| Lack of technical competencies (hard skills) | 54.4 | 45.2 | 45.9 | 38.6 | 36.7 |
| Lack of workplace competencies (soft skills) | 42.2 | 37.3 | 37.7 | 33.5 | 36.1 |
| Inability to pass drug test and/or background check | 29.4 | 26.6 | 25.2 | 29.1 | 27.8 |
What, if anything, are you doing to recruit and retain employees? Please check all that apply.**
| Nov. ’17 (percent) |
Feb. ’18 (percent) |
May ’18 (percent) |
Aug. ’18 (percent) |
Nov. ’18 (percent) |
|
| Increasing wages and/or benefits | 48.6 | 53.2 | 63.9 | 63.0 | 65.8 |
| Increasing wages | 61.3 | ||||
| Intensifying recruiting, including advertising, paying recruiting bonuses, utilizing employment agencies, etc. | 62.1 | 60.9 | 52.3 | 56.2 | 60.4 |
| Offering additional training | 34.0 | 36.4 | 26.9 | 35.6 | 37.3 |
| Increasing variable pay, including bonuses | 29.6 | 34.1 | 33.3 | 29.2 | 31.1 |
| Improving working conditions | 22.9 | 23.6 | 28.2 | 26.5 | 26.2 |
| Increasing benefits | 21.8 | ||||
| Reducing education and other requirements for new hires | 7.9 | 7.3 | 6.0 | 10.0 | 10.2 |
| Other | 7.1 | 8.2 | 7.4 | 9.1 | 10.2 |
For each category below, please select the extent to which your firm raised wages (excluding benefits) over the past 12 months:
| Nov. ’18 (percent) |
|||
| None | < 4% | ≥ 4% | |
| Low-skill positions (typically require high school diploma or less and minimal work experience) | 29.4 | 38.9 | 31.7 |
| Mid-skill positions (typically require some college or technical training) | 22.7 | 42.8 | 34.5 |
| High-skill positions (typically require college degree or higher) | 30.4 | 35.0 | 34.6 |
*This question only posed to firms that noted they are having problems finding qualified workers when hiring.
**Starting in November 2018, "increasing wages" appears as a separate answer choice from "increasing benefits." We will continue to include the share of firms reporting increasing wages and/or benefits but as a calculation based on responses to “increasing wages” and “increasing benefits.”
Special Questions Comments
These comments have been edited for publication.
Truck Transportation
- It is difficult to find qualified truck drivers for over-the-road positions. It's a $70,000 per year job but drivers are gone from home 90 percent of the time.
Support Activities for Transportation
- People literally just do not understand or want to put in a good day’s work.
Data Processing, Hosting and Related Services
- Lack of qualified applicants in Dallas–Fort Worth has prompted us to expand searches. We've used recruiters for approximately 85 percent of hires this year. We've increased wages and benefits to attract and retain talent. The younger the talent, the more time they want to "work from home," but that hasn't proven to enable the company to serve its customers as well.
Credit Intermediation and Related Activities
- We do not gauge skill in terms of college degrees or training but rather in terms of knowledge and ability.
- In our rural markets, we must recruit available students out of high school to try and establish a trainable employment base that will stay on the job for years to come.
Insurance Carriers and Related Activities
- We hire based on sales and relationship talent, not vocational-technical type training.
Professional, Scientific and Technical Services
- I don't use anyone but "high-skill" workers. The type I would need would be relatively available, as high-skill workers for energy business projects are not in particularly high demand.
Administrative and Support Services
- I am a recruiter, so I'm speaking not from my firm's experience, but from our clients' perspectives. Some positions are extremely difficult to fill, like civil engineering, audit/tax, clinical/pharmaceutical/therapeutic, etc. The less socially active you are and the more conservative in nature, the harder it is to hire. The lead times are significant, but many of these firms don't start their hiring process until there is a need, which is a fatal flaw in their process.
- Finding employees is a very big challenge. Just finding an individual with a good driver's license is like winning the lottery.
- Increasing pay to retain qualified existing employees is essential.
Educational Services
- We continue to struggle with hiring transportation drivers and teachers. We continue to reinforce our efforts by increasing wages and through more robust recruiting. It's not only our problem but the problem in our industry.
Nursing and Residential Care Facilities
- We are making wage adjustments in targeted markets to try to attract and retain employees.
Food Services and Drinking Places
- There are more jobs than people.
Texas Retail Outlook Survey
Data were collected Nov. 12–20, and 50 Texas retailers responded to the survey.
See data files with a full history of results.
Are you having problems finding qualified workers when hiring?
| Nov. ’17 (percent) |
Feb. ’18 (percent) |
May ’18 (percent) |
Aug. ’18 (percent) |
Nov. ’18 (percent) |
|
| Yes | 76.4 | 75.5 | 82.2 | 76.5 | 70.0 |
| No | 23.6 | 24.5 | 17.8 | 23.5 | 30.0 |
If you are having problems finding qualified workers, in which categories are you experiencing difficulty? Please check all that apply.*
| Nov. ’17 (percent) |
Feb. ’18 (percent) |
May ’18 (percent) |
Aug. ’18 (percent) |
Nov. ’18 (percent) |
|
| Low-skill positions (typically require high school diploma or less and minimal work experience) | 54.8 | 55.6 | 69.4 | 56.8 | 61.8 |
| Mid-skill positions (typically require some college or technical training) | 66.7 | 69.4 | 75.0 | 86.5 | 76.5 |
| High-skill positions (typically require college degree or higher) | 21.4 | 13.9 | 30.6 | 24.3 | 29.4 |
If you are having problems finding qualified workers, what are the main reasons? Please check all that apply.*
| Feb. ’17 (percent) |
Nov. ’17 (percent) |
Feb. ’18 (percent) |
Aug. ’18 (percent) |
Nov. ’18 (percent) |
|
| Lack of available applicants/no applicants | 46.7 | 59.5 | 56.8 | 78.9 | 66.7 |
| Lack of technical competencies (hard skills) | 55.6 | 54.8 | 48.6 | 52.6 | 45.5 |
| Inability to pass drug test and/or background check | 48.9 | 47.6 | 37.8 | 42.1 | 45.5 |
| Lack of workplace competencies (soft skills) | 46.7 | 33.3 | 40.5 | 36.8 | 39.4 |
| Looking for more pay than is offered | 28.9 | 38.1 | 24.3 | 23.7 | 36.4 |
| Lack of experience | 37.8 | 35.7 | 35.1 | 34.2 | 33.3 |
What, if anything, are you doing to recruit and retain employees? Please check all that apply.**
| Nov. ’17 (percent) |
Feb. ’18 (percent) |
May ’18 (percent) |
Aug. ’18 (percent) |
Nov. ’18 (percent) |
|
| Increasing wages and/or benefits | 56.6 | 41.3 | 56.8 | 63.0 | 58.7 |
| Intensifying recruiting, including advertising, paying recruiting bonuses, utilizing employment agencies, etc. | 66.0 | 60.9 | 65.9 | 54.3 | 58.7 |
| Increasing wages | 56.5 | ||||
| Increasing variable pay, including bonuses | 39.6 | 43.5 | 36.4 | 37.0 | 30.4 |
| Offering additional training | 34.0 | 32.6 | 18.2 | 30.4 | 26.1 |
| Improving working conditions | 24.5 | 26.1 | 27.3 | 32.6 | 26.1 |
| Increasing benefits | 15.2 | ||||
| Reducing education and other requirements for new hires | 13.2 | 10.9 | 6.8 | 10.9 | 10.9 |
| Other | 5.7 | 4.3 | 4.5 | 8.7 | 10.9 |
For each category below, please select the extent to which your firm raised wages (excluding benefits) over the past 12 months:
| Nov. ’18 (percent) |
|||
| None | < 4% | ≥ 4% | |
| Low-skill positions (typically require high school diploma or less and minimal work experience) | 16.3 | 46.5 | 37.2 |
| Mid-skill positions (typically require some college or technical training) | 18.6 | 44.2 | 37.2 |
| High-skill positions (typically require college degree or higher) | 38.5 | 41.0 | 20.5 |
*This question only posed to firms that noted they are having problems finding qualified workers when hiring.
**Starting in November 2018, "increasing wages" appears as a separate answer choice from "increasing benefits." We will continue to include the share of firms reporting increasing wages and/or benefits but as a calculation based on responses to “increasing wages” and “increasing benefits.”
Special Questions Comments
These comments have been edited for publication.
Merchant Wholesalers, Nondurable Goods
- Drivers are in high demand and hard to find and keep.
Motor Vehicle and Parts Dealers
- Younger college-educated candidates are wanting fewer work hours and noncommissioned pay plans, making it difficult to recruit for sales positions.
Building Material and Garden Equipment and Supplies Dealers
- There has always been an issue with schools not training workers properly.
Health and Personal Care Stores
- I now have one more employee on company health insurance than I did last quarter.
Clothing and Clothing Accessories Stores
- There is significantly more difficulty in hiring in major metropolitan areas like Houston. Smaller cities are generally not experiencing any issues.
Questions regarding the Texas Business Outlook Surveys can be addressed to Emily Kerr at emily.kerr@dal.frb.org,
Sign up for our email alert to be automatically notified as soon as the latest surveys are released on the web.