Special Questions

Special Questions
December 31, 2018
Results below include responses from participants of all three surveys: Texas Manufacturing Outlook Survey, Texas Service Sector Outlook Survey and Texas Retail Outlook Survey.
Texas Business Outlook Surveys
Data were collected Dec. 18–26, and 317 Texas business executives responded to the surveys.
See data files with a full history of results.
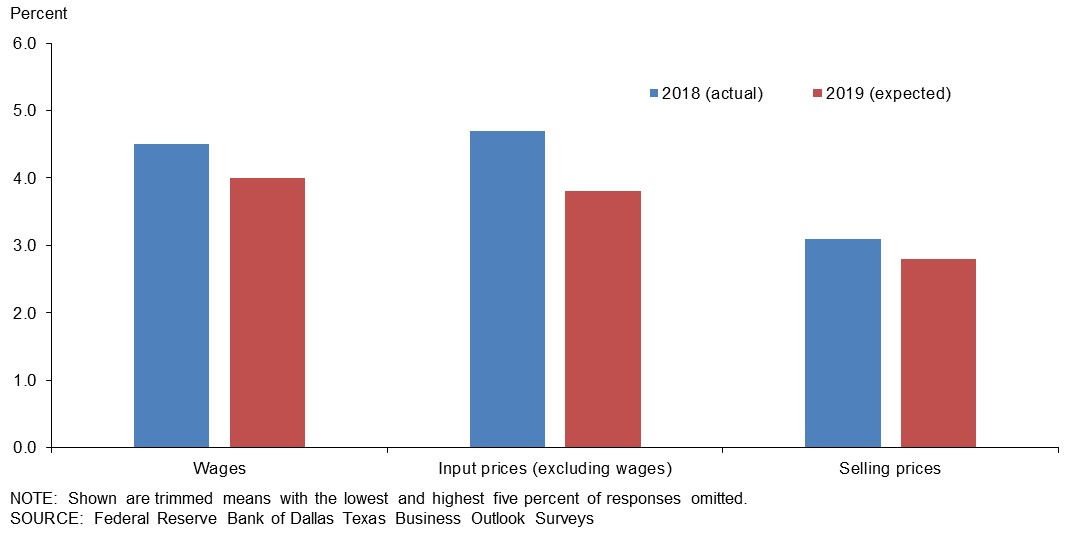
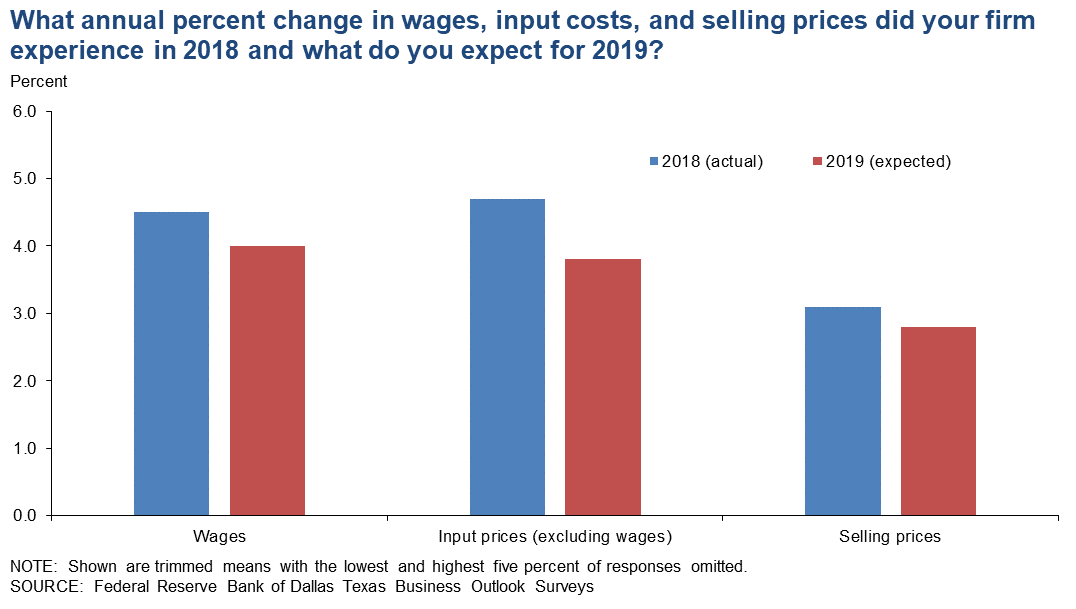
What annual percent change in wages, input prices, and selling prices did your firm experience in 2018 and what do you expect for 2019?
| 2018 actual (percent)* |
2019 expected (percent)* |
|
| Wages | 4.5 | 4.0 |
| Input costs (excluding wages) | 4.7 | 3.8 |
| Selling prices | 3.1 | 2.8 |
If costs (including wages) are increasing, to what extent are you passing the higher costs on to customers in the way of price increases?
| Dec. '18 (percent) |
||
| None | 24.4 | |
| Some | 49.2 | |
| Most | 18.1 | |
| All | 8.4 |
If costs (including wages) are increasing, how has your firm’s ability to pass those increases on to customers changed over the past six months?
| Dec. '18 (percent) |
||
| Much easier now | 1.4 | |
| Somewhat easier now | 18.9 | |
| Similar to six months ago | 39.5 | |
| Somewhat harder now | 23.7 | |
| Significantly harder now | 16.5 |
How has your firm’s operating margin, defined as earnings before interest and taxes (EBIT) as a share of total revenue, changed over the past six months?
| Dec. '18 (percent) |
||
| Increased substantially | 7.2 | |
| Increased slightly | 23.1 | |
| Remained the same | 24.4 | |
| Decreased slightly | 34.2 | |
| Decreased substantially | 11.1 |
*Shown are trimmed means with the lowest and highest 5 percent of responses omitted. A similar question was posed in May 2018 asking about wages and prices in 2017 (actual) and 2018 (expected).
NOTES: Survey respondents were given the opportunity to provide comments. These comments can be found on the individual survey Special Questions results pages, accessible by the tabs above.
Texas Manufacturing Outlook Survey
Data were collected Dec. 18–26, and 100 Texas manufacturers responded to the survey.
See data files with a full history of results.
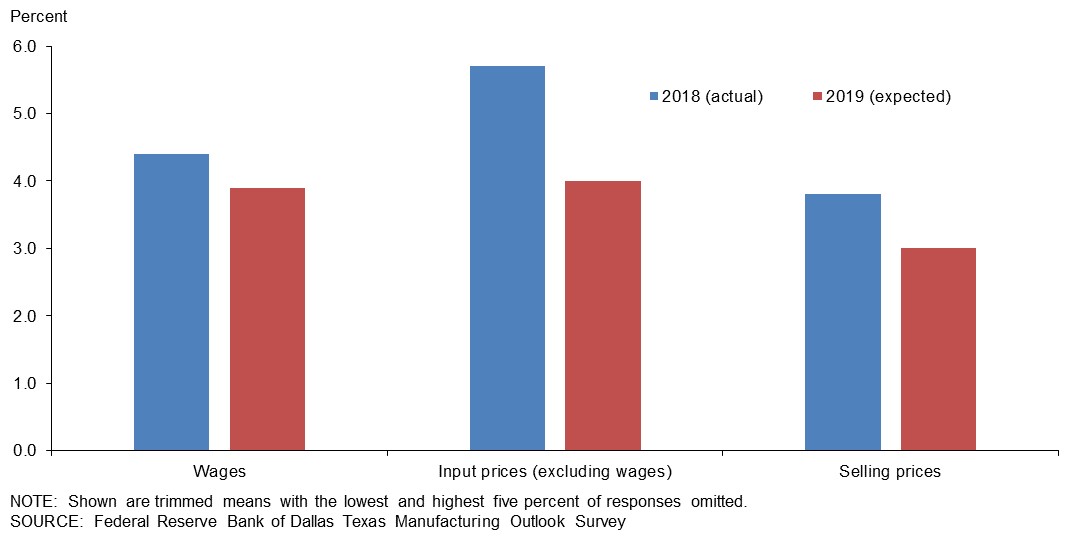
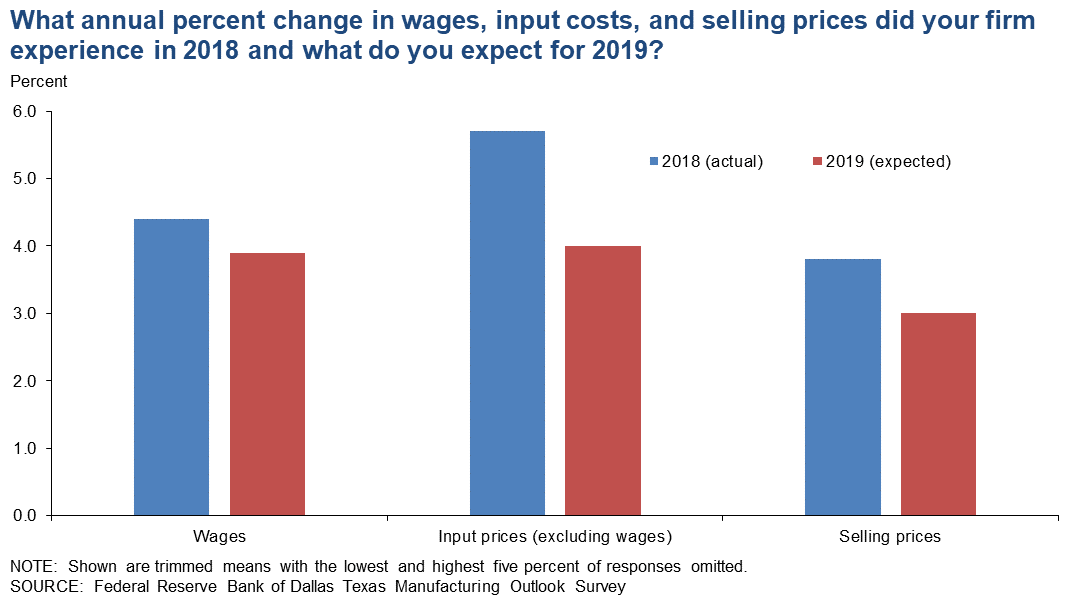
What annual percent change in wages, input prices, and selling prices did your firm experience in 2018 and what do you expect for 2019?
| 2018 actual (percent)* |
2019 expected (percent)* |
|
| Wages | 4.4 | 3.9 |
| Input costs (excluding wages) | 5.7 | 4.0 |
| Selling prices | 3.8 | 3.0 |
If costs (including wages) are increasing, to what extent are you passing the higher costs on to customers in the way of price increases?
| Dec. '18 (percent) |
||
| None | 17.2 | |
| Some | 50.5 | |
| Most | 23.2 | |
| All | 9.1 |
If costs (including wages) are increasing, how has your firm’s ability to pass those increases on to customers changed over the past six months?
| Dec. '18 (percent) |
||
| Much easier now | 1.0 | |
| Somewhat easier now | 26.5 | |
| Similar to six months ago | 35.7 | |
| Somewhat harder now | 20.4 | |
| Significantly harder now | 16.3 |
How has your firm’s operating margin, defined as earnings before interest and taxes (EBIT) as a share of total revenue, changed over the past six months?
| Dec. '18 (percent) |
||
| Increased substantially | 11.1 | |
| Increased slightly | 24.2 | |
| Remained the same | 17.2 | |
| Decreased slightly | 35.4 | |
| Decreased substantially | 12.1 |
*Shown are trimmed means with the lowest and highest 5 percent of responses omitted. A similar question was posed in May 2018 asking about wages and prices in 2017 (actual) and 2018 (expected).
Special Questions Comments
These comments have been edited for publication.
Food Manufacturing
- Cost decreases are per ton and are driven by volume and low commodity prices. The current crop is much smaller, and per-ton costs will be rising in the coming months.
- The increase in EBIT [earnings before interest and taxes] is a result of significant growth on the top line.
Apparel Manufacturing
- We are getting to be more efficient the longer we have military sewing projects.
Printing and Related Support Activities
- Increases in unit wage and raw material costs are primarily offset with increased productivity in this manufacturing business. Wage increases have not outpaced volume and production rate increases.
Fabricated Metal Product Manufacturing
- Some utility companies understand and will accept some price increases due to steel price and shipping cost increases. However, some large privately funded and federal jobs are now sourcing their steel structures from foreign sources, causing us to be price uncompetitive.
- There is strong competition for the work that we do. Margins have continued to narrow due to excess capacity and firms willing to bid work at or below costs to maintain production capacity.
- Operating margin has increased, primarily due to capital investments in manufacturing equipment. With these investments, we have improved efficiency while maintaining head count.
Computer and Electronic Product Manufacturing
- We had contraction in the latter half of 2018 and kept key employees in anticipation of expanding in 2019. We are starting to see significant expansion for 2019.
Electrical Equipment, Appliance and Component Manufacturing
- Our industry is finally realizing that you have to pass on cost increases in good times, and our improved profitability in the last 18 months is commendable. We did a salary survey of companies and found we were low on starting pay for our hourly workforce. Eighty-five percent of our people are hourly. We are making adjustments in January to be competitive and hopefully cut turnover and attract better candidates. Ten percent is a guess on the total impact to our wage rates.
Transportation Equipment Manufacturing
- Competition from India, China and South Korea has resulted in a substantial decrease of business for us. Although raw steel has tariffs on imports, the finished goods resulting from the raw materials do not. This has given our foreign competition a very unfair advantage over U.S. manufacturers.
- Our ability to pass increases in costs (including wages) along to customers is somewhat harder because new contracts and agreements require extended price guarantees for multiple years, with one exception. Increases in raw material costs remain easy to pass along. Operating margins have decreased slightly in the past six months because revenue declined unexpectedly while investment in personnel (additions and advanced training) increased in line with performance in the first half of 2018. However, this margin is a substantial increase from the previous year.
Texas Service Sector Outlook Survey
Data were collected Dec. 18–26, and 217 Texas business executives responded to the survey.
See data files with a full history of results.
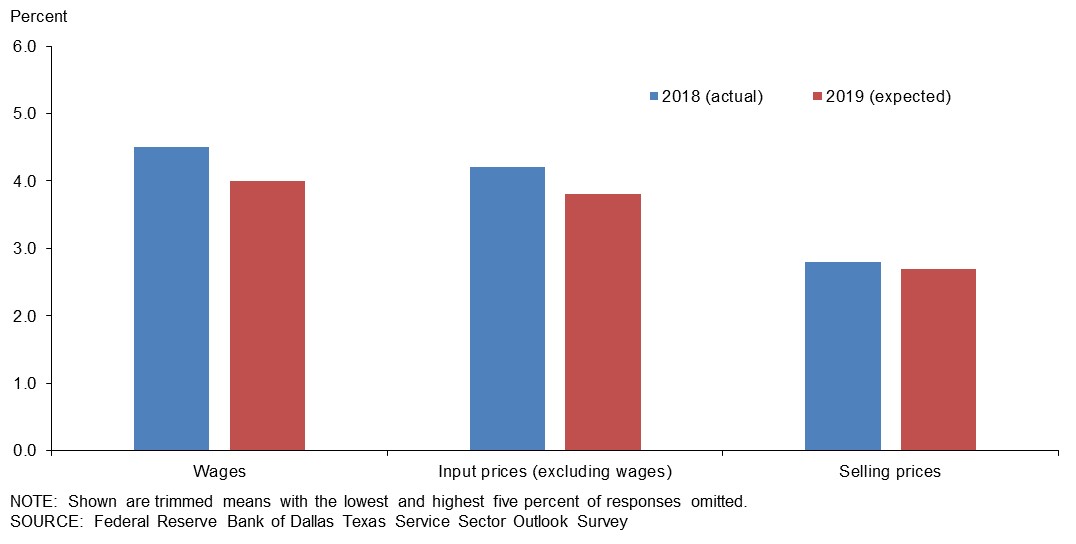
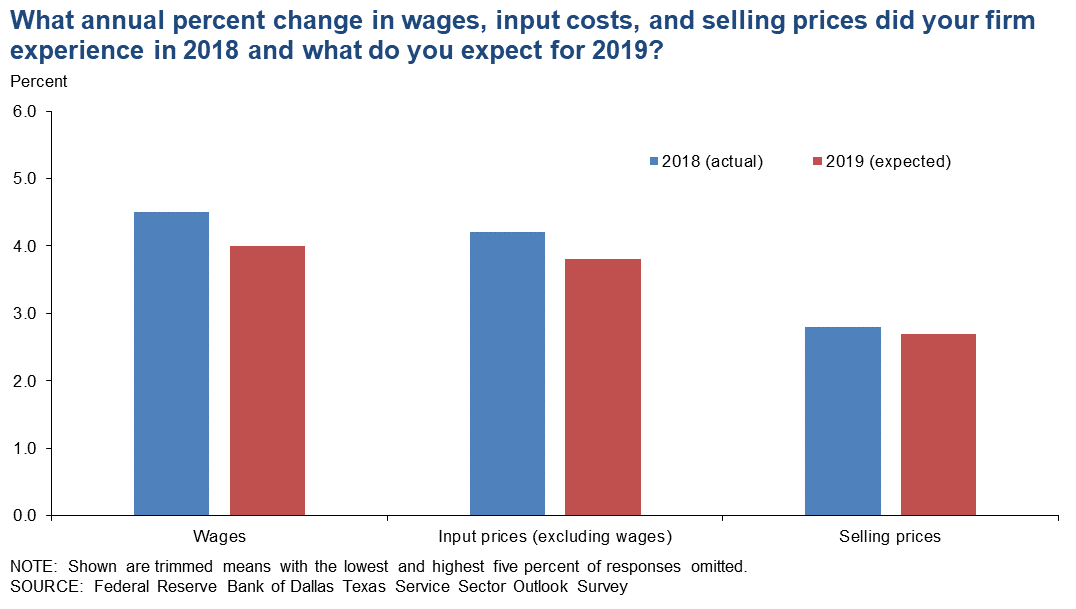
What annual percent change in wages, input prices, and selling prices did your firm experience in 2018 and what do you expect for 2019?
| 2018 actual (percent)* |
2019 expected (percent)* |
|
| Wages | 4.5 | 4.0 |
| Input costs (excluding wages) | 4.2 | 3.8 |
| Selling prices | 2.8 | 2.7 |
If costs (including wages) are increasing, to what extent are you passing the higher costs on to customers in the way of price increases?
| Dec. '18 (percent) |
||
| None | 28.0 | |
| Some | 48.5 | |
| Most | 15.5 | |
| All | 8.0 |
If costs (including wages) are increasing, how has your firm’s ability to pass those increases on to customers changed over the past six months?
| Dec. '18 (percent) |
||
| Much easier now | 1.6 | |
| Somewhat easier now | 15.0 | |
| Similar to six months ago | 41.5 | |
| Somewhat harder now | 25.4 | |
| Significantly harder now | 16.6 |
How has your firm’s operating margin, defined as earnings before interest and taxes (EBIT) as a share of total revenue, changed over the past six months?
| Dec. '18 (percent) |
||
| Increased substantially | 5.3 | |
| Increased slightly | 22.6 | |
| Remained the same | 27.9 | |
| Decreased slightly | 33.7 | |
| Decreased substantially | 10.6 |
*Shown are trimmed means with the lowest and highest 5 percent of responses omitted. A similar question was posed in May 2018 asking about wages and prices in 2017 (actual) and 2018 (expected).
Special Questions Comments
These comments have been edited for publication.
Credit Intermediation and Related Activities
- The majority of the increase in earnings is attributable to the lower corporate tax rate.
- It is all about pricing and that is influenced by competition, resulting in very thin prices over cost. Liquidity is a precious commodity in a heated lending environment, resulting in higher rates paid for deposits and expanding efforts by the too-big-to-fail banks into smaller communities for attracting local deposits.
Securities, Commodity Contracts, and Other Financial Investments and Related Activities
- It remains hard to pass price increases on to customers. Most customers are pushing hard for price decreases with their supply chain targets.
- The competitive landscape in wealth management is very difficult. Input costs of regulation and compliance continue to increase. Our ability to maintain our advising fee to clients is weak. Pricing in our industry is continually under pressure.
Insurance Carriers and Related Activities
- We are managing growth in routine operating expenses, but health care expenses are killing us. We have an aging workforce and we are self-insured—looking like a bad idea as health care costs and utilization of services increase.
Rental and Leasing Services
- We are a very capital-intensive business, so with 100 percent bonus depreciation, I can determine my year-end profit by what I add or do not add to my $222 million equipment rental fleet.
Professional, Scientific and Technical Services
- 2018 was a greatly improved year for selling services, passing along costs and improving margin.
- The uncertainty and the political unrest are hurting business.
Administrative and Support Services
- We were awarded new contracts.
Ambulatory Health Care Services
- As a health care provider in a deflationary market sector, we have no control over reimbursement and only know that it continues to go down a bit every year.
- The health care industry continues to be an increasing wage and operating cost model with a punitive reimbursement model that is eroding margins and leading to significant consolidation in the health care industry.
Nursing and Residential Care Facilities
- Health care is a regulated market with limited price elasticity, yet we continue to face wage pressure and cost pressure on top of new market entries who extract the few commercial and/or self-pay patients from an already stressed community hospital. Expect to see more hospital closures in 2019.
Amusement, Gambling and Recreation Industries
- The projections for 2019 are very difficult. We are not only having to raise wages but also increase benefits to attract and keep good employees. All other companies are having to do the same thing, so our cost of goods is going up all the time too.
Texas Retail Outlook Survey
Data were collected Dec. 18–26, and 41 Texas retailers responded to the survey.
See data files with a full history of results.
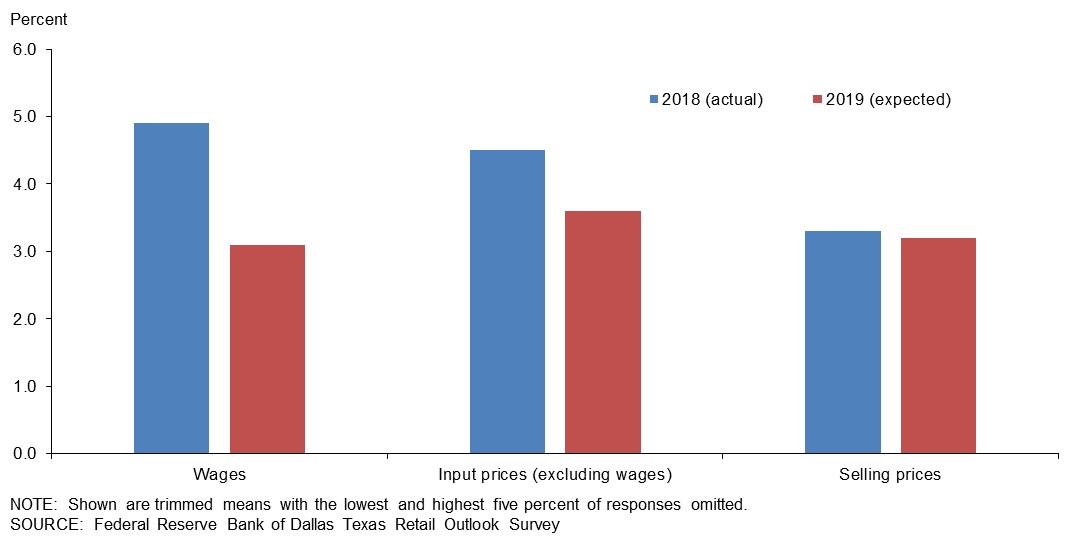
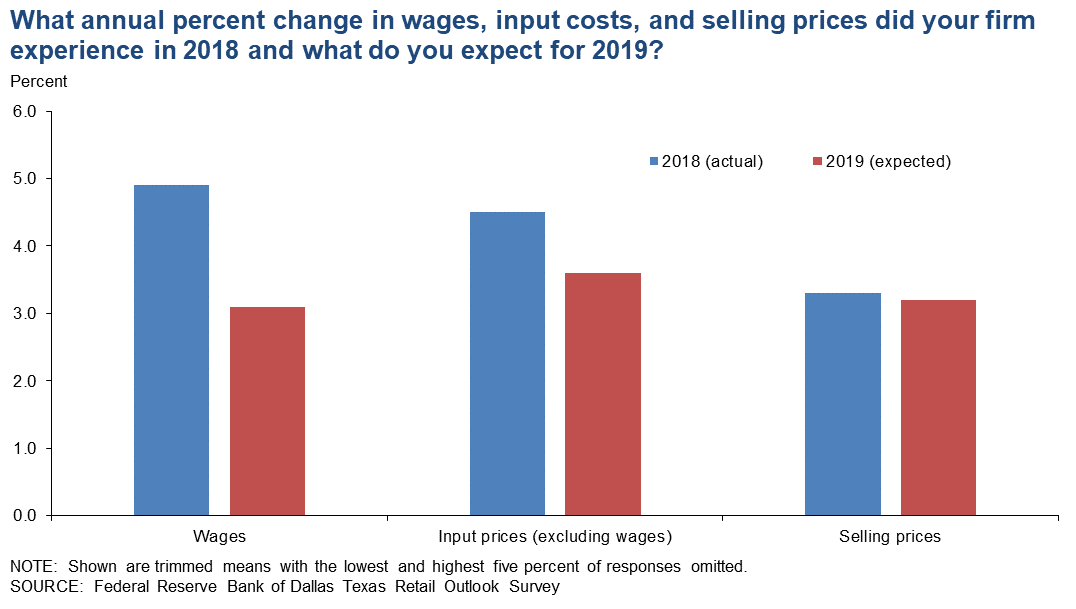
What annual percent change in wages, input prices, and selling prices did your firm experience in 2018 and what do you expect for 2019?
| 2018 actual (percent)* |
2019 expected (percent)* |
|
| Wages | 4.9 | 3.1 |
| Input costs (excluding wages) | 4.5 | 3.6 |
| Selling prices | 3.3 | 3.2 |
If costs (including wages) are increasing, to what extent are you passing the higher costs on to customers in the way of price increases?
| Dec. '18 (percent) |
||
| None | 18.4 | |
| Some | 52.6 | |
| Most | 15.8 | |
| All | 13.2 |
If costs (including wages) are increasing, how has your firm’s ability to pass those increases on to customers changed over the past six months?
| Dec. '18 (percent) |
||
| Much easier now | 5.3 | |
| Somewhat easier now | 7.9 | |
| Similar to six months ago | 28.9 | |
| Somewhat harder now | 36.8 | |
| Significantly harder now | 21.1 |
How has your firm’s operating margin, defined as earnings before interest and taxes (EBIT) as a share of total revenue, changed over the past six months?
| Dec. '18 (percent) |
||
| Increased substantially | 2.6 | |
| Increased slightly | 10.3 | |
| Remained the same | 23.1 | |
| Decreased slightly | 41.0 | |
| Decreased substantially | 23.1 |
*Shown are trimmed means with the lowest and highest 5 percent of responses omitted. A similar question was posed in May 2018 asking about wages and prices in 2017 (actual) and 2018 (expected).
Special Questions Comments
These comments have been edited for publication.
Merchant Wholesalers, Nondurable Goods
- Property taxes exceed any inflation. Manufacturers are all increasing prices due to wage pressures and potential tariffs. Customers remain very price sensitive. Increased interest rates will bring on the recession. The Federal Reserve has completely misread the data it is using.
Motor Vehicle and Parts Dealers
- There is continued pressure on fixed overhead—like insurance, property taxes, maintenance—as it relates to our brick-and-mortar locations.
- Internet pricing is causing severe downward pressure on new and used vehicle prices.
- Internet pricing is affecting all retail sales outlets. The automobile industry is especially changed because of the many makes and models and the many factory incentives that are hard for customers to compare and comprehend. Many buyers are being misled by internet ads and internet pricing. Factory incentives are based on total sales, so that large dealers have more discounts than small dealers because of volume of sales. Operating margins will continue to drop until this trend has stopped.
Questions regarding the Texas Business Outlook Surveys can be addressed to Emily Kerr at emily.kerr@dal.frb.org,
Sign up for our email alert to be automatically notified as soon as the latest surveys are released on the web.