Special Questions

Special Questions
November 25, 2019
Results below include responses from participants of all three surveys: Texas Manufacturing Outlook Survey, Texas Service Sector Outlook Survey and Texas Retail Outlook Survey.
Texas Business Outlook Surveys
Data were collected Nov. 12–20, and 370 Texas business executives responded to the surveys.
See data files with a full history of results.
Are you currently trying to hire?
| May ’19 (percent) |
Aug. ’19 (percent) |
Nov. ’19 (percent) |
|
| Yes | 71.4 | 69.8 | 60.0 |
| No | 28.6 | 30.2 | 40.0 |
NOTE: 370 responses.
Are you having problems finding qualified workers when hiring?
| May ’19 (percent) |
Aug. ’19 (percent) |
Nov. ’19 (percent) |
|
| Yes | 83.0 | 75.6 | 80.5 |
| No | 17.0 | 24.4 | 19.5 |
NOTES: 220 responses. This question was posed only to respondents that answered “Yes” to the preceding question.
If you are having problems finding qualified workers, what are the main reasons? Please check all that apply.
| Nov ’17 (percent) |
Nov ’18 (percent) |
Nov. ’19 (percent) |
|
| Lack of available applicants/no applicants | 58.6 | 70.6 | 66.9 |
| Lack of technical competencies (hard skills) | 49.8 | 43.3 | 48.0 |
| Lack of experience | 32.5 | 40.7 | 46.3 |
| Looking for more pay than is offered | 39.0 | 45.0 | 44.6 |
| Lack of workplace competencies (soft skills) | 37.3 | 39.0 | 41.7 |
| Inability to pass drug test and/or background check | 32.1 | 32.5 | 31.4 |
NOTES: 175 responses. This question was posed only to respondents that answered “Yes” to the preceding question.
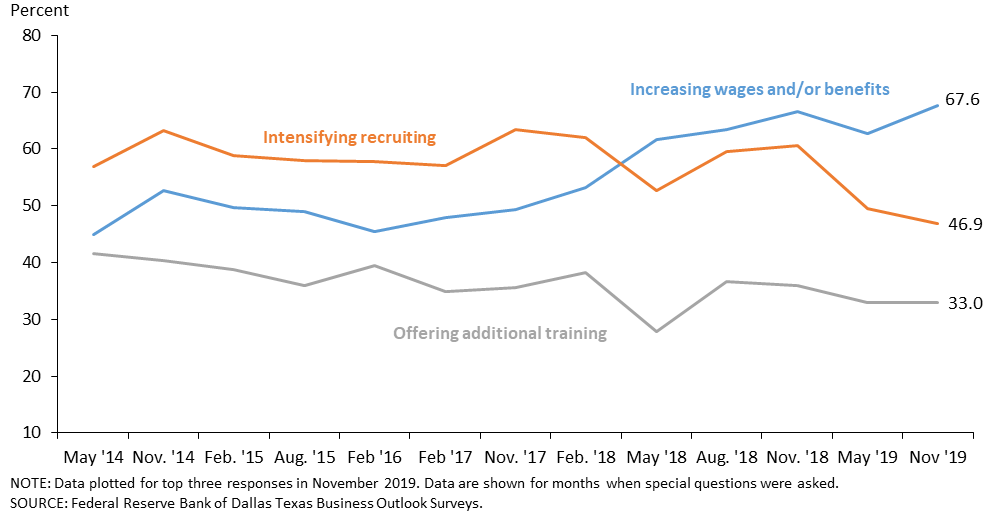
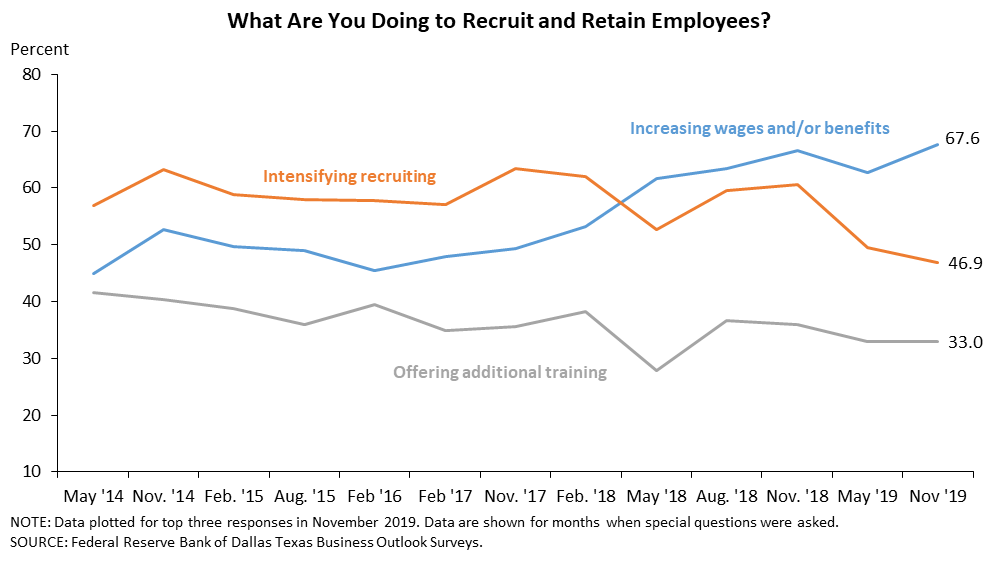
What, if anything, are you doing to recruit and retain employees? Please check all that apply.
| Nov ’17 (percent) |
Nov ’18 (percent) |
Nov. ’19 (percent) |
|
| Increasing wages and/or benefits | 49.4 | 66.6 | 67.6 |
| Increasing wages | 61.9 | 59.5 | |
| Intensifying recruiting, including advertising, paying recruiting bonuses, utilizing employment agencies, etc. | 63.5 | 60.7 | 46.9 |
| Offering additional training | 35.7 | 35.9 | 33.0 |
| Improving working conditions | 23.4 | 27.6 | 31.1 |
| Increasing variable pay, including bonuses | 29.2 | 29.1 | 30.7 |
| Increasing benefits | 20.1 | 24.6 | |
| Reducing education and other requirements for new hires | 8.8 | 12.1 | 9.1 |
NOTES: 309 responses. Starting in November 2018, "increasing wages" appears as a separate answer choice from "increasing benefits." We will continue to include the share of firms reporting increasing wages and/or benefits but as a calculation based on responses to "increasing wages" and "increasing benefits."
NOTE: Survey respondents were given the opportunity to provide comments. These comments can be found on the individual survey Special Questions results pages, accessible by the tabs above.
Texas Manufacturing Outlook Survey
Data were collected Nov. 12–20, and 111 Texas manufacturers responded to the surveys.
See data files with a full history of results.
Are you currently trying to hire?
| May ’19 (percent) |
Aug. ’19 (percent) |
Nov. ’19 (percent) |
|
| Yes | 72.7 | 64.0 | 59.5 |
| No | 27.3 | 36.0 | 40.5 |
NOTE: 111 responses.
Are you having problems finding qualified workers when hiring?
| May ’19 (percent) |
Aug. ’19 (percent) |
Nov. ’19 (percent) |
|
| Yes | 79.5 | 83.6 | 86.2 |
| No | 20.5 | 16.4 | 13.8 |
NOTES: 65 responses. This question was posed only to respondents that answered “Yes” to the preceding question.
If you are having problems finding qualified workers, what are the main reasons? Please check all that apply.
| Nov ’17 (percent) |
Nov ’18 (percent) |
Nov. ’19 (percent) |
|
| Lack of available applicants/no applicants | 51.4 | 69.9 | 70.9 |
| Lack of technical competencies (hard skills) | 61.1 | 57.5 | 54.5 |
| Lack of workplace competencies (soft skills) | 37.5 | 45.2 | 52.7 |
| Looking for more pay than is offered | 36.1 | 43.8 | 47.3 |
| Inability to pass drug test and/or background check | 45.8 | 42.5 | 43.6 |
| Lack of experience | 31.9 | 38.4 | 38.2 |
NOTES: 55 responses. This question was posed only to respondents that answered “Yes” to the preceding question.
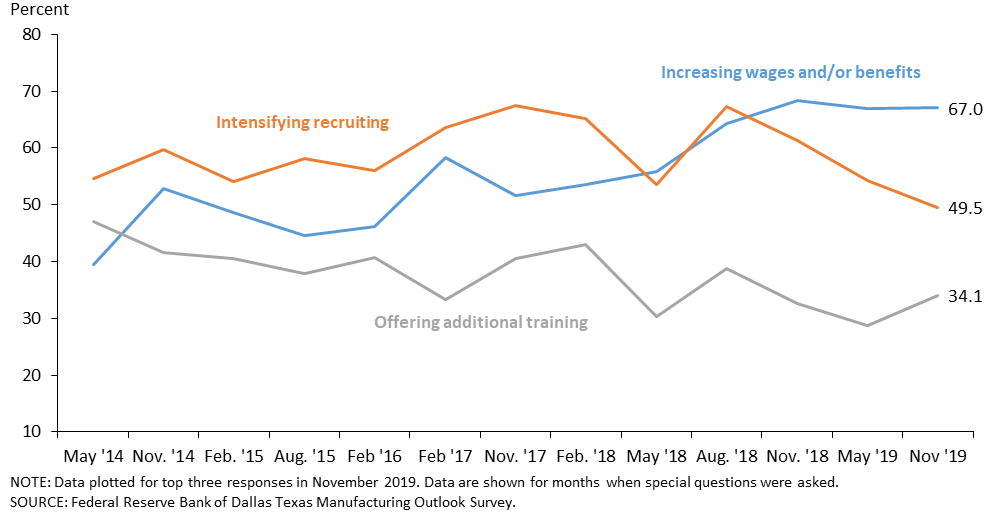
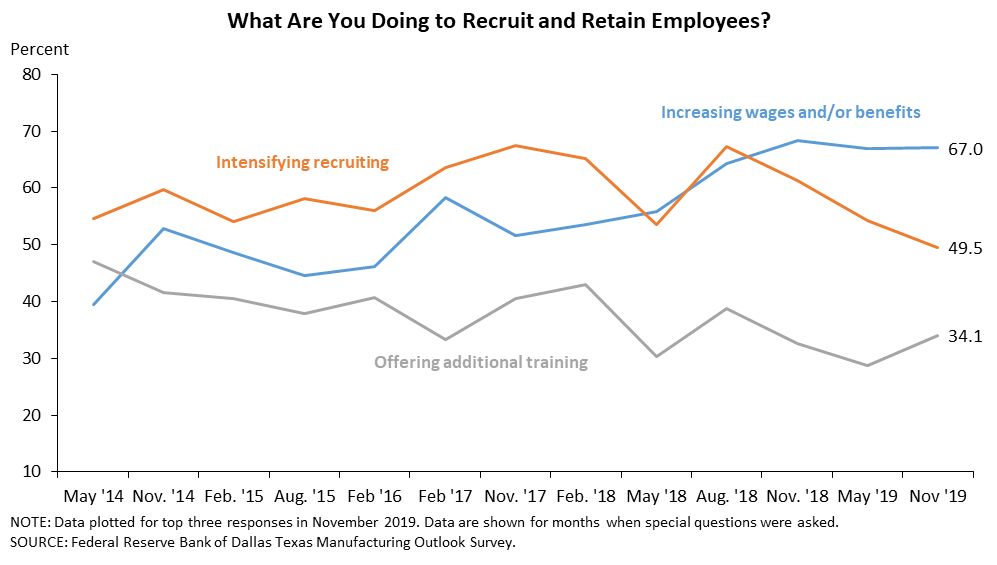
What, if anything, are you doing to recruit and retain employees? Please check all that apply.
| Nov ’17 (percent) |
Nov ’18 (percent) |
Nov. ’19 (percent) |
|
| Increasing wages and/or benefits | 51.7 | 68.4 | 67.0 |
| Increasing wages | 63.3 | 62.6 | |
| Intensifying recruiting, including advertising, paying recruiting bonuses, utilizing employment agencies, etc. | 67.4 | 61.2 | 49.5 |
| Offering additional training | 40.4 | 32.7 | 34.1 |
| Improving working conditions | 24.7 | 30.6 | 29.7 |
| Increasing variable pay, including bonuses | 28.1 | 24.5 | 24.2 |
| Increasing benefits | 16.3 | 24.2 | |
| Reducing education and other requirements for new hires | 11.2 | 16.3 | 12.1 |
NOTES: 91 responses. Starting in November 2018, "increasing wages" appears as a separate answer choice from "increasing benefits." We will continue to include the share of firms reporting increasing wages and/or benefits but as a calculation based on responses to "increasing wages" and "increasing benefits."
Special Questions Comments
These comments have been edited for publication.
Chemical Manufacturing
- We always attempt to stay competitive with wages and benefits.
Machinery Manufacturing
- New hires with knowledge and experience are very difficult to find. However, the oil field is softening quickly, and we expect more people to be available over the next year with good resumes.
Food Manufacturing
- We already offer several services and training upon entering.
Wood Product Manufacturing
- People are begging to leave California if they can find a good job.
Paper Manufacturing
- Other industries are doing well and pulling at our reliable employees.
Texas Service Sector Outlook Survey
Data were collected Nov. 12–20, and 259 Texas business executives responded to the surveys.
See data files with a full history of results.
Are you currently trying to hire?
| May ’19 (percent) |
Aug. ’19 (percent) |
Nov. ’19 (percent) |
|
| Yes | 70.8 | 72.3 | 60.2 |
| No | 29.2 | 27.7 | 39.8 |
NOTE: 259 responses.
Are you having problems finding qualified workers when hiring?
| May ’19 (percent) |
Aug. ’19 (percent) |
Nov. ’19 (percent) |
|
| Yes | 84.5 | 72.5 | 78.1 |
| No | 15.5 | 27.5 | 21.9 |
NOTES: 155 responses. This question was posed only to respondents that answered “Yes” to the preceding question.
If you are having problems finding qualified workers, what are the main reasons? Please check all that apply.
| Nov ’17 (percent) |
Nov ’18 (percent) |
Nov. ’19 (percent) |
|
| Lack of available applicants/no applicants | 61.6 | 70.9 | 65.0 |
| Lack of experience | 32.8 | 41.8 | 50.0 |
| Lack of technical competencies (hard skills) | 45.2 | 36.7 | 45.0 |
| Looking for more pay than is offered | 40.1 | 45.6 | 43.3 |
| Lack of workplace competencies (soft skills) | 37.3 | 36.1 | 36.7 |
| Inability to pass drug test and/or background check | 26.6 | 27.8 | 25.8 |
NOTES: 120 responses. This question was posed only to respondents that answered “Yes” to the preceding question.
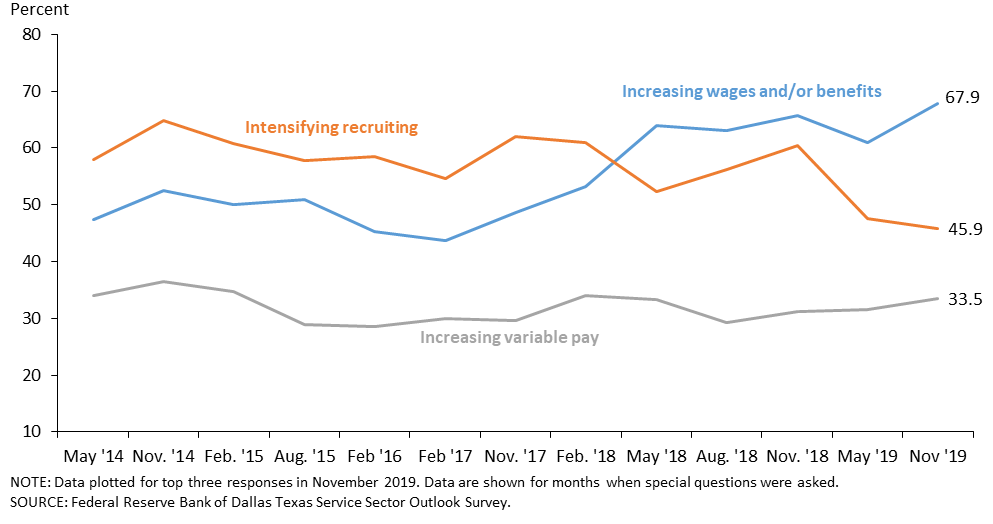
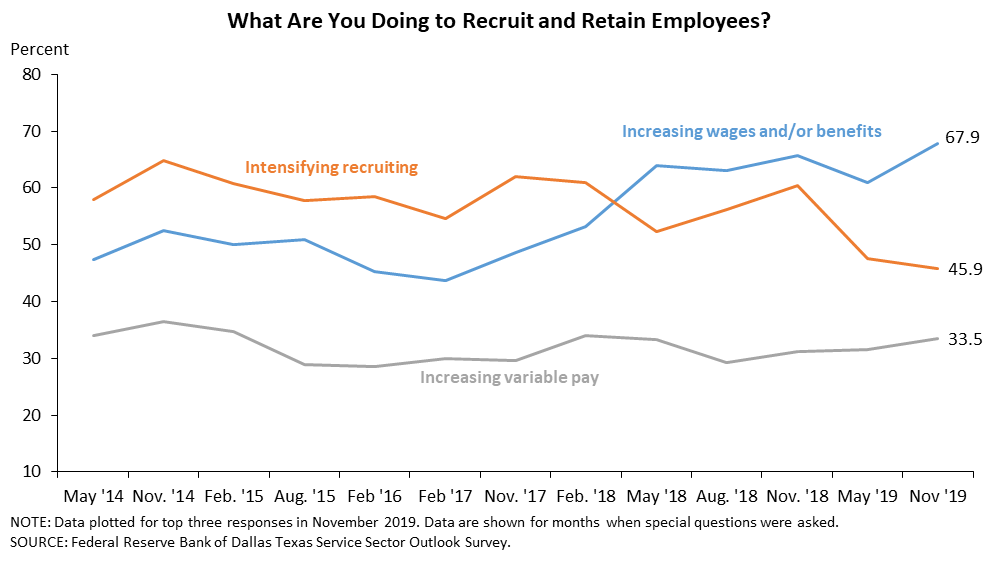
What, if anything, are you doing to recruit and retain employees? Please check all that apply.
| Nov ’17 (percent) |
Nov ’18 (percent) |
Nov. ’19 (percent) |
|
| Increasing wages and/or benefits | 48.6 | 65.8 | 67.9 |
| Increasing wages | 61.3 | 58.3 | |
| Intensifying recruiting, including advertising, paying recruiting bonuses, utilizing employment agencies, etc. | 62.1 | 60.4 | 45.9 |
| Increasing variable pay, including bonuses | 29.6 | 31.1 | 33.5 |
| Offering additional training | 34.0 | 37.3 | 32.6 |
| Improving working conditions | 22.9 | 26.2 | 31.7 |
| Increasing benefits | 21.8 | 24.8 | |
| Reducing education and other requirements for new hires | 7.9 | 10.2 | 7.8 |
NOTES: 218 responses. Starting in November 2018, "increasing wages" appears as a separate answer choice from "increasing benefits." We will continue to include the share of firms reporting increasing wages and/or benefits but as a calculation based on responses to "increasing wages" and "increasing benefits."
Special Questions Comments
These comments have been edited for publication.
Support Activities for Transportation
- We are increasing employee participation in industry organizations and charities. This is effectively increasing each individual's awareness of the value they bring both to the company internally and to the industry. Employee engagement was already strong; however, this activity is solidifying that level of engagement. We are also working with individual employees to structure professional growth plans.
Warehousing and Storage
- The labor force is extremely tight currently. We are improving our pay and benefits package in an effort to recruit and retain.
Data Processing, Hosting and Related Services
- Highly skilled technology hires are very difficult to find in the area—particularly those with leading-edge coding skills. We have started outsourcing the lower-level technology tasks to train our current workforce to take on more higher-skilled functions until we can find more qualified recruits.
Credit Intermediation and Related Activities
- It is becoming increasingly difficult to attract qualified applicants to rural markets and to compete with metropolitan markets. Succession planning is very challenging.
Securities, Commodity Contracts, and Other Financial Investments and Related Activities
- On average, every 1,000 applicants we have generates around five to seven candidates who are qualified or can pass a background check/drug screening. This is a significant problem, with no signs of the situation improving. More people seem to have a college education, but sadly, that doesn’t produce more applicants who can properly write a paragraph.
Rental and Leasing Services
- The only hires we are doing are to trade up and get better people. Overall, I have told my people to cut our workforce by 10 percent before 2020; we employ 708 people, so that is a significant amount.
Professional, Scientific and Technical Services
- We see no problem hiring lawyers. Some areas of staff are tighter—notably IT. We see tech firms being pretty aggressive in Austin as they ramp up.
Administrative and Support Services
- We have hired recently for a management position, as well as some entry-level employees. It is amazing at the management level how many people sent responses but did not show up for interviews. I see this all the time at the entry level but did not expect this in the more-experienced management levels.
Ambulatory Health Care Services
- It is a tough hiring market but not terrible. We can fill most positions and have many loyal employees. It is hardest at the lower end of the skills and pay scales, but we are not sure if it is any different from past times with low unemployment.
Amusement, Gambling and Recreation Industries
- The lack of employees is a real drain on productivity. It is also taking more and more time for the management staff to recruit and hire and train. It really affects the morale of the entire operation. It also makes the salaried employees work more hours to continue to do the basic job they were hired for. In other words, it is exhausting!
Personal and Laundry Services
- After 12 years in the business, my labor expense as a percentage of revenue is at an all-time high. The market is very competitive, and there are not enough applicants despite increased advertising and the offer of a $500 signing bonus.
Texas Retail Outlook Survey
Data were collected Nov. 12–20, and 47 Texas retailers responded to the surveys.
See data files with a full history of results.
Are you currently trying to hire?
| May ’19 (percent) |
Aug. ’19 (percent) |
Nov. ’19 (percent) |
|
| Yes | 70.0 | 75.5 | 57.4 |
| No | 30.0 | 24.5 | 42.6 |
NOTE: 47 responses.
Are you having problems finding qualified workers when hiring?
| May ’19 (percent) |
Aug. ’19 (percent) |
Nov. ’19 (percent) |
|
| Yes | 88.6 | 78.4 | 88.9 |
| No | 11.4 | 21.6 | 11.1 |
NOTES: 27 responses. This question was posed only to respondents that answered “Yes” to the preceding question.
If you are having problems finding qualified workers, what are the main reasons? Please check all that apply.
| Nov ’17 (percent) |
Nov ’18 (percent) |
Nov. ’19 (percent) |
|
| Lack of available applicants/no applicants | 59.5 | 66.7 | 70.8 |
| Lack of technical competencies (hard skills) | 54.8 | 45.5 | 66.7 |
| Lack of experience | 35.7 | 33.3 | 54.2 |
| Lack of workplace competencies (soft skills) | 33.3 | 39.4 | 50.0 |
| Inability to pass drug test and/or background check | 47.6 | 45.5 | 37.5 |
| Looking for more pay than is offered | 38.1 | 36.4 | 33.3 |
NOTES: 24 responses. This question was posed only to respondents that answered “Yes” to the preceding question.
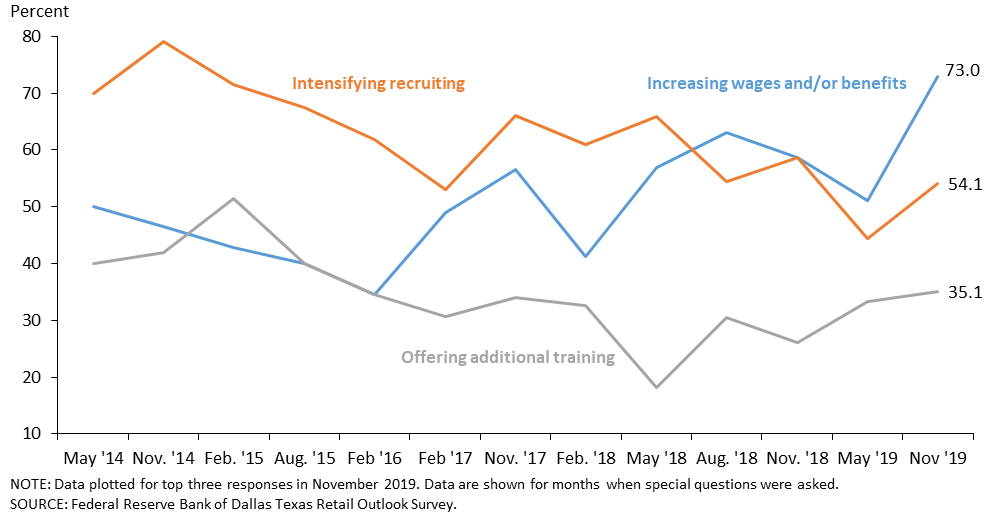
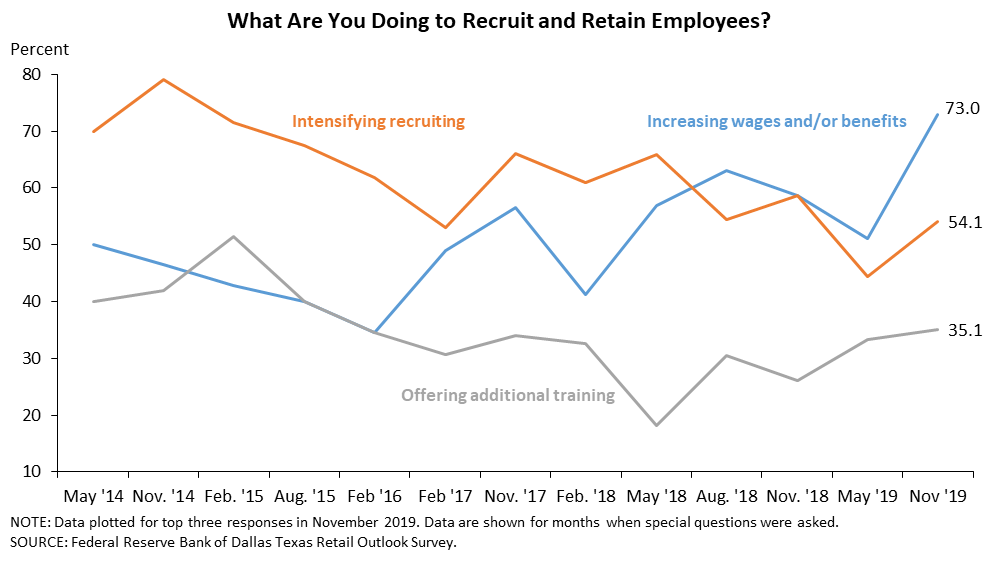
What, if anything, are you doing to recruit and retain employees? Please check all that apply.
| Nov ’17 (percent) |
Nov ’18 (percent) |
Nov. ’19 (percent) |
|
| Increasing wages and/or benefits | 56.6 | 58.7 | 73.0 |
| Increasing wages | 56.5 | 62.2 | |
| Intensifying recruiting, including advertising, paying recruiting bonuses, utilizing employment agencies, etc. | 66.0 | 58.7 | 54.1 |
| Offering additional training | 34.0 | 26.1 | 35.1 |
| Improving working conditions | 24.5 | 26.1 | 35.1 |
| Increasing variable pay, including bonuses | 39.6 | 30.4 | 32.4 |
| Increasing benefits | 15.2 | 29.7 | |
| Reducing education and other requirements for new hires | 13.2 | 10.9 | 5.4 |
NOTES: 37 responses. Starting in November 2018, "increasing wages" appears as a separate answer choice from "increasing benefits." We will continue to include the share of firms reporting increasing wages and/or benefits but as a calculation based on responses to "increasing wages" and "increasing benefits."
Special Questions Comments
These comments have been edited for publication.
Motor Vehicle and Parts Dealers
- We aren't trying to hire now but are always interested in hiring highly qualified candidates.
- We are willing to adjust starting pay according to experience and qualifications, but we still have some job openings available.
- Automotive technicians are in very short supply and will be in the foreseeable future.
Clothing and Clothing Accessories Stores
- The problem of finding qualified workers exists in the larger Texas cities significantly more than in the smaller Texas cities.
Questions regarding the Texas Business Outlook Surveys can be addressed to Emily Kerr at emily.kerr@dal.frb.org.
Sign up for our email alert to be automatically notified as soon as the latest surveys are released on the web.