Special Questions

Special Questions
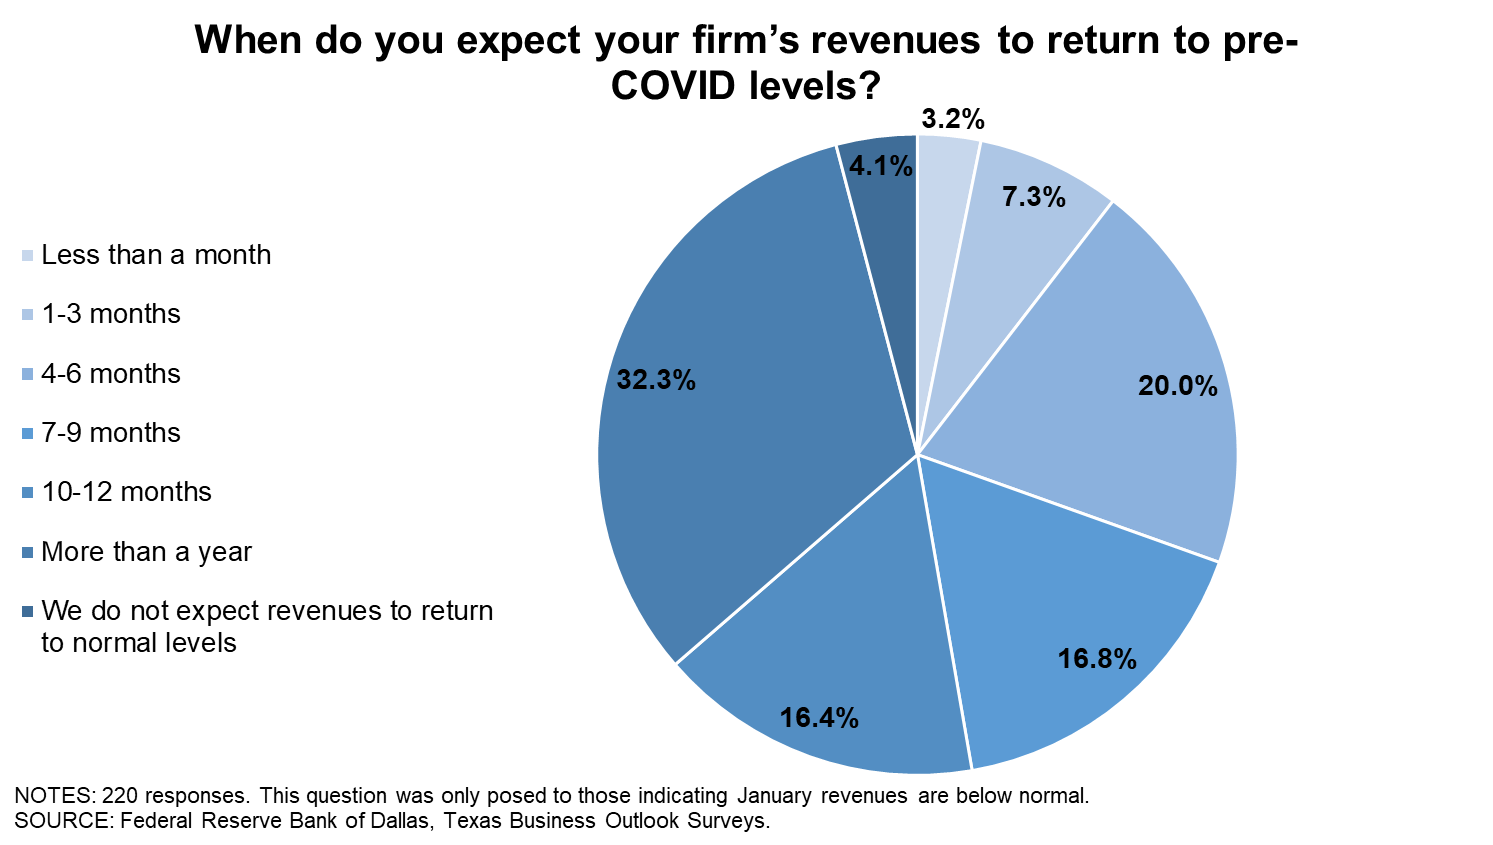
Texas Business Outlook Surveys
Data were collected January 12–20, and 387 Texas business executives responded to the surveys.
| Jul. '20 (percent) |
Sept. '20 (percent) |
Nov. '20 (percent) |
Jan. '21 (percent) |
|
| Share of firms reporting reduced revenues | 74.2 | 62.0 | 63.7 | 60.3 |
| Average revenue decline (Y/Y) | -29.1 | -31.3 | -28.7 | -25.4 |
| Share of firms reporting increased revenues | 15.5 | 21.0 | 19.9 | 20.0 |
| Average revenue increase (Y/Y) | 23.3 | 20.6 | 17.7 | 15.9 |
| Share of firms reporting no change in revenues | 10.3 | 17.0 | 16.4 | 19.7 |
NOTES: 370 responses. In past months the question wording was adjusted to reference the respective month of comparison. Averages are calculated as trimmed means with the lowest and highest 7.5 percent of responses omitted. Average revenue decline is calculated using only responses from firms that reported reduced revenues. Average revenue increase is calculated using only responses from firms that reported increased revenues.
| Jul. '20 (percent) |
Sept. '20 (percent) |
Nov. '20 (percent) |
Jan. '21 (percent) |
|
| Share of firms reporting reduced head count | 51.2 | 49.2 | 51.1 | 48.1 |
| Average head count decline (compared with Feb. 2020 levels) | -25.4 | -30.6 | -28.4 | -25.4 |
| Share of firms reporting increased head count | 14.0 | 17.5 | 13.2 | 19.8 |
| Average head count increase (compared with Feb. 2020 levels) | 15.6 | 14.8 | 15.2 | 10.9 |
| Share of firms reporting no change in head count | 34.8 | 33.3 | 35.7 | 32.1 |
NOTES: 374 responses. Averages are calculated as trimmed means with the lowest and highest 7.5 percent of responses omitted. Average head count decline is calculated using only responses from firms that reported reduced head count. Average head count increase is calculated using only responses from firms that reported increased head count.

| Jan. '21 (percent) |
|
| Yes | 30.7 |
| No | 69.3 |
NOTE: 375 responses.
Survey respondents were given the opportunity to provide comments. These comments can be found on the individual survey Special Questions results pages, accessible by the tabs above.
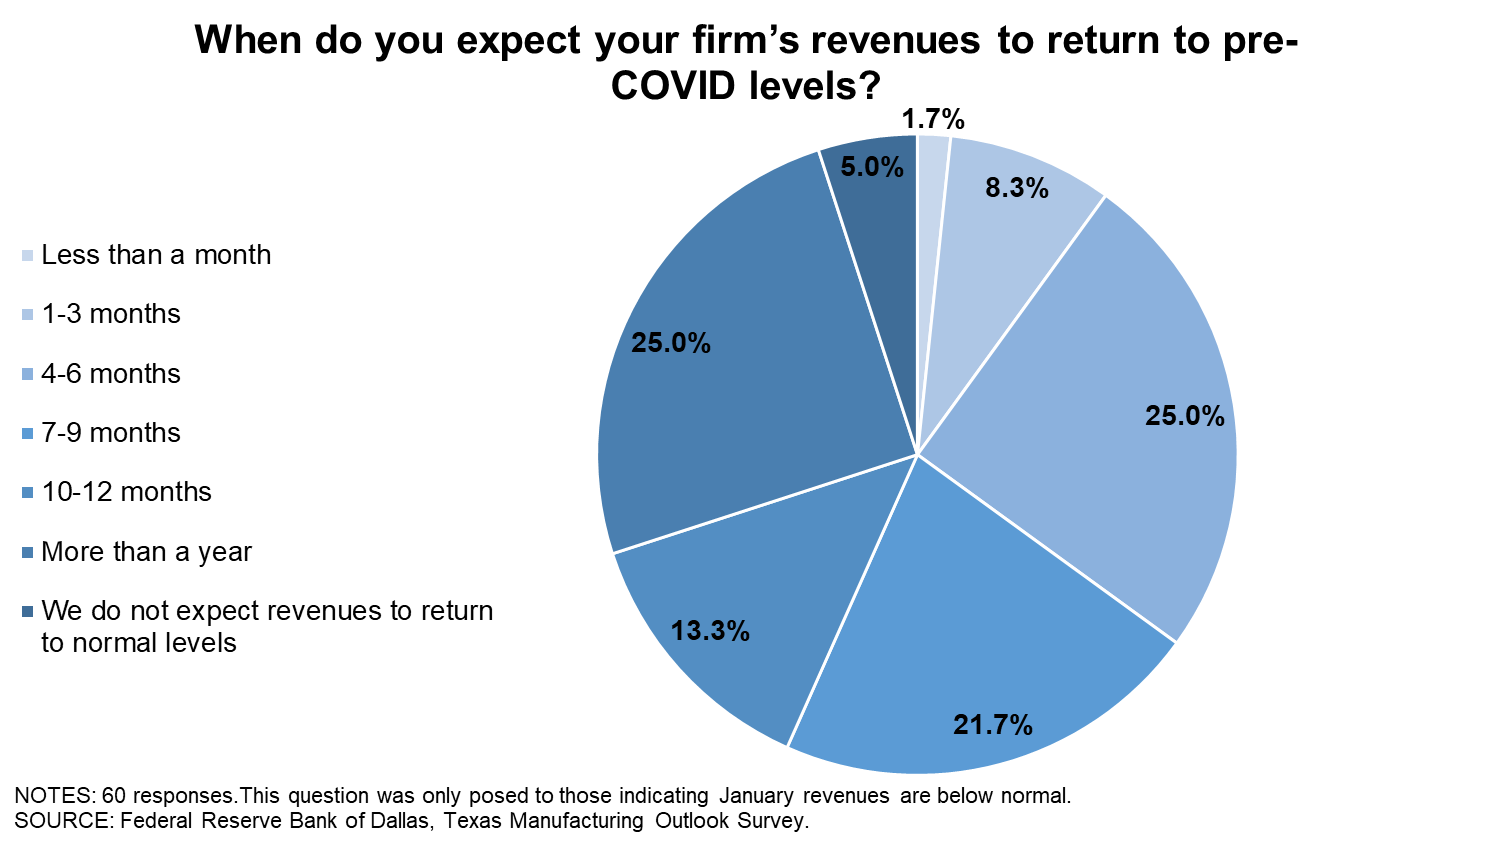
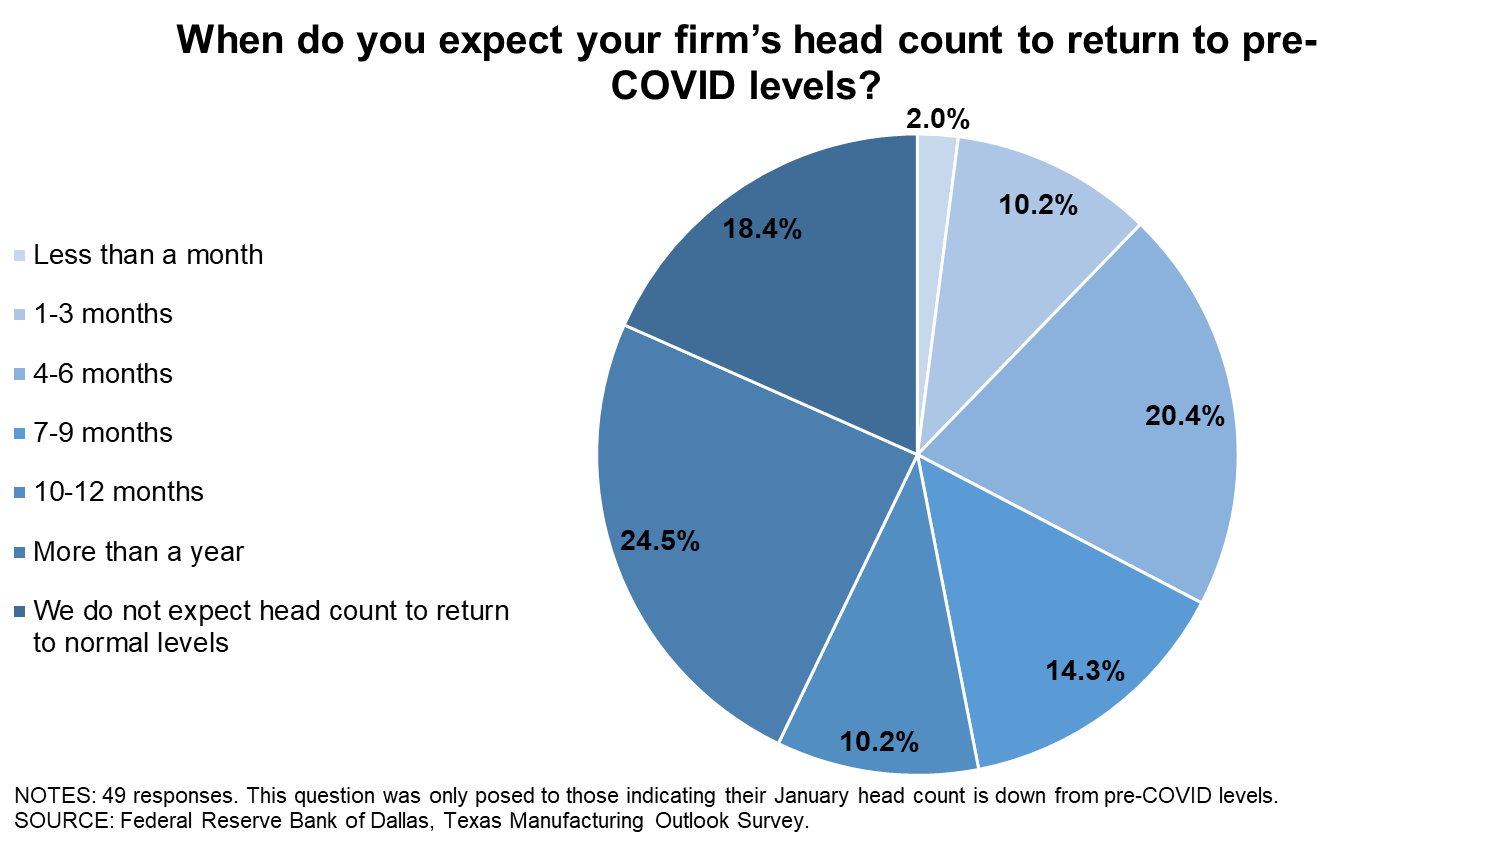
Texas Manufacturing Outlook Survey
Data were collected January 12–20, and 111 Texas manufacturers responded to the survey.
| Jul. '20 (percent) |
Sept. '20 (percent) |
Nov. '20 (percent) |
Jan. '21 (percent) |
|
| Share of firms reporting reduced revenues | 73.8 | 60.8 | 57.7 | 56.1 |
| Average revenue decline (Y/Y) | -30.5 | -28.9 | -30.7 | -22.2 |
| Share of firms reporting increased revenues | 19.4 | 23.5 | 29.8 | 27.1 |
| Average revenue increase (Y/Y) | 27.3 | 22.5 | 19.3 | 15.9 |
| Share of firms reporting no change in revenues | 6.8 | 15.7 | 12.5 | 16.8 |
NOTES: 107 responses. In past months the question wording was adjusted to reference the respective month of comparison. Averages are calculated as trimmed means with the lowest and highest 7.5 percent of responses omitted. Average revenue decline is calculated using only responses from firms that reported reduced revenues. Average revenue increase is calculated using only responses from firms that reported increased revenues.
| Jul. '20 (percent) |
Sept. '20 (percent) |
Nov. '20 (percent) |
Jan. '21 (percent) |
|
| Share of firms reporting reduced head count | 52.5 | 43.6 | 49.0 | 45.0 |
| Average head count decline (compared with Feb. 2020 levels) | -23.0 | -22.9 | -24.5 | -23.1 |
| Share of firms reporting increased head count | 21.2 | 16.8 | 17.3 | 28.4 |
| Average head count increase (compared with Feb. 2020 levels) | 22.5 | 13.1 | 22.0 | 9.9 |
| Share of firms reporting no change in head count | 26.3 | 39.6 | 33.7 | 26.6 |
NOTES: 109 responses. Averages are calculated as trimmed means with the lowest and highest 7.5 percent of responses omitted. Average head count decline is calculated using only responses from firms that reported reduced head count. Average head count increase is calculated using only responses from firms that reported increased head count.
| Jan. '21 (percent) |
|
| Yes | 32.4 |
| No | 67.6 |
NOTE: 108 responses.
Special Questions Comments
These comments have been edited for publication.
- We are working on PPP 2; we have more employees but lower volume due to a major change in the mix of business. We are working harder to make less money.
- It is disappointing—having been a business involved in the first round of PPP loans—that a decision on loan forgiveness for our company wasn’t made by the end of the year.
- Our overall view of the market has improved. While it isn’t expected to see pre-COVID levels of production, we do expect to see some growth this year as opposed to previous “flat” expectations.
- Uncertainty over federal highway spending is the biggest factor [for our outlook], and reduced demand for oil and gas due to COVID-19 lockdowns continues to affect capital spending in our markets.
- We are too big (successful) to qualify for PPP.
- Our sales were off 40 percent from May through July. They started improving from August until October, when they were close to our historical average. However, November and December were off 30 percent. We will be applying for the PPP 2 loan so that we can keep everyone employed.
- The change in consumer spending patterns has continued away from entertainment and travel expenses and toward home and real property improvements. This has been the COVID response of the consumer that is not adversely affected by the government’s response to COVID.
- We do not yet know if we are eligible for PPP.
- Our answer to question 1a is a result of the current political situation, not COVID. Our main competitor is China, and the new administration seems to favor China over U.S. industry.
- The stock market rebound has been amazing. And we have benefited from smart investments that have paid off wildly. If this continues, then we will be debt free within six months. However, this is not how we would prefer to see our financial success occur.
- We are considering applying for the second round of PPP, but we are determining our qualifications prior to submitting any applications.
- We are currently going over financials and the guidelines to see if we qualify for the new round of PPP.
- The new round of PPP is more restrictive, and we are unsure at this point if we would qualify for the program.
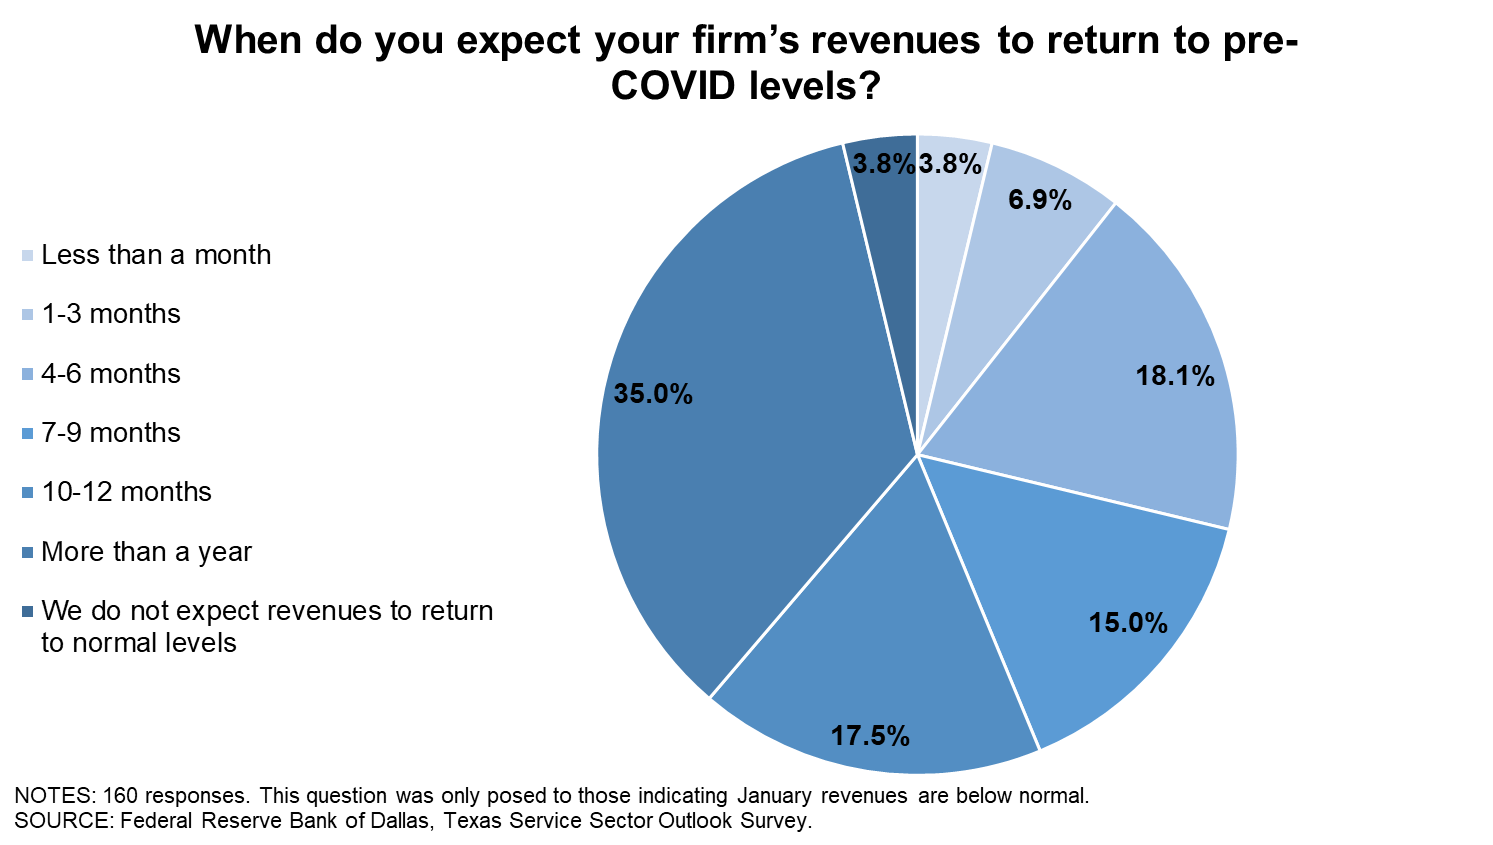
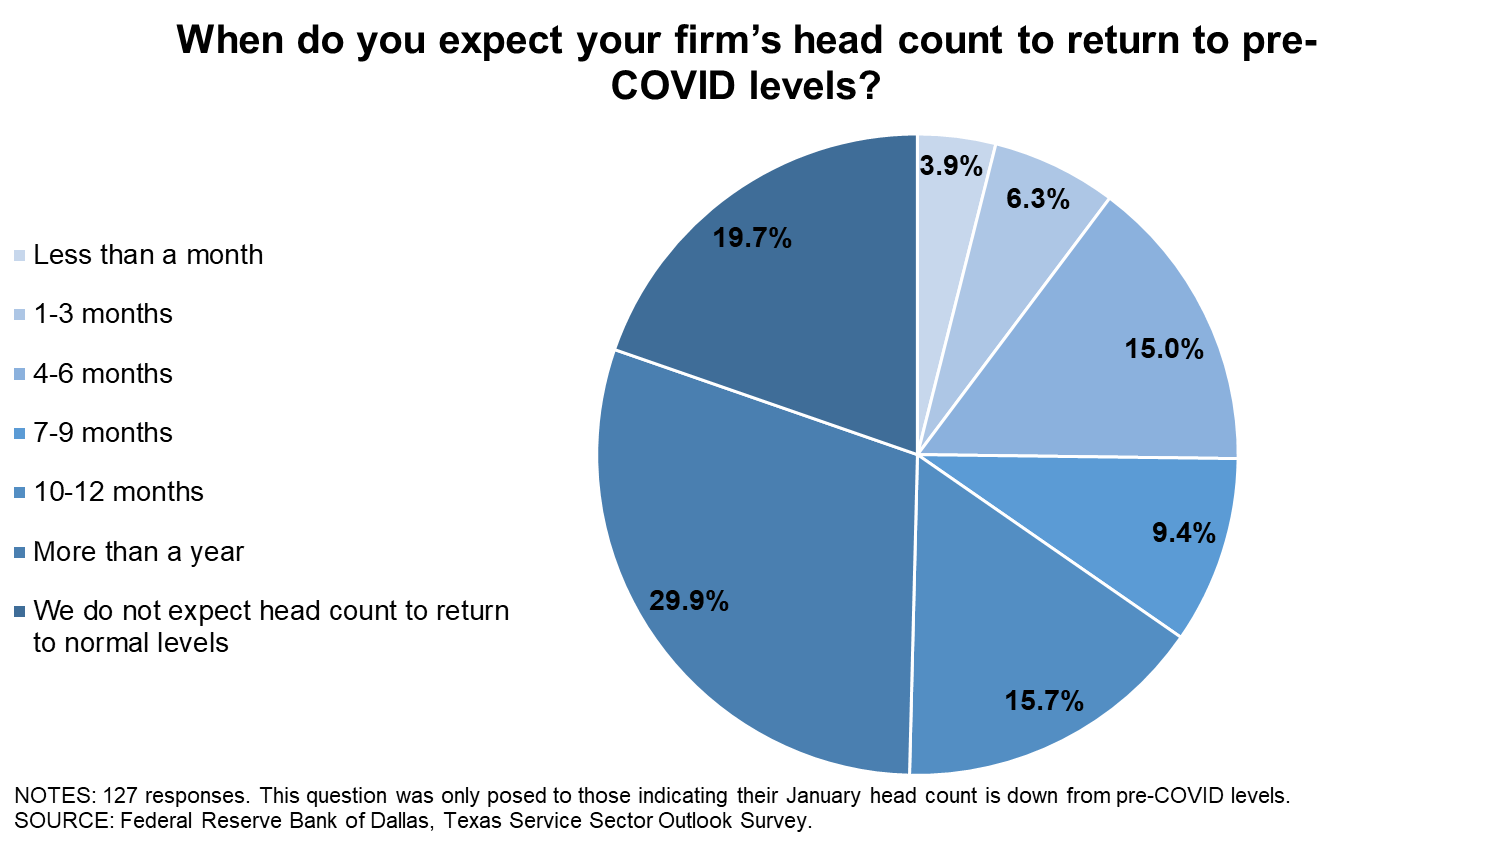
Texas Service Sector Outlook Survey
Data were collected January 12–20, and 276 Texas business executives responded to the survey.
| Jul. '20 (percent) |
Sept. '20 (percent) |
Nov. '20 (percent) |
Jan. '21 (percent) |
|
| Share of firms reporting reduced revenues | 74.4 | 62.5 | 66.0 | 62.0 |
| Average revenue decline (Y/Y) | -28.7 | -32.5 | -28.1 | -27.0 |
| Share of firms reporting increased revenues | 14.1 | 20.1 | 16.0 | 17.1 |
| Average revenue increase (Y/Y) | 23.1 | 19.7 | 16.4 | 17.2 |
| Share of firms reporting no change in revenues | 11.6 | 17.5 | 17.9 | 20.9 |
NOTES: 263 responses. In past months the question wording was adjusted to reference the respective month of comparison. Averages are calculated as trimmed means with the lowest and highest 7.5 percent of responses omitted. Average revenue decline is calculated using only responses from firms that reported reduced revenues. Average revenue increase is calculated using only responses from firms that reported increased revenues.
| Jul. '20 (percent) |
Sept. '20 (percent) |
Nov. '20 (percent) |
Jan. '21 (percent) |
|
| Share of firms reporting reduced head count | 50.7 | 51.3 | 51.9 | 49.4 |
| Average head count decline (compared with Feb. 2020 levels) | -26.7 | -33.1 | -30.4 | -26.8 |
| Share of firms reporting increased head count | 11.4 | 17.7 | 11.7 | 16.2 |
| Average head count increase (compared with Feb. 2020 levels) | 13.4 | 15.4 | 11.1 | 11.6 |
| Share of firms reporting no change in head count | 37.9 | 31.0 | 36.5 | 34.3 |
NOTES: 265 responses. Averages are calculated as trimmed means with the lowest and highest 7.5 percent of responses omitted. Average head count decline is calculated using only responses from firms that reported reduced head count. Average head count increase is calculated using only responses from firms that reported increased head count.
| Jan. '21 (percent) |
|
| Yes | 30.0 |
| No | 70.0 |
NOTE: 267 responses.
Special Questions Comments
These comments have been edited for publication.
- Our firm's revenue has been at or exceeded previous revenue throughout 2020. We have just closed our best year in 34 years of business. The "how" of that is a phenomenal story of leadership, team, brand, effort in the face of an enemy called COVID and a battle called NOW.
- Given the nature of our industry, a PPP [Paycheck Protection Program] loan would be viewed unfavorably by the media and far left.
- [As a banking sector firm,] PPP is not applicable to us.
- We see property tax, insurance and other nonessential increases.
- Hiring is tight; we increased our entry-level wage to $15 to keep up with others offering that as a base.
- PPP funding has been critical for our restaurant and the travel-related and entertainment-related tenants, but we are hoping it arrives in time to keep them viable.
- We didn't qualify for the PPP the first time and are sure we won't the second time but are sure we'll get to pay all that "government help" back!
- After applying for a PPP loan in the first round and having the amount of the loan excessively dictated to me by PPP, then trying to lower it (which was eventually done to a degree), then trying to lower it to the original amount needed and getting no response, I gave up. At this point, the supplemental unemployment for contract workers has proved to be more reliable (sort of) and much less hassle. So, no, I will not apply for another PPP loan.
- Business is stabilized by the last PPP loan we received. The SBA [Small Business Administration] did excellent and quick work helping us and many businesses. The business climate is improving, especially in the U.S., and we will stabilize and grow our business past COVID-level revenues in 2021. We will, however, miss President Trump's pro-business policies and actions.
- Technology and branch realignment are the reasons the head count will not return to pre-COVID levels. Banks aren't eligible for PPP.
- PPP needs to backstop ventures started in 2020. If there isn’t a comparison year, a small business building revenue should be eligible.
- One issue at a time please! COVID, new administration, run on the Capitol, intense hacking of systems, Chinese and Russian threats ... geez. I do feel optimistic that we will see normalization of our operations by mid-to-late 2021.
- The delay in government assistance is impeding our recovery and perception of an end to this nightmare.
- We are concerned that our company is big enough to be included in the new president's agenda on taxing business but is so close to the smallest in that group that we will get hurt and not be able to continue. We are in that exact situation with the ACA [Affordable Care Act] right now. We cannot increase our pricing, be competitive and continue to sustain our business.
- We're just now eligible for PPP (which is the only thing for which we are eligible), but as a government agency in Texas, the hoops (and expenses associated with those) we are going to have to jump through may not be worth it. I'll admit I hadn't paid enough attention before on the details/nuance and just saw the $2 million cap, which would have been significant and meaningful. But when you get into the details of 2.5X average MONTHLY payroll (monthly being the key word I'd missed in previous glances) of salaries up to $100,000, it's better than nothing to some extent, but it really doesn't add up to much; I'm having to weigh the costs of pursuing better than nothing versus just leaving it as is.
- There are too many delays in the program. At this point, [we need a] forgiveness assessment.
- We are hiring. Many others are as well. We just need candidates.
- We have implemented wage increases as a result of California’s and Florida’s minimum-wage increases. Input cost increases are a result of COVID-related changes at hotels, including increased cleaning supplies, personal protective equipment and increased guest supplies.
- It’s tough to hire help. We are over 1,000 employees short and can’t open our dining rooms due to the help shortage.
- Uncertainty is increasing.
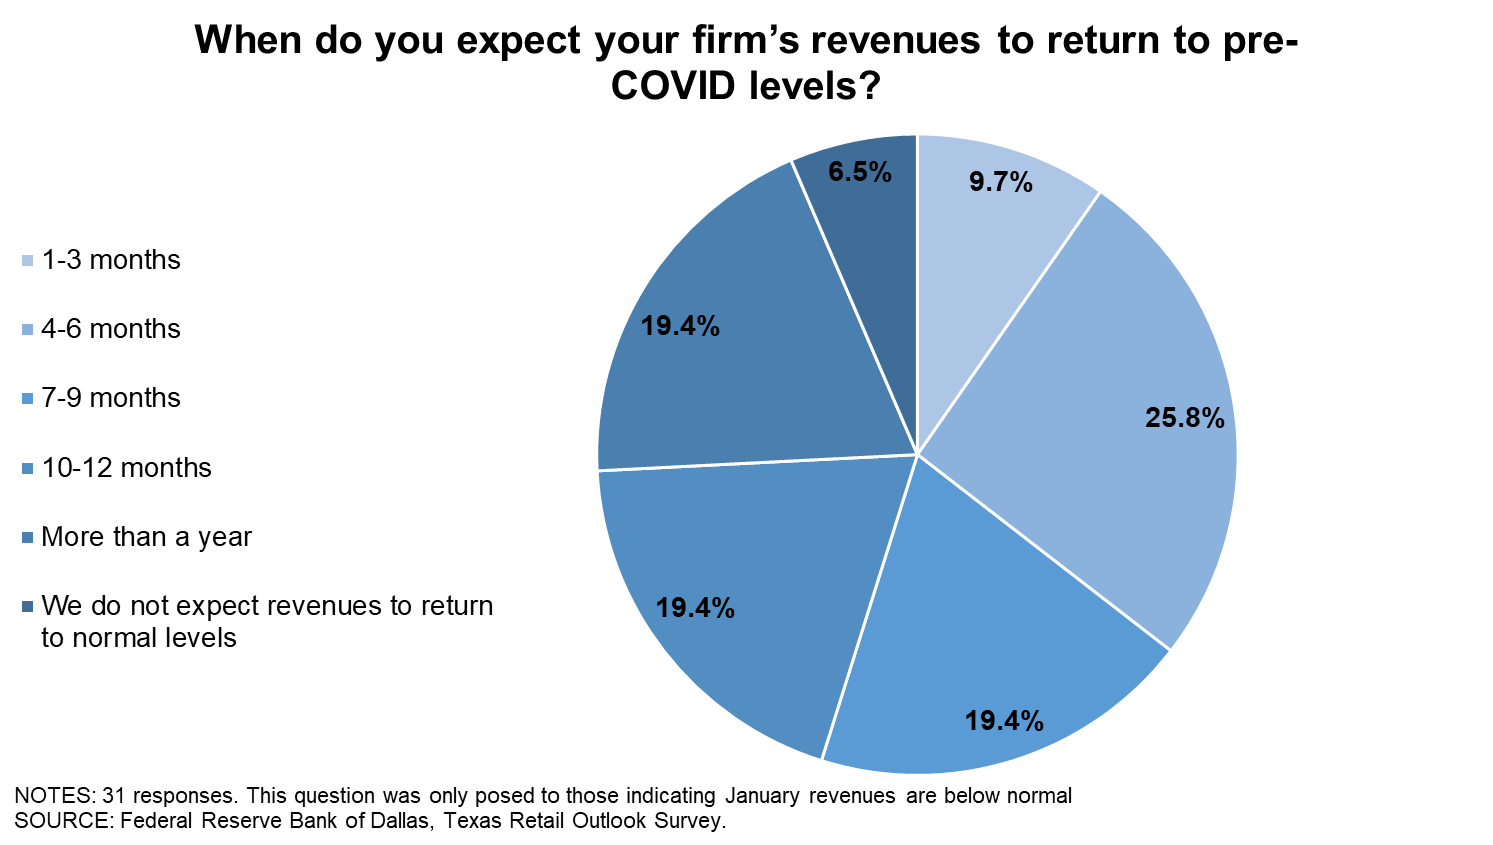
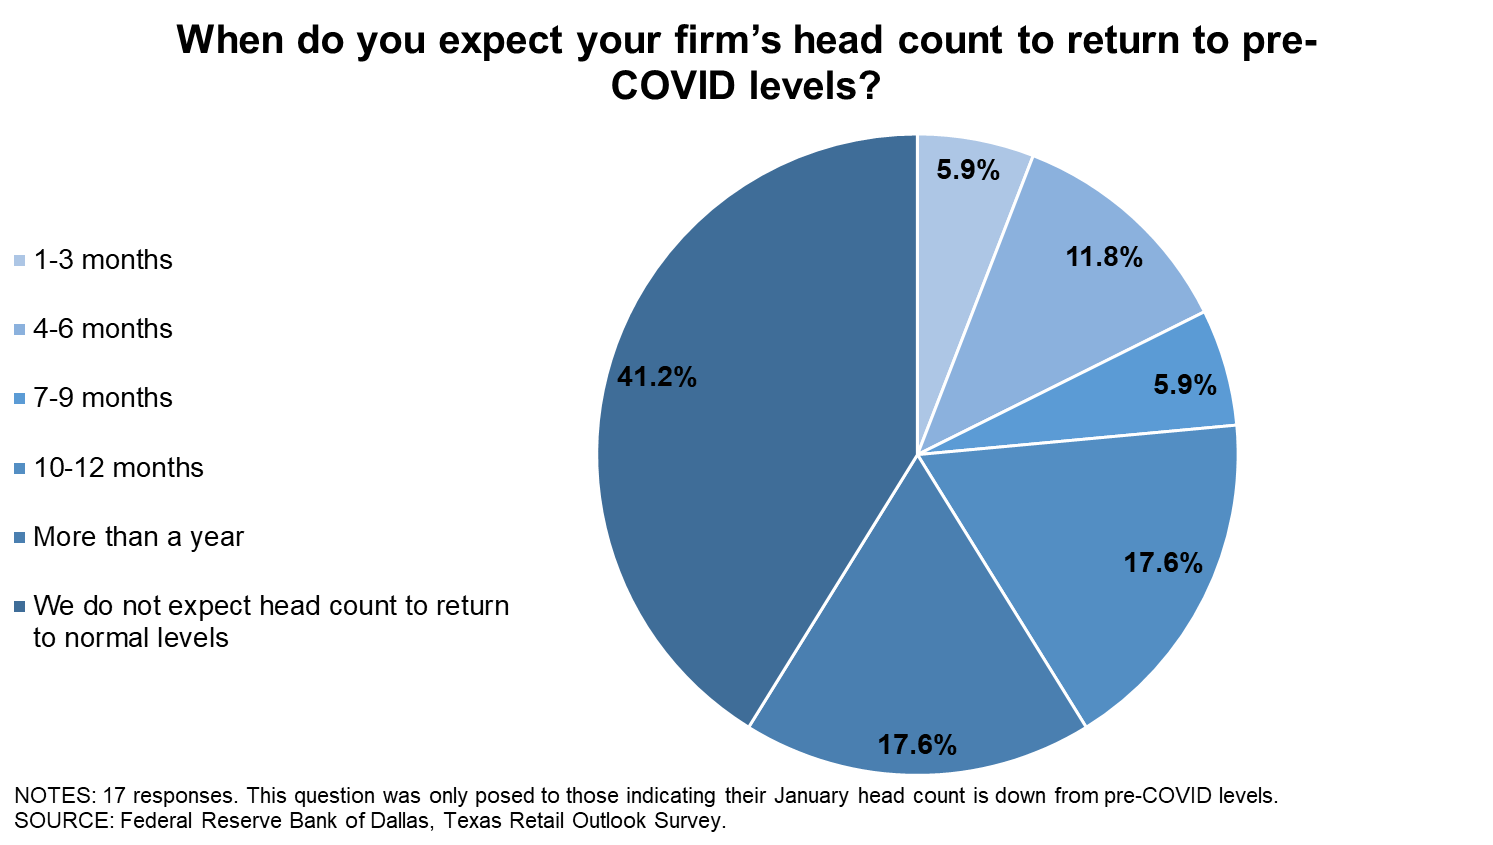
Texas Retail Outlook Survey
Data were collected January 12–20, and 52 Texas retailers responded to the survey.
| Jul. '20 (percent) |
Sept. '20 (percent) |
Nov. '20 (percent) |
Jan. '21 (percent) |
|
| Share of firms reporting reduced revenues | 76.0 | 58.5 | 66.7 | 64.0 |
| Average revenue decline (Y/Y) | -21.1 | -28.5 | -23.1 | -22.1 |
| Share of firms reporting increased revenues | 18.0 | 22.6 | 20.8 | 22.0 |
| Average revenue increase (Y/Y) | 20.7 | 22.0 | 30.3 | 24.5 |
| Share of firms reporting no change in revenues | 6.0 | 18.9 | 12.5 | 14.0 |
NOTES: 50 responses. In past months the question wording was adjusted to reference the respective month of comparison. Averages are calculated as trimmed means with the lowest and highest 7.5 percent of responses omitted. Average revenue decline is calculated using only responses from firms that reported reduced revenues. Average revenue increase is calculated using only responses from firms that reported increased revenues.
| Jul. '20 (percent) |
Sept. '20 (percent) |
Nov. '20 (percent) |
Jan. '21 (percent) |
|
| Share of firms reporting reduced head count | 52.0 | 53.7 | 46.9 | 38.0 |
| Average head count decline (compared with Feb. 2020 levels) | -17.4 | -31.2 | -25.6 | -26.7 |
| Share of firms reporting increased head count | 4.0 | 7.4 | 12.2 | 20.0 |
| Average head count increase (compared with Feb. 2020 levels) | 42.5 | 18.8 | 8.7 | 8.0 |
| Share of firms reporting no change in head count | 44.0 | 38.9 | 40.8 | 42.0 |
NOTES: 50 responses. Averages are calculated as trimmed means with the lowest and highest 7.5 percent of responses omitted. Average head count decline is calculated using only responses from firms that reported reduced head count. Average head count increase is calculated using only responses from firms that reported increased head count.
| Jan. '21 (percent) |
|
| Yes | 20.0 |
| No | 80.0 |
NOTE: 50 responses.
Special Questions Comments
These comments have been edited for publication.
- We had a decent 2020 so don't qualify for the new round of PPP, but now is when we are starting to see the pain of COVID.
- We have become more efficient over the last six to nine months and realized that our productivity has stayed the same with fewer employees. Staggering hours and opening for less hours has kept our profitability in line with pre-COVID profits. If sales at the retail level move higher, then we will add bodies, but as of now, wages and input prices are both moving higher.
- [There is] Uncertainty associated with trying to run a business in today's environment. Initial PPP response to forgiveness is unknown? [There are] Administrative issues due to numerous changes and policy decisions.
Questions regarding the Texas Business Outlook Surveys can be addressed to Emily Kerr at emily.kerr@dal.frb.org.
Sign up for our email alert to be automatically notified as soon as the latest surveys are released on the web.