Special Questions

Special Questions
Texas Business Outlook Surveys
Data were collected December 13–21, and 339 Texas business executives responded to the surveys.
| 2019 | 2020 | 2021 | 2022 | ||||||
| Expected (percent) |
Actual (percent) |
Expected (percent) |
Actual (percent) |
Expected (percent) |
Expected (percent) |
Actual (percent) |
Expected (percent) |
Expected (percent) |
|
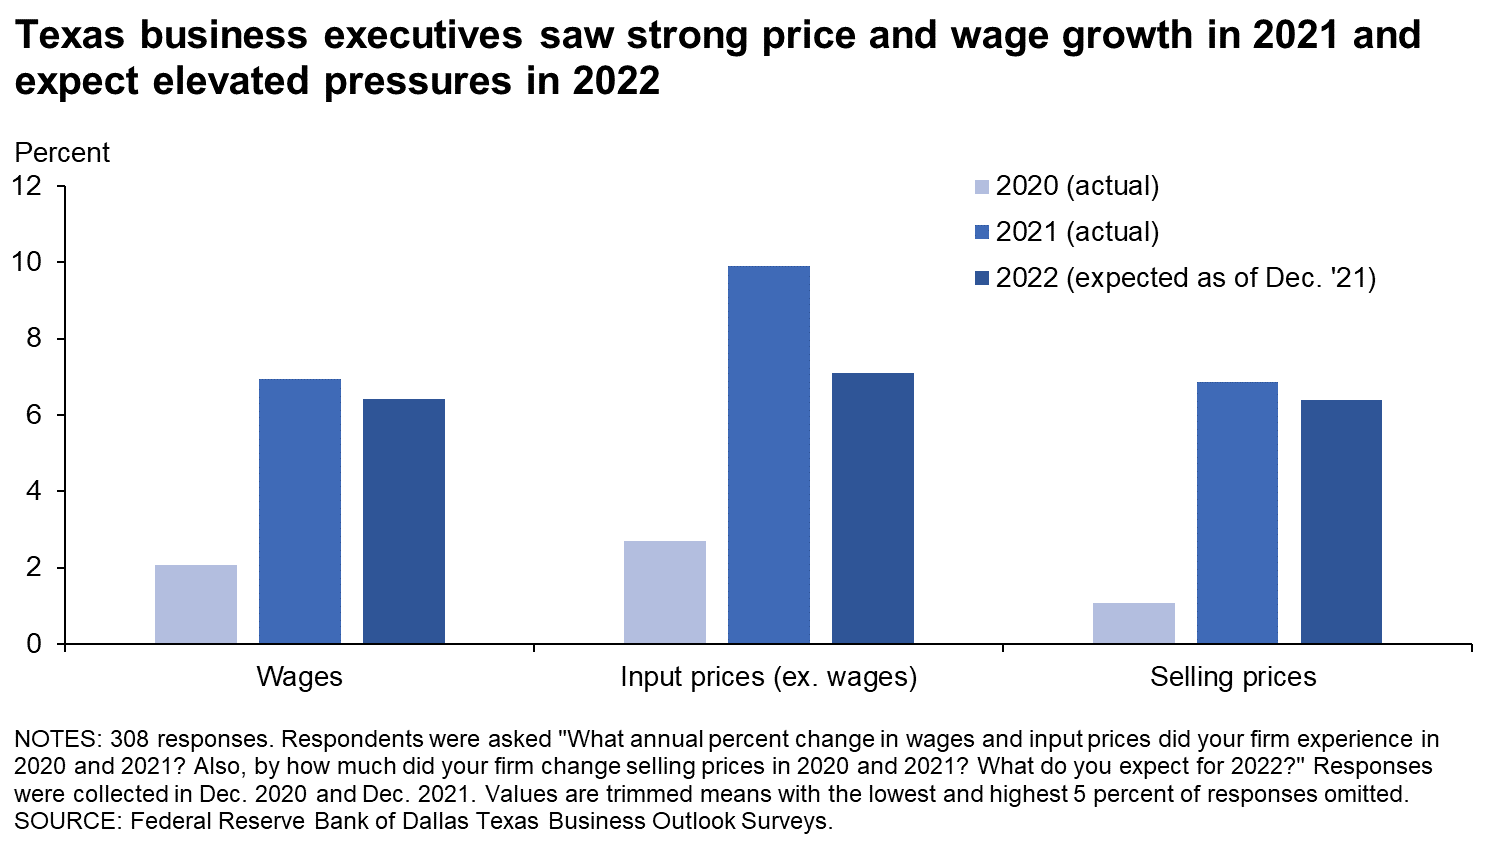
| Wages | 4.0 | 3.9 | 3.8 | 2.1 | 4.3 | 5.1 | 7.0 | 4.7 | 6.4 |
| Input prices | 3.8 | 3.4 | 3.3 | 2.7 | 3.7 | 6.7 | 9.9 | 4.7 | 7.1 |
| Selling prices | 2.8 | 2.4 | 2.8 | 1.1 | 3.4 | 5.3 | 6.9 | 4.4 | 6.4 |
| Data collected | Dec. '18 | Dec. '19 | Dec. '19 | Dec. '20 | Dec. '20 | Jul. '21 | Dec. '21 | Jul. '21 | Dec. '21 |
NOTES: 308 responses. Averages are calculated as trimmed means with the lowest and highest 5 percent of responses omitted.

| Dec. '18 (percent) |
Aug. '19 (percent) |
May '21 (percent) |
Jul. '21 (percent) |
Dec. '21 (percent) |
|
| None | 24.4 | 41.0 | 36.0 | 41.3 | 24.1 |
| Some | 49.2 | 43.9 | 38.4 | 37.5 | 40.6 |
| Most | 18.1 | 10.4 | 16.7 | 14.1 | 24.1 |
| All | 8.4 | 4.6 | 8.9 | 7.2 | 11.1 |
NOTE: 315 responses.
| May '21 (percent) |
Jul. '21 (percent) |
Dec. '21 (percent) |
|
| Raising prices in 2022 | 34.7 | 33.2 | 75.0 |
| Raising prices this year | 77.9 | 83.4 | 66.9 |
| Offering variable pricing or adding contract contingencies to allow for rising input costs | 9.9 | 13.9 | 21.6 |
| Offering reduced product or service for the same price | 12.7 | 6.4 | 10.2 |
| Adding a temporary price surcharge | 1.9 | * | 9.7 |
| Other | 9.4 | 6.4 | 5.9 |
NOTES: 236 responses. This question was posed only to those passing at least some of the higher costs on to customers. *This answer choice was not included in the Jul. ’21 survey.
| Dec. '18 (percent) |
May '19 (percent) |
Dec. '21 (percent) |
|
| Increased substantially | 7.2 | 6.2 | 9.9 |
| Increased slightly | 23.1 | 22.9 | 32.2 |
| Remained the same | 24.4 | 29.1 | 18.3 |
| Decreased slightly | 34.2 | 33.6 | 25.7 |
| Decreased substantially | 11.1 | 8.2 | 13.9 |
NOTE: 323 responses.
| Jul. '20 (percent) |
Aug. '21 (percent) |
Dec. '21 (percent) |
|
| Limited operating capacity due to staffing shortages (difficulty hiring, absenteeism, COVID-19 infections and quarantining, vaccine mandates, etc.) | 21.4 | 31.8 | 45.8 |
| Supply-chain disruptions | 16.9 | 40.8 | 44.3 |
| Weak demand | 57.3 | 23.9 | 19.4 |
| Reduced productivity due to alternative work arrangements | 14.8 | 9.0 | 9.2 |
| Limited operating capacity due to state/local restrictions | 20.6 | 5.4 | 4.3 |
| Other | 16.1 | 13.5 | 14.2 |
| None/not applicable | 12.4 | 21.1 | 14.8 |
NOTE: 325 responses.
Survey respondents were given the opportunity to provide comments. These comments can be found on the individual survey Special Questions results pages, accessible by the tabs above.
Texas Manufacturing Outlook Survey
Data were collected December 13–21, and 90 Texas manufacturers responded to the survey.
| 2019 | 2020 | 2021 | 2022 | ||||||
| Expected (percent) |
Actual (percent) |
Expected (percent) |
Actual (percent) |
Expected (percent) |
Expected (percent) |
Actual (percent) |
Expected (percent) |
Expected (percent) |
|
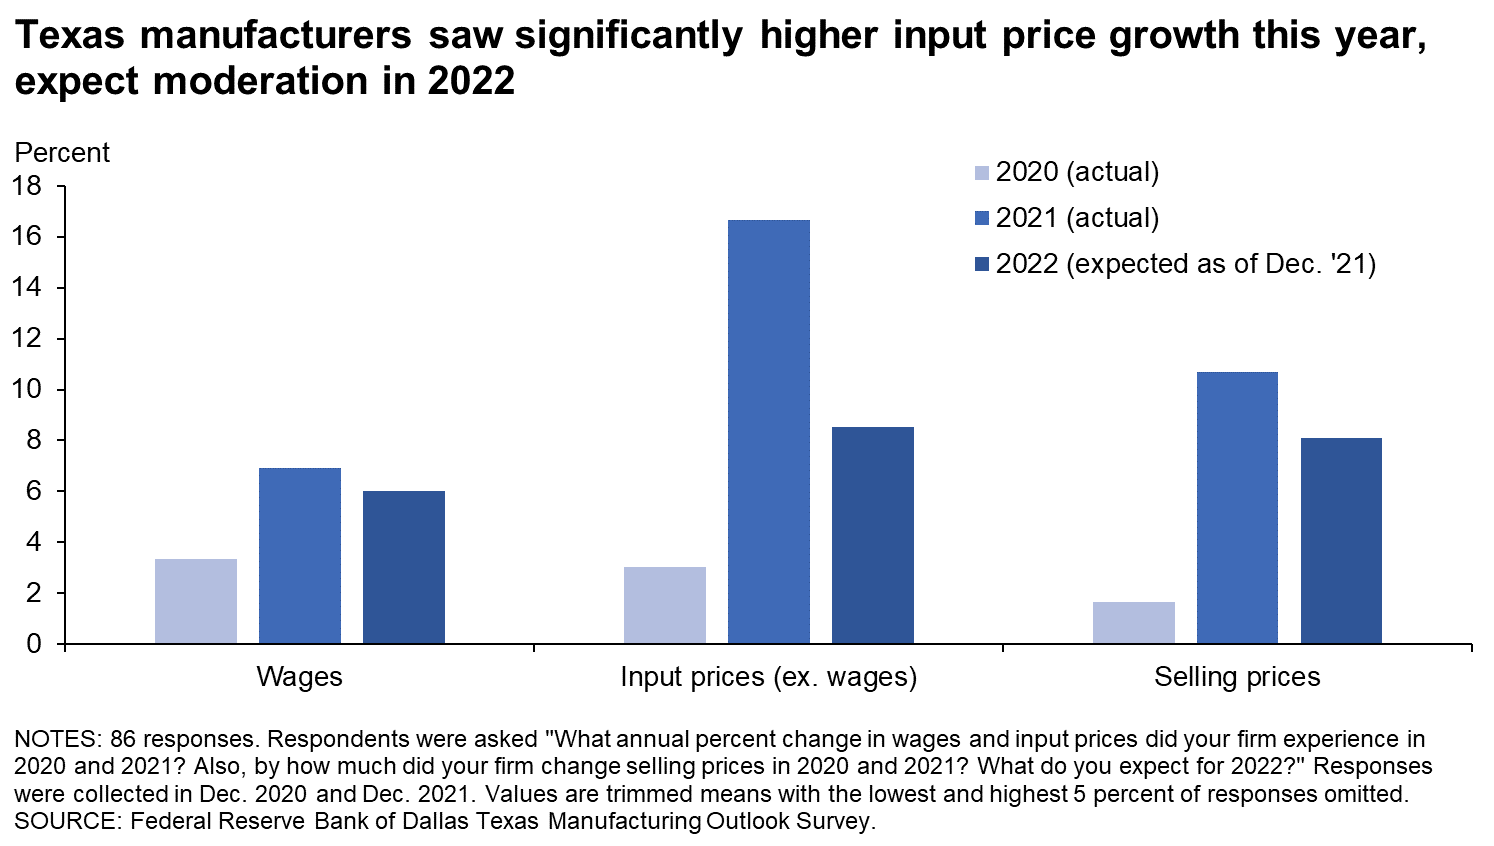
| Wages | 3.9 | 3.4 | 3.5 | 3.3 | 4.2 | 5.3 | 6.9 | 4.5 | 6.0 |
| Input prices | 4.0 | 3.2 | 3.2 | 3.0 | 4.6 | 11.5 | 16.7 | 4.9 | 8.5 |
| Selling prices | 3.0 | 2.2 | 3.0 | 1.6 | 3.9 | 8.3 | 10.7 | 4.4 | 8.1 |
| Data collected | Dec. '18 | Dec. '19 | Dec. '19 | Dec. '20 | Dec. '20 | Jul. '21 | Dec. '21 | Jul. '21 | Dec. '21 |
NOTES: 86 responses. Averages are calculated as trimmed means with the lowest and highest 5 percent of responses omitted.

| Dec. '18 (percent) |
Aug. '19 (percent) |
May '21 (percent) |
Jul. '21 (percent) |
Dec. '21 (percent) |
|
| None | 17.2 | 40.6 | 15.2 | 24.2 | 6.9 |
| Some | 50.5 | 45.5 | 44.6 | 41.8 | 35.6 |
| Most | 23.2 | 9.9 | 29.3 | 24.2 | 35.6 |
| All | 9.1 | 4.0 | 10.9 | 9.9 | 21.8 |
NOTE: 87 responses.
| May '21 (percent) |
Jul. '21 (percent) |
Dec. '21 (percent) |
|
| Raising prices this year | 84.6 | 88.4 | 77.8 |
| Raising prices in 2022 | 24.4 | 33.3 | 76.5 |
| Offering variable pricing or adding contract contingencies to allow for rising input costs | 20.5 | 18.8 | 25.9 |
| Adding a temporary price surcharge | 0.0 | * | 21.0 |
| Offering reduced product or service for the same price | 16.7 | 4.3 | 8.6 |
| Other | 7.7 | 2.9 | 1.2 |
NOTES: 81 responses. This question was posed only to those passing at least some of the higher costs on to customers. *This answer choice was not included in the Jul. ’21 survey.
| Dec. '18 (percent) |
May '19 (percent) |
Dec. '21 (percent) |
|
| Increased substantially | 11.1 | 11.4 | 4.6 |
| Increased slightly | 24.2 | 23.8 | 26.4 |
| Remained the same | 17.2 | 22.9 | 19.5 |
| Decreased slightly | 35.4 | 33.3 | 25.3 |
| Decreased substantially | 12.1 | 8.6 | 24.1 |
NOTE: 87 responses.
| Jul. '20 (percent) |
Aug. '21 (percent) |
Dec. '21 (percent) |
|
| Supply-chain disruptions | 25.2 | 72.2 | 75.9 |
| Limited operating capacity due to staffing shortages (difficulty hiring, absenteeism, COVID-19 infections and quarantining, vaccine mandates, etc.) | 31.1 | 44.4 | 56.3 |
| Weak demand | 65.0 | 21.1 | 19.5 |
| Reduced productivity due to alternative work arrangements | 10.7 | 8.9 | 12.6 |
| Limited operating capacity due to state/local restrictions | 3.9 | 2.2 | 2.3 |
| Other | 8.7 | 11.1 | 13.8 |
| None/not applicable | 10.7 | 7.8 | 0.0 |
NOTE: 87 responses.
Special Questions Comments
These comments have been edited for publication.
- It takes 3-5 new hires to get one new hire that stays. This doesn’t take into consideration the normal turnover we see. We continually struggle to maintain full staffing in some departments. Supply-chain constraints continue. We consistently see increased pricing or lead times. Our customers are just as frustrated as we are.
- Delays in major infrastructure projects and cost overruns on budgeted projects are delaying investment decisions and contracts. Delays in contracting for raw materials, especially steel strand, are impeding the hedging of raw materials and creating more uncertainty.
- We have all the business we can handle, as long as we can get good people to work and receive our raw materials in a timely manner.
- We’ve raised prices to either raise margins or offset price increases. We’ve been able to do this because the media is constantly talking about supply-chain problems, inflation, labor-cost increases, energy-cost increases, etc. This has given us cover to increase prices without any objections from customers. And we will continue to increase prices as long as this condition exists. This is the first time in three years we’ve been able to increase prices and have them stick with no objection.
- What is the Federal Reserve doing to contain inflation and government spending? Is the Fed warning the government about how the incredible spending is going to affect inflation and long-term debt?
- Our company exports approximately 55 percent of our manufactured goods. We are finding it harder to compete against European, Scandinavian and Asian manufacturers, which are subsidized by incentives through their governments.
Texas Service Sector Outlook Survey
Data were collected December 13–21, and 249 Texas business executives responded to the survey.
| 2019 | 2020 | 2021 | 2022 | ||||||
| Expected (percent) |
Actual (percent) |
Expected (percent) |
Actual (percent) |
Expected (percent) |
Expected (percent) |
Actual (percent) |
Expected (percent) |
Expected (percent) |
|
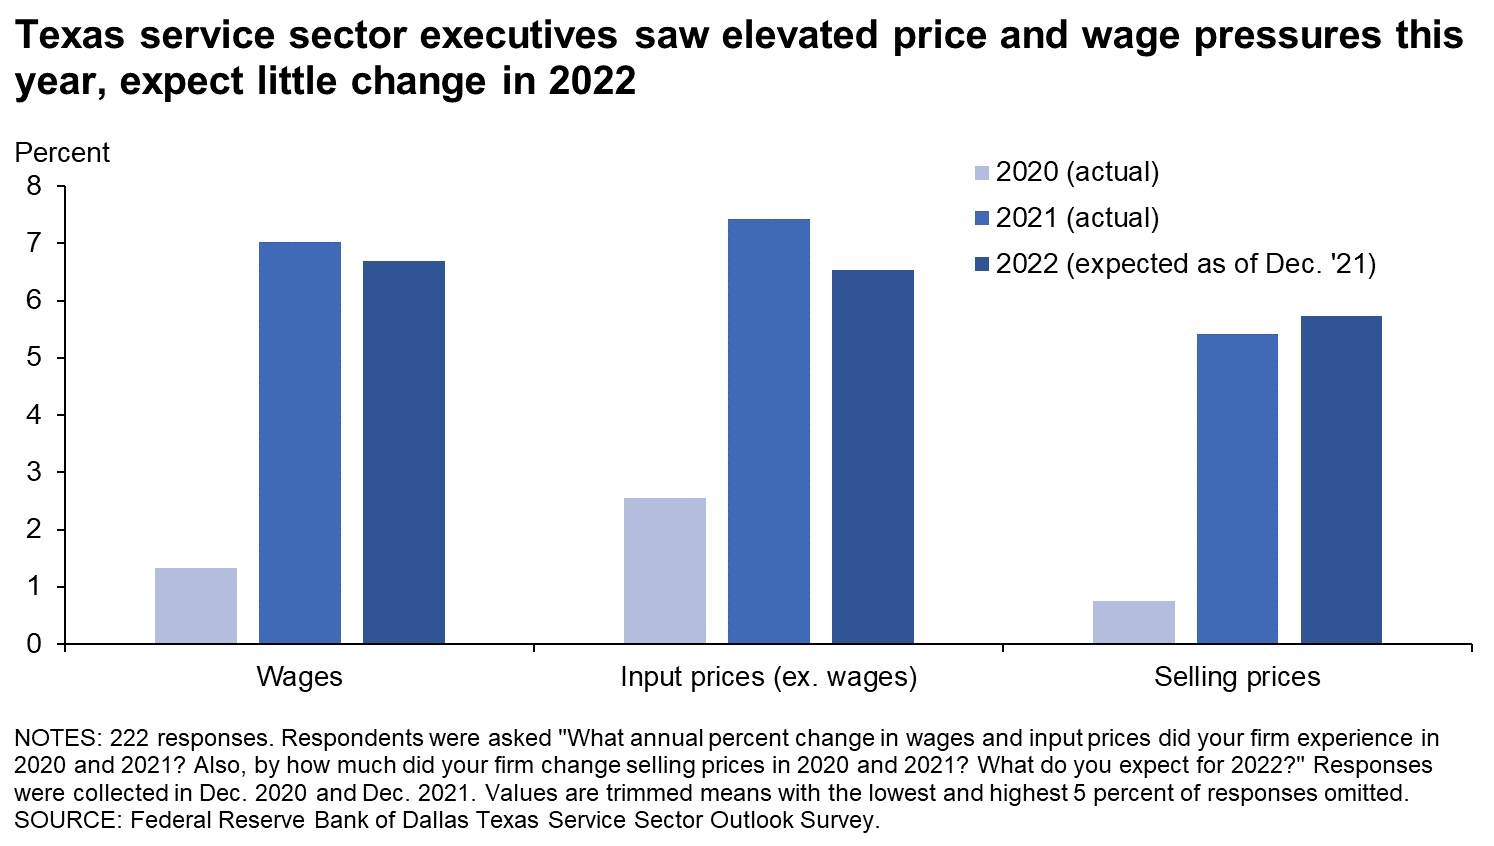
| Wages | 4.0 | 4.1 | 3.9 | 1.3 | 4.4 | 5.0 | 7.0 | 4.8 | 6.7 |
| Input prices | 3.8 | 3.5 | 3.4 | 2.6 | 3.2 | 5.5 | 7.4 | 4.5 | 6.5 |
| Selling prices | 2.7 | 2.5 | 2.7 | 0.8 | 3.2 | 4.3 | 5.4 | 4.3 | 5.7 |
| Data collected | Dec. '18 | Dec. '19 | Dec. '19 | Dec. '20 | Dec. '20 | Jul. '21 | Dec. '21 | Jul. '21 | Dec. '21 |
NOTES: 222 responses. Averages are calculated as trimmed means with the lowest and highest 5 percent of responses omitted.

| Dec. '18 (percent) |
Aug. '19 (percent) |
May '21 (percent) |
Jul. '21 (percent) |
Dec. '21 (percent) |
|
| None | 28.0 | 41.2 | 43.9 | 48.0 | 30.7 |
| Some | 48.5 | 43.3 | 36.1 | 35.8 | 42.5 |
| Most | 15.5 | 10.6 | 11.9 | 10.0 | 19.7 |
| All | 8.0 | 4.9 | 8.2 | 6.1 | 7.0 |
NOTE: 228 responses.
| May '21 (percent) |
Jul. '21 (percent) |
Dec. '21 (percent) |
|
| Raising prices in 2022 | 40.7 | 33.1 | 74.2 |
| Raising prices this year | 74.1 | 80.5 | 61.3 |
| Offering variable pricing or adding contract contingencies to allow for rising input costs | 3.7 | 11.0 | 19.4 |
| Offering reduced product or service for the same price | 10.4 | 7.6 | 11.0 |
| Adding a temporary price surcharge | 3.0 | * | 3.9 |
| Other | 10.4 | 8.5 | 8.4 |
NOTES: 155 responses. This question was posed only to those passing at least some of the higher costs on to customers. *This answer choice was not included in the Jul. ’21 survey.
| Dec. '18 (percent) |
May '19 (percent) |
Dec. '21 (percent) |
|
| Increased substantially | 5.3 | 4.0 | 11.9 |
| Increased slightly | 22.6 | 22.5 | 34.3 |
| Remained the same | 27.9 | 31.7 | 17.8 |
| Decreased slightly | 33.7 | 33.7 | 25.8 |
| Decreased substantially | 10.6 | 8.0 | 10.2 |
NOTE: 236 responses.
| Jul. '20 (percent) |
Aug. '21 (percent) |
Dec. '21 (percent) |
|
| Limited operating capacity due to staffing shortages (difficulty hiring, absenteeism, COVID-19 infections and quarantining, vaccine mandates, etc.) | 17.8 | 27.5 | 42.0 |
| Supply-chain disruptions | 13.8 | 30.2 | 32.8 |
| Weak demand | 54.3 | 24.9 | 19.3 |
| Reduced productivity due to alternative work arrangements | 16.3 | 9.1 | 8.0 |
| Limited operating capacity due to state/local restrictions | 26.8 | 6.4 | 5.0 |
| Other | 18.8 | 14.3 | 14.3 |
| None/not applicable | 13.0 | 25.7 | 20.2 |
NOTE: 238 responses.
Special Questions Comments
These comments have been edited for publication.
- COVID impacted demand for liquid moves; the moves have been coming back (in fits and starts); pricing is coming up off the bottom for these moves.
- Due to the lockdowns in the northeast and West Coast, we're experiencing a parts shortage now because the inventory wasn't built for so many months.
- Ongoing COVID issues around the world continue to keep demand on a slow, rather than rapid, growth trajectory.
- The challenge in a low-interest-rate market is the intense competition for loans. Most banks have excess deposits, and insurance companies are eager to find better returns. Credit unions and the farm credit system are also expanding their coverage. Our best tool in competing with all these entities is relationship and service.
- It is hard to do business when the shop has to be rearranged for the protocol of coronavirus control. It effects efficient operations significantly.
- Elevated severe capacity losses over the past five years that generated underwriting losses is forcing prices up and limiting capacity to underwrite business.
- Economic pressures on insurance brokers are weather, cyberhackers, and COVID, not supply-chain issues.
- Staffing and holiday vacations for suppliers, especially government entities for permitting and approvals, have been a major issue. It would help tremendously if all governmental entities were back at work fully staffed to handle things like building permits and administrative approvals.
- It is like 2022 just disappeared. All of a sudden about three months ago we were ordering product for 2023; who does that?
- Staffing shortages are increasing our costs but not restraining revenues.
- The market for lawyers is very tight right now.
- We have a substantial backlog. We do not have the available labor to meet the demand.
- I can't hire the largest pool of applicants because they are in the 19–21-year-old pool, and I can't insure them.
- In health care, specifically outpatient imaging, reimbursement is constantly declining, deflationary. We have optimized efficiency and are now seeing substantial challenges in recruiting and retaining employees. Despite significant wage increases, we continue to struggle to replace our lost techs and are seeing huge overtime wages, which impacts earnings and EBITDA [earnings before interest, taxes, depreciation and amortization].
- The limited number of qualified applicants is a major issue. I am understaffed and can increase my labor force by an additional 20 percent tomorrow if people were applying. I have now increased wages by offering $20- and $25-an-hour guarantees for 90 days (including tips), offered $1,000 sign-on bonuses, offered exiting employees $1,000 referral bonuses and now am advertising $5,000 to $50,000 offerings to bring over a client base and work for us with $30-an-hour guarantee for 90 days. There are either not enough licensed barbers and cosmetologists in the labor force or not enough people willing to change jobs at this time.
- Even though wages are increasing, the ability to hire qualified people is extremely difficult. We have had four open positions now for three months with no success.
Texas Retail Outlook Survey
Data were collected December 13–21, and 39 Texas retailers responded to the survey.
| 2019 | 2020 | 2021 | 2022 | ||||||
| Expected (percent) |
Actual (percent) |
Expected (percent) |
Actual (percent) |
Expected (percent) |
Expected (percent) |
Actual (percent) |
Expected (percent) |
Expected (percent) |
|
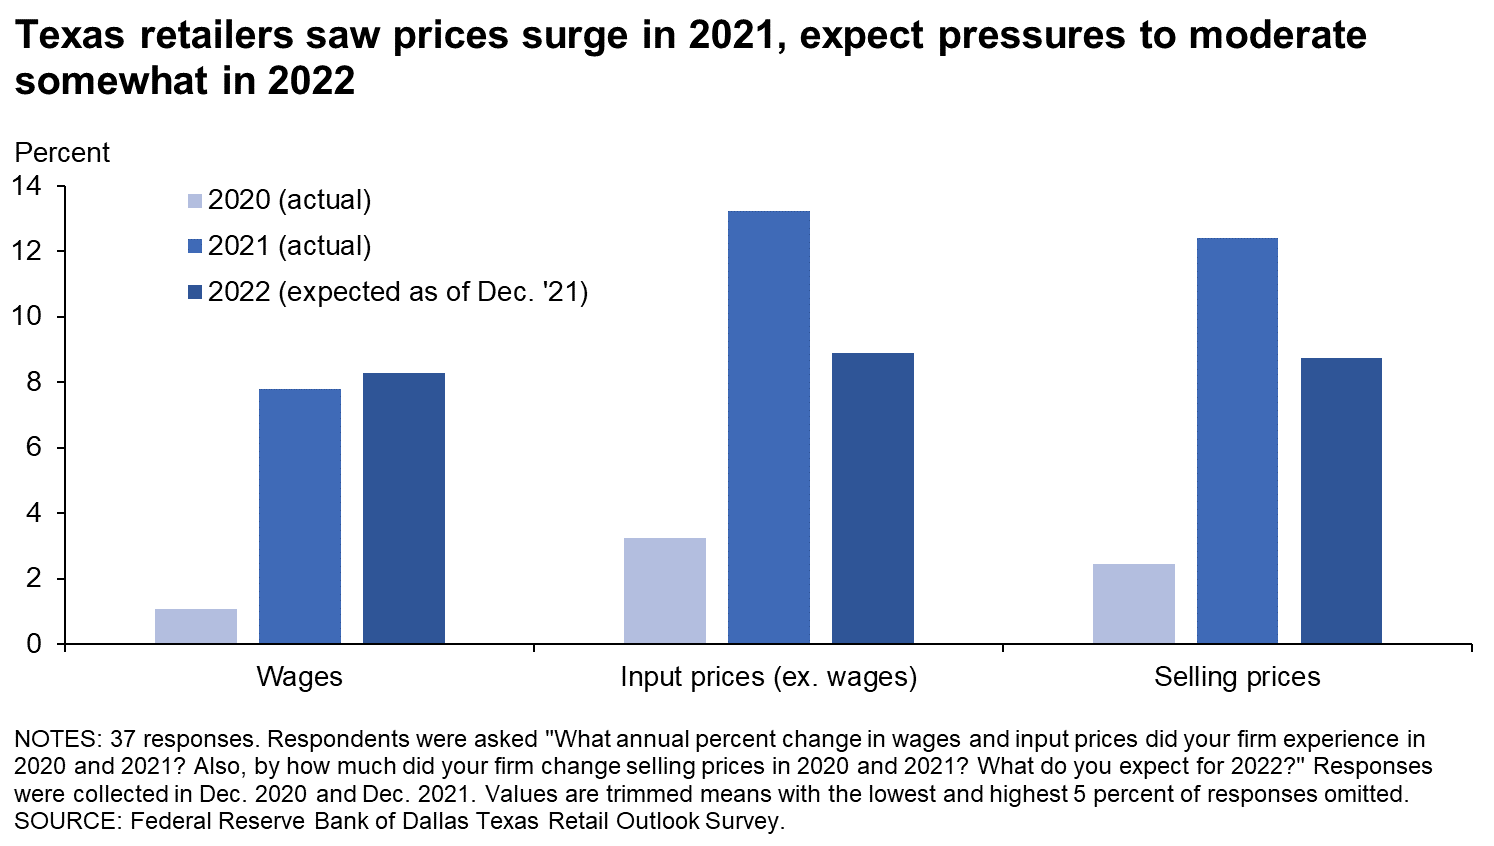
| Wages | 3.1 | 4.1 | 3.4 | 1.1 | 3.0 | 4.8 | 7.8 | 4.3 | 8.3 |
| Input prices | 3.6 | 3.4 | 3.8 | 3.3 | 2.6 | 9.0 | 13.2 | 5.1 | 8.9 |
| Selling prices | 3.2 | 2.9 | 3.8 | 2.4 | 2.9 | 9.0 | 12.4 | 5.4 | 8.7 |
| Data collected | Dec. '18 | Dec. '19 | Dec. '19 | Dec. '20 | Dec. '20 | Jul. '21 | Dec. '21 | Jul. '21 | Dec. '21 |
NOTES: 37 responses. Averages are calculated as trimmed means with the lowest and highest 5 percent of responses omitted.

| Dec. '18 (percent) |
Aug. '19 (percent) |
May '21 (percent) |
Jul. '21 (percent) |
Dec. '21 (percent) |
|
| None | 18.4 | 26.5 | 20.4 | 26.2 | 14.3 |
| Some | 52.6 | 53.1 | 51.0 | 35.7 | 34.3 |
| Most | 15.8 | 10.2 | 18.4 | 26.2 | 40.0 |
| All | 13.2 | 10.2 | 10.2 | 11.9 | 11.4 |
NOTE: 35 responses.
| May '21 (percent) |
Jul. '21 (percent) |
Dec. '21 (percent) |
|
| Raising prices this year | 71.8 | 90.3 | 83.3 |
| Raising prices in 2022 | 43.6 | 35.5 | 76.7 |
| Offering variable pricing or adding contract contingencies to allow for rising input costs | 2.6 | 12.9 | 13.3 |
| Offering reduced product or service for the same price | 10.3 | 3.2 | 3.3 |
| Adding a temporary price surcharge | 2.6 | * | 0.0 |
| Other | 2.6 | 6.5 | 0.0 |
NOTES: 30 responses. This question was posed only to those passing at least some of the higher costs on to customers. *This answer choice was not included in the Jul. ’21 survey.
| Dec. '18 (percent) |
May '19 (percent) |
Dec. '21 (percent) |
|
| Increased substantially | 2.6 | 2.3 | 16.2 |
| Increased slightly | 10.3 | 15.9 | 32.4 |
| Remained the same | 23.1 | 27.3 | 21.6 |
| Decreased slightly | 41.0 | 43.2 | 21.6 |
| Decreased substantially | 23.1 | 11.4 | 8.1 |
NOTE: 37 responses.
| Jul. '20 (percent) |
Aug. '21 (percent) |
Dec. '21 (percent) |
|
| Supply-chain disruptions | 51.0 | 73.8 | 78.4 |
| Limited operating capacity due to staffing shortages (difficulty hiring, absenteeism, COVID-19 infections and quarantining, vaccine mandates, etc.) | 22.4 | 23.8 | 40.5 |
| Weak demand | 49.0 | 26.2 | 18.9 |
| Reduced productivity due to alternative work arrangements | 12.2 | 7.1 | 8.1 |
| Limited operating capacity due to state/local restrictions | 20.4 | 4.8 | 5.4 |
| Other | 20.4 | 7.1 | 2.7 |
| None/not applicable | 6.1 | 9.5 | 5.4 |
NOTE: 37 responses.
Special Questions Comments
These comments have been edited for publication.
- Key suppliers are still routinely shorting orders we place. We are still having difficulty finding available trucks to move freight, and often we are paying a premium to move our goods over the road. We moved our export business from Los Angeles to Houston, so we could move our orders. With the Los Angeles/Long Beach port so congested with imports, we could not get our export orders loaded. We had problems getting containers, and/or chassis, and/or generator sets, and/or drivers, and/or warehouse appointments to get our orders loaded and shipped.
- Input prices have risen so dramatically we are experiencing some demand destruction. We have not raised prices as fast as needed, resulting in lower margins.
- Used-vehicle prices continue to hold at very high levels due to new-vehicle shortages. New-vehicle prices have come down a small amount due to the retail buyer accepting a longer delivery time in exchange for a lower price.
- Selling prices for new and used vehicles will decrease as the supply gradually increases.
- Input prices change so fast we're not pricing product until it is almost complete. In 45 years we have never seen anything like it.
Questions regarding the Texas Business Outlook Surveys can be addressed to Emily Kerr at emily.kerr@dal.frb.org.
Sign up for our email alert to be automatically notified as soon as the latest surveys are released on the web.