Special Questions

Special Questions
Texas Business Outlook Surveys
Data were collected May 17–25, and 354 Texas business executives responded to the surveys.
| Feb. '21 (percent) |
Jun. '21 (percent) |
Sep. '21 (percent) |
Nov. '21 (percent) |
Feb. '22 (percent) |
May '22 (percent) |
|
| Yes | 35.5 | 61.0 | 64.5 | 69.7 | 64.7 | 64.9 |
| No | 64.5 | 39.0 | 35.5 | 30.3 | 35.3 | 35.1 |
NOTE: 350 responses.
| Jun. '21 (percent) |
Sep. '21 (percent) |
Nov. '21 (percent) |
Feb. '22 (percent) |
May '22 (percent) |
|
| Improved significantly | 2.2 | 1.3 | 0.8 | 0.0 | 0.9 |
| Improved slightly | 16.6 | 17.3 | 18.3 | 24.9 | 33.0 |
| No change | 21.4 | 30.5 | 29.3 | 35.6 | 30.0 |
| Worsened slightly | 41.0 | 34.1 | 39.0 | 29.2 | 30.0 |
| Worsened significantly | 18.8 | 16.8 | 12.6 | 10.3 | 6.2 |
NOTES: 227 responses. This question was only posed to those currently experiencing any supply-chain disruptions or delays.
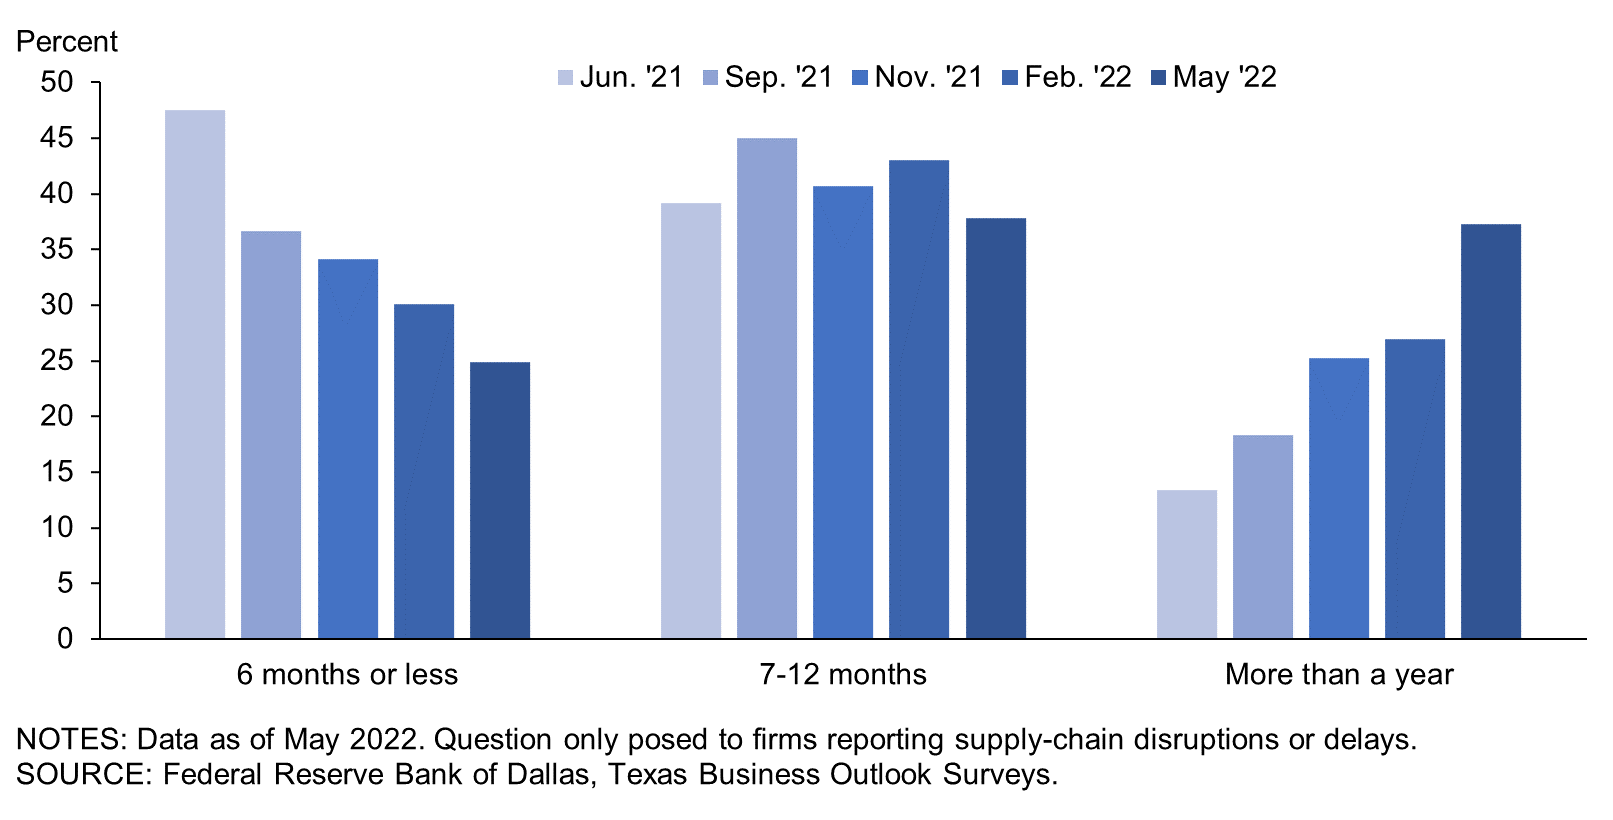
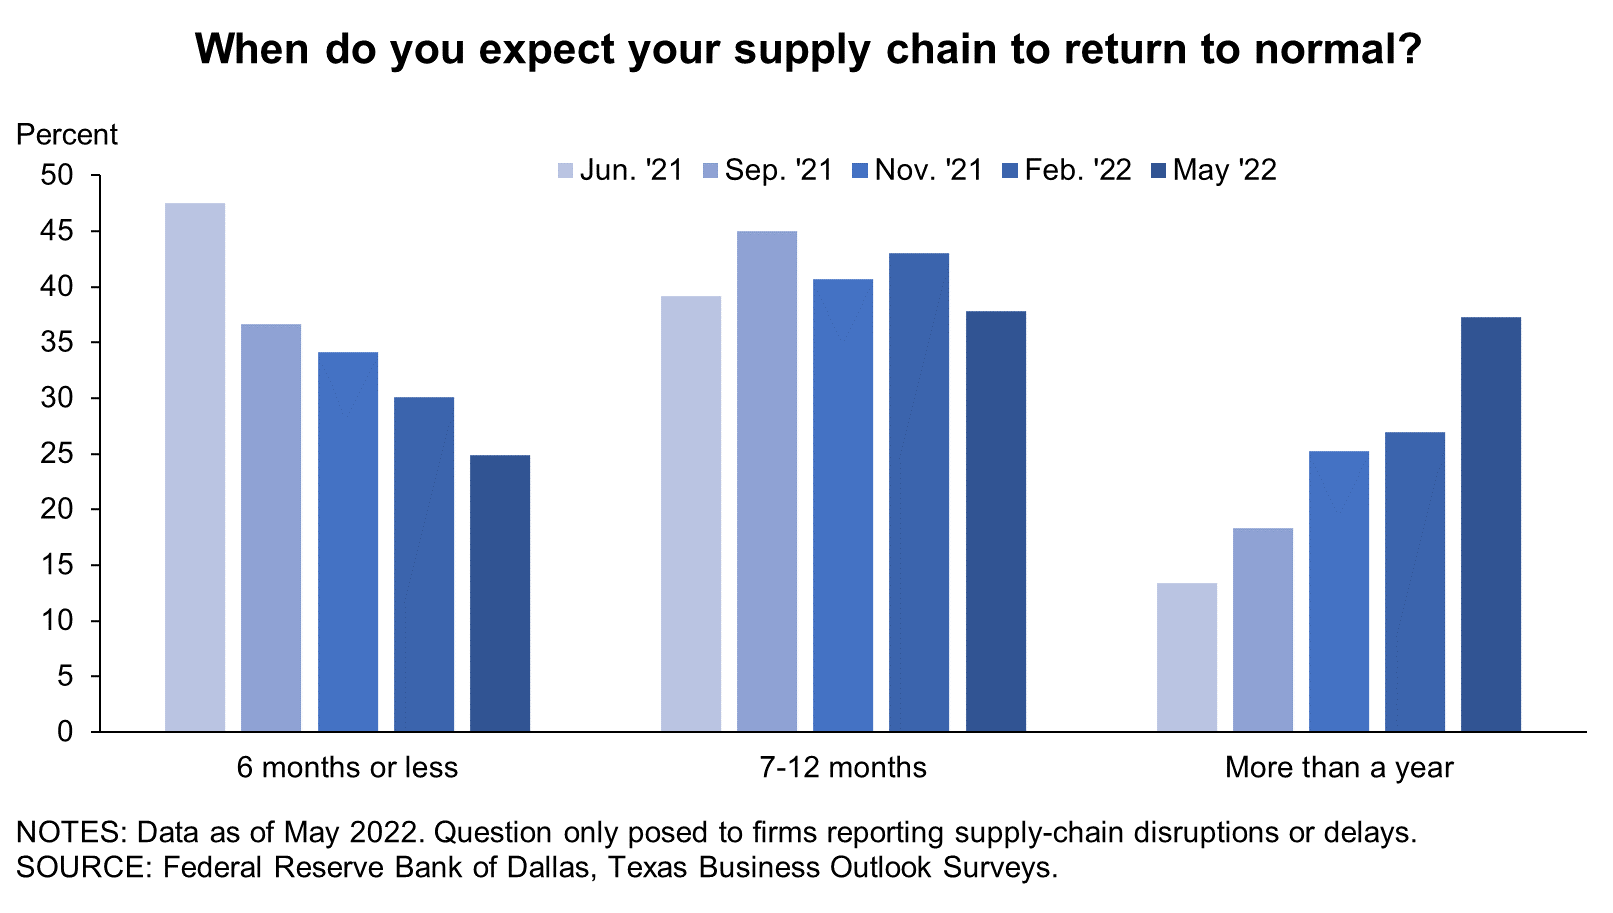
| Jun. '21 (percent) |
Sep. '21 (percent) |
Nov. '21 (percent) |
Feb. '22 (percent) |
May '22 (percent) |
|
| Less than a month | 0.5 | 0.0 | 0.5 | 0.5 | 0.0 |
| 1–3 months | 8.9 | 8.4 | 7.0 | 4.1 | 4.7 |
| 4–6 months | 38.1 | 28.3 | 26.6 | 25.4 | 20.2 |
| 7–9 months | 24.3 | 22.0 | 19.6 | 19.7 | 15.5 |
| 10– 12 months | 14.9 | 23.0 | 21.0 | 23.3 | 22.3 |
| More than a year | 13.4 | 18.3 | 25.2 | 26.9 | 37.3 |
NOTES: 227 responses. This question was only posed to those currently experiencing any supply-chain disruptions or delays. These calculations exclude respondents that answered “Not sure,” which represented 11.8 percent of responses in June ’21, 15.9 percent in Sep. ’21, 13.7 percent in Nov. ’21, 17.9 percent in Feb. ’22 and 15.0 percent in May ’22.
| Dec. '18 (percent) |
Aug. '19 (percent) |
May '21 (percent) |
Jul. '21 (percent) |
Dec. '21 (percent) |
May '22 (percent) |
|
| None | 24.4 | 41.0 | 36.0 | 41.3 | 24.1 | 32.1 |
| Some | 49.2 | 43.9 | 38.4 | 37.5 | 40.6 | 43.4 |
| Most | 18.1 | 10.4 | 16.7 | 14.1 | 24.1 | 16.5 |
| All | 8.4 | 4.6 | 8.9 | 7.2 | 11.1 | 8.1 |
NOTE: 346 responses.
| May '21 (percent) |
Jul. '21 (percent) |
Dec. '21 (percent) |
May '22 (percent) |
|
| Raising prices in 2022 | 34.7 | 33.2 | 75.0 | 84.5 |
| Raising prices in 2023 | * | * | * | 29.2 |
| Offering variable pricing or adding contract contingencies to allow for rising input costs | 9.9 | 13.9 | 21.6 | 19.7 |
| Adding a temporary price surcharge | 1.9 | ** | 9.7 | 12.9 |
| Offering reduced product or service for the same price | 12.7 | 6.4 | 10.2 | 4.7 |
| Other | 9.4 | 6.4 | 5.9 | 5.2 |
NOTES: 233 responses. This question was posed only to those passing at least some of the higher costs on to customers. *This answer choice was introduced in the May ’22 survey. **This answer choice was not included in the Jul. ’21 survey.
Survey respondents were given the opportunity to provide comments. These comments can be found on the individual survey Special Questions results pages, accessible by the tabs above.
Texas Manufacturing Outlook Survey
Data were collected May 17–25, and 85 Texas manufacturers responded to the survey.
| Feb. '21 (percent) |
Jun. '21 (percent) |
Sep. '21 (percent) |
Nov. '21 (percent) |
Feb. '22 (percent) |
May '22 (percent) |
|
| Yes | 61.8 | 86.1 | 92.0 | 92.5 | 92.5 | 83.3 |
| No | 38.2 | 13.9 | 8.0 | 7.5 | 7.5 | 16.7 |
NOTE:84 responses.
| Jun. '21 (percent) |
Sep. '21 (percent) |
Nov. '21 (percent) |
Feb. '22 (percent) |
May '22 (percent) |
|
| Improved significantly | 2.3 | 1.3 | 0.0 | 0.0 | 0.0 |
| Improved slightly | 11.5 | 10.0 | 16.5 | 23.3 | 35.7 |
| No change | 23.0 | 31.3 | 27.1 | 33.7 | 21.4 |
| Worsened slightly | 43.7 | 37.5 | 43.5 | 29.1 | 35.7 |
| Worsened significantly | 19.5 | 20.0 | 12.9 | 14.0 | 7.1 |
NOTES: 70 responses. This question was only posed to those currently experiencing any supply-chain disruptions or delays.
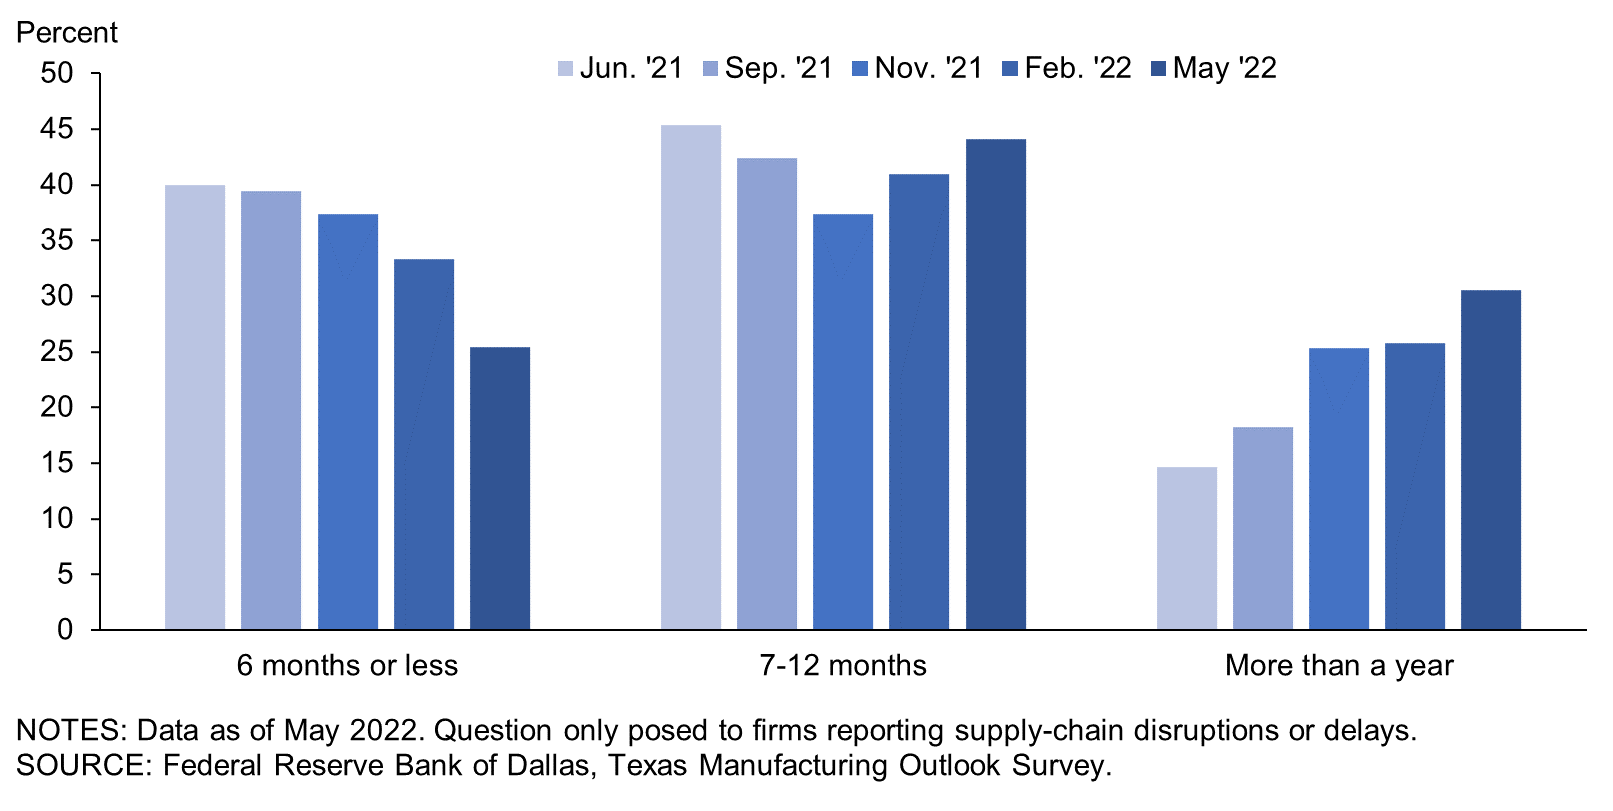
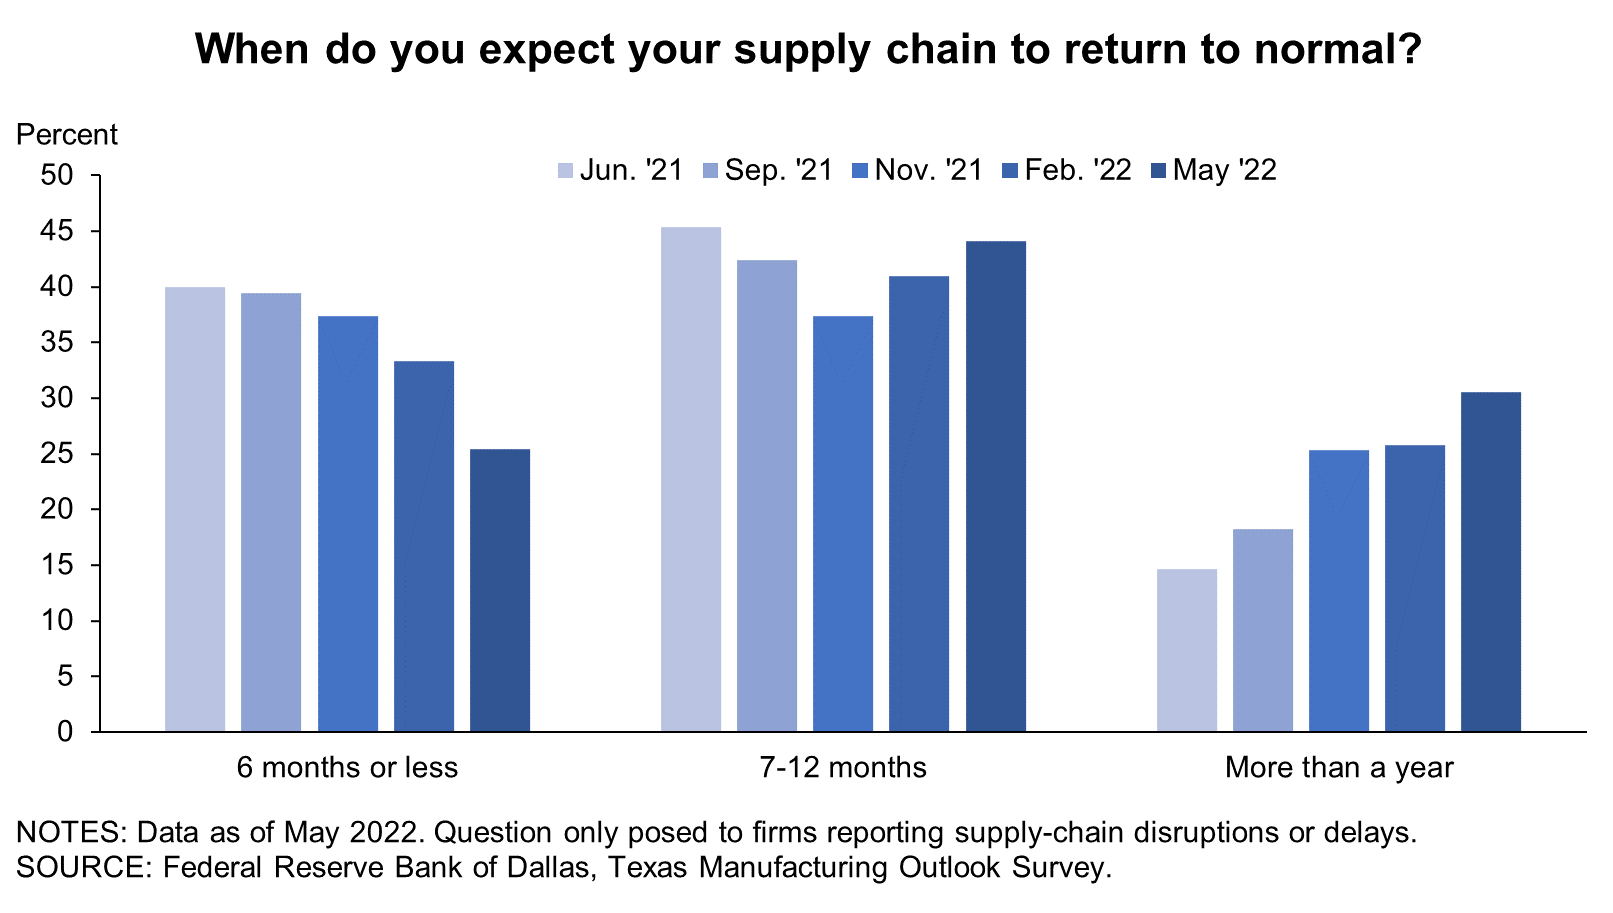
| Jun. '21 (percent) |
Sep. '21 (percent) |
Nov. '21 (percent) |
Feb. '22 (percent) |
May '22 (percent) |
|
| Less than a month | 0.0 | 0.0 | 1.3 | 0.0 | 0.0 |
| 1–3 months | 6.7 | 7.6 | 5.3 | 1.5 | 3.4 |
| 4–6 months | 33.3 | 31.8 | 30.7 | 31.8 | 22.0 |
| 7–9 months | 28.0 | 24.2 | 17.3 | 22.7 | 16.9 |
| 10– 12 months | 17.3 | 18.2 | 20.0 | 18.2 | 27.1 |
| More than a year | 14.7 | 18.2 | 25.3 | 25.8 | 30.5 |
NOTES: 70 responses. This question was only posed to those currently experiencing any supply-chain disruptions or delays. These calculations exclude respondents that answered “Not sure,” which represented 13.8 percent of responses in June ’21, 18.5 percent in Sep. ’21, 12.8 percent in Nov. ’21, 23.3 percent in Feb. ’22 and 15.7 percent in May ’22.
| Dec. '18 (percent) |
Aug. '19 (percent) |
May '21 (percent) |
Jul. '21 (percent) |
Dec. '21 (percent) |
May '22 (percent) |
|
| None | 17.2 | 40.6 | 15.2 | 24.2 | 6.9 | 13.1 |
| Some | 50.5 | 45.5 | 44.6 | 41.8 | 35.6 | 42.9 |
| Most | 23.2 | 9.9 | 29.3 | 24.2 | 35.6 | 29.8 |
| All | 9.1 | 4.0 | 10.9 | 9.9 | 21.8 | 14.3 |
NOTE: 84 responses.
| May '21 (percent) |
Jul. '21 (percent) |
Dec. '21 (percent) |
May '22 (percent) |
|
| Raising prices in 2022 | 24.4 | 33.3 | 76.5 | 87.7 |
| Raising prices in 2023 | * | * | * | 28.8 |
| Adding a temporary price surcharge | 0.0 | ** | 21.0 | 20.5 |
| Offering variable pricing or adding contract contingencies to allow for rising input costs | 20.5 | 18.8 | 25.9 | 17.8 |
| Offering reduced product or service for the same price | 16.7 | 4.3 | 8.6 | 1.4 |
| Other | 7.7 | 2.9 | 1.2 | 2.7 |
NOTES: 73 responses. This question was posed only to those passing at least some of the higher costs on to customers. *This answer choice was introduced in the May ’22 survey. **This answer choice was not included in the Jul. ’21 survey.
Special Questions Comments
These comments have been edited for publication.
- We have learned to deal with the supply-chain delays.
- Material availability is becoming more of an issue. Certain grades and sizes of metal are getting harder to find, which in turn is increasing their cost. Chemicals used in elastomer production are steadily increasing or are getting harder to acquire due to shutdowns in manufacturers overseas. The Ukraine–Russia war is probably not helping matters. This is compounded by the fact that we still struggle to find qualified applicants for open positions. Even with a pay rate increase and additional incentives, it is difficult. When we manage to get a new employee in the door, they last a few weeks. It takes 10 new hires to get one that stays. Positions are remaining unfilled for extended periods of time.
- Cost increases affect all of our industry at around the same time. Therefore, it is relatively easy to raise our selling prices because our competitors are also raising their selling prices. So, all cost increases are passed on to our customers.
- We began raising prices in September of 2021. We have raised them three times since then. Pricing has doubled in eight months. We are at a 100 percent inflation rate; those folks are lying at 8 percent.
- We have passed along all cost increases and will continue to do so. We’ve not encountered any resistance up to this time because we’ve been able to ship products when our customers needed them in a very timely fashion. Our planning for just this situation is paying off since we increased our inventory two years ago and continue to pay close attention to our inventory and order far in advance of any supply problems.
- Supply-chain and logistics issues are improving, but the core problems still exist, and the theme seems to be not enough people wanting to work.
Texas Service Sector Outlook Survey
Data were collected May 17–25, and 269 Texas business executives responded to the survey.
| Feb. '21 (percent) |
Jun. '21 (percent) |
Sep. '21 (percent) |
Nov. '21 (percent) |
Feb. '22 (percent) |
May '22 (percent) |
|
| Yes | 25.5 | 51.8 | 55.3 | 61.6 | 55.2 | 59.0 |
| No | 74.5 | 48.2 | 44.7 | 38.4 | 44.8 | 41.0 |
NOTE: 266 responses.
| Jun. '21 (percent) |
Sep. '21 (percent) |
Nov. '21 (percent) |
Feb. '22 (percent) |
May '22 (percent) |
|
| Improved significantly | 2.1 | 1.4 | 1.2 | 0.0 | 1.3 |
| Improved slightly | 19.7 | 21.2 | 19.3 | 25.9 | 31.8 |
| No change | 20.4 | 30.1 | 30.4 | 36.7 | 33.8 |
| Worsened slightly | 39.4 | 32.2 | 36.6 | 29.3 | 27.4 |
| Worsened significantly | 18.3 | 15.1 | 12.4 | 8.2 | 5.7 |
NOTES: 157 responses. This question was only posed to those currently experiencing any supply-chain disruptions or delays..
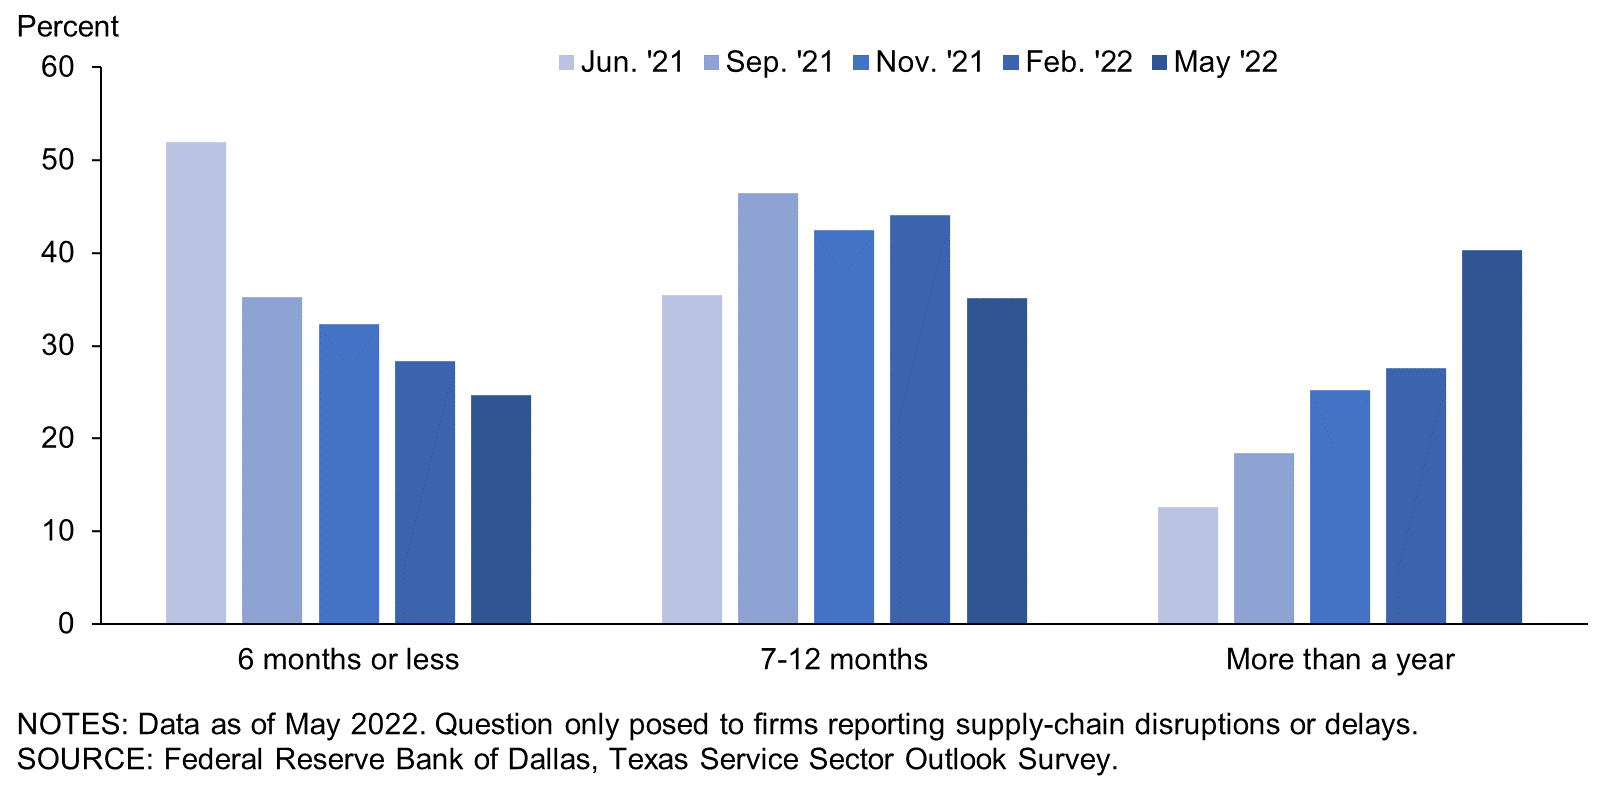
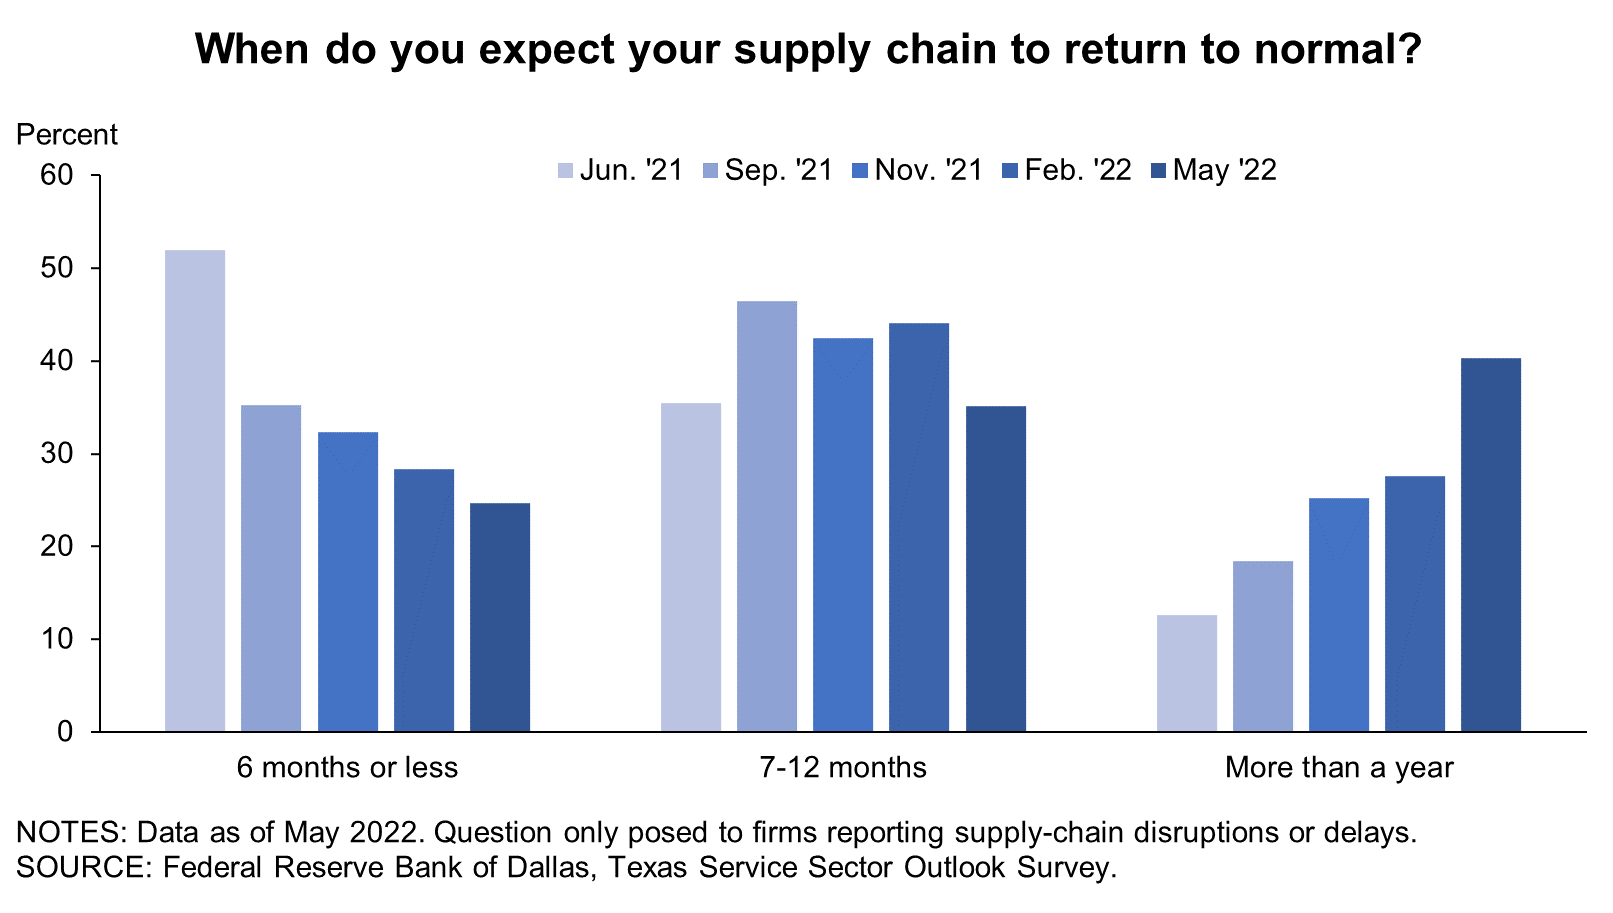
| Jun. '21 (percent) |
Sep. '21 (percent) |
Nov. '21 (percent) |
Feb. '22 (percent) |
May '22 (percent) |
|
| Less than a month | 0.8 | 0.0 | 0.0 | 0.8 | 0.0 |
| 1–3 months | 10.2 | 8.8 | 7.9 | 5.5 | 5.2 |
| 4–6 months | 40.9 | 26.4 | 24.5 | 22.0 | 19.4 |
| 7–9 months | 22.0 | 20.8 | 20.9 | 18.1 | 14.9 |
| 10– 12 months | 13.4 | 25.6 | 21.6 | 26.0 | 20.1 |
| More than a year | 12.6 | 18.4 | 25.2 | 27.6 | 40.3 |
NOTES: 157 responses. This question was only posed to those currently experiencing any supply-chain disruptions or delays. These calculations exclude respondents that answered “Not sure,” which represented 10.6 percent of responses in June ’21, 14.4 percent in Sep. ’21, 14.2 percent in Nov. ’21, 14.8 percent in Feb. ’22 and 14.6 percent in May ’22.
| Dec. '18 (percent) |
Aug. '19 (percent) |
May '21 (percent) |
Jul. '21 (percent) |
Dec. '21 (percent) |
May '22 (percent) |
|
| None | 28.0 | 41.2 | 43.9 | 48.0 | 30.7 | 38.2 |
| Some | 48.5 | 43.3 | 36.1 | 35.8 | 42.5 | 43.5 |
| Most | 15.5 | 10.6 | 11.9 | 10.0 | 19.7 | 12.2 |
| All | 8.0 | 4.9 | 8.2 | 6.1 | 7.0 | 6.1 |
NOTE: 262 responses.
| May '21 (percent) |
Jul. '21 (percent) |
Dec. '21 (percent) |
May '22 (percent) |
|
| Raising prices in 2022 | 40.7 | 33.1 | 74.2 | 83.1 |
| Raising prices in 2023 | * | * | * | 29.4 |
| Offering variable pricing or adding contract contingencies to allow for rising input costs | 3.7 | 11.0 | 19.4 | 20.6 |
| Adding a temporary price surcharge | 3.0 | ** | 3.9 | 9.4 |
| Offering reduced product or service for the same price | 10.4 | 7.6 | 11.0 | 6.3 |
| Other | 10.4 | 8.5 | 8.4 | 6.3 |
NOTES: 160 responses. This question was posed only to those passing at least some of the higher costs on to customers. *This answer choice was introduced in the May ’22 survey. **This answer choice was not included in the Jul. ’21 survey.
Special Questions Comments
These comments have been edited for publication.
- Used commercial trailer prices continue to be extremely elevated, [which is not] allowing me to buy more trailers to lease.
- We are currently not considering rate increases, but we do increase rates annually based on PPI [Producer Price Index], so we took a 2.5 percent rate hike in January and will probably have another significant one for 2022.
- It's more about our customers’ challenges in the supply chain than ours due to our business model, which is software development based with minimal direct hardware effects.
- Property insurance continues to increase due to increasing property values and increased storms (wind and hail) in Texas. Auto is a challenge to some due to increased vehicle repair costs and distracted-driving claims.
- In the apartment business, lease contracts are typically fixed for one year, whereas input prices are not. The lag is squeezing us.
- [There is a] lack of inventory in the housing market.
- In the last couple of months, customers have started to push back significantly at these crazy price increases of 20 to 30 percent on heavy construction machinery. Before, they just paid the price; they had to have it, they couldn't find it anywhere else and they were afraid the price was going up even higher. Now, they are beginning to think they just don't need it and that they'll make do with what they have. So the Fed [Federal Reserve] will intentionally induce a recession, and that will fix the supply chain, and we'll all enjoy a lower standard of living trying to pay high interest and inflation costs in large part caused by all the free money the Fed gave away for two years.
- The shortage of qualified workers is hampering growth and causing business instability. We are not seeing improvement in the near future. It takes a long time to train qualified workers, especially in professional services. Retirement is removing much-needed experience from the workforce and marketplace. Rapid wage inflation is causing a great deal of pressure and stress for small businesses. We're under water when it comes to having a qualified workforce that's willing to work. We need immigration reform to expand the pool of qualified workers.
- My consulting business is based on the type of work being done and the clients being served. I am not really dependent on supply-chain issues as my products are opinions and recommendations based on existing data and observations.
- The government cannot spend us out of this mess. They need to stop; they are making this all worse. Our current elected officials show zero understanding of what causes inflation.
- We are beginning to look at increasing our hourly consulting fee to offset the costs of travel, office supplies and general expenses. We haven't up to this point but are thinking we will need to by fall 2022.
- We currently have an order backlog due to supply-chain problems of $15.8 million, which is up from $13.2 million at the end of last month. In a more normal year, our backlog runs between $2 million and $4 million. These are firm orders we have received from our customers that we can't fulfill because the product is on backorder.
- We implemented a price increase at the beginning of 2022.
- We do everything we can to maintain our targets. It is extremely difficult and challenging.
- As a state-controlled institution, we are unable to change prices without significant lead time (several years).
- All costs are rising. And we hire the best trainers/instructors so we will continue to pay them more. But our health care for those employees is also rising. Our clients have to fund it.
- Because most of our health care services are provided through insurance carriers, there is no ability for us to raise our prices outside of contract renegotiations.
- We anticipated inflation would start spiking in 2022, so Jan. 1 we "priced ahead of inflation" by 10 percent using the 80/20 rule—priced only those items representing 80 percent of revenue. We used this approach back in early '80s to maintain profitability during high inflation.
- [There is] absolutely no chance to pass through the rise in costs. Insurance contracts are fixed, and year over year, federal programs cut their reimbursement.
- Radiology is experiencing a critical shortage of IV [intravenous] contrast used in CT [computerized tomography] exams, angiograms and other interventional procedures. This is related to the shutdown of production facilities in China related to COVID lockdowns on the crazy zero-COVID policy. It makes no sense except that China is pursuing a financial/de-dollarization war by shutting down production and supply lines. We have no control over our fee schedule; margins are slowly but surely eroding, but we are still profitable at this time.
- I have raised prices twice this year for a total of 8 percent across the board. We are seeing some pushback, and I worry there is little wiggle in increasing prices in 2023; however, if I must, I must.
- In February, we underwent an 18.4 percent increase in all services. This offset our increased costs of doing business, including products and labor pay increases. But with the added employee benefits of health insurance and company-matching retirement plan offered to attract and retain employees, we are still at a net deficit even with the price increase. I do not anticipate another price increase this year, and I would hate to have to increase prices next year. I feel we are at the price ceiling of our target market.
- We are a trade association, so it’s not applicable to us, but our manufacturing member companies are experiencing significant supply-chain disruptions and delays, and many have now started passing the costs along to their customers (more so than in the past six months).
Texas Retail Outlook Survey
Data were collected May 17–25, and 43 Texas retailers responded to the survey.
| Feb. '21 (percent) |
Jun. '21 (percent) |
Sep. '21 (percent) |
Nov. '21 (percent) |
Feb. '22 (percent) |
May '22 (percent) |
|
| Yes | 64.4 | 87.2 | 80.9 | 93.0 | 84.4 | 83.7 |
| No | 35.6 | 12.8 | 19.1 | 7.0 | 15.6 | 16.3 |
NOTE: 43 responses.
| Jun. '21 (percent) |
Sep. '21 (percent) |
Nov. '21 (percent) |
Feb. '22 (percent) |
May '22 (percent) |
|
| Improved significantly | 0.0 | 0.0 | 0.0 | 0.0 | 2.8 |
| Improved slightly | 22.0 | 23.7 | 25.0 | 21.1 | 36.1 |
| No change | 17.1 | 28.9 | 30.0 | 34.2 | 36.1 |
| Worsened slightly | 34.1 | 15.8 | 32.5 | 31.6 | 19.4 |
| Worsened significantly | 26.8 | 31.6 | 12.5 | 13.2 | 5.6 |
NOTES: 36 responses. This question was only posed to those currently experiencing any supply-chain disruptions or delays.
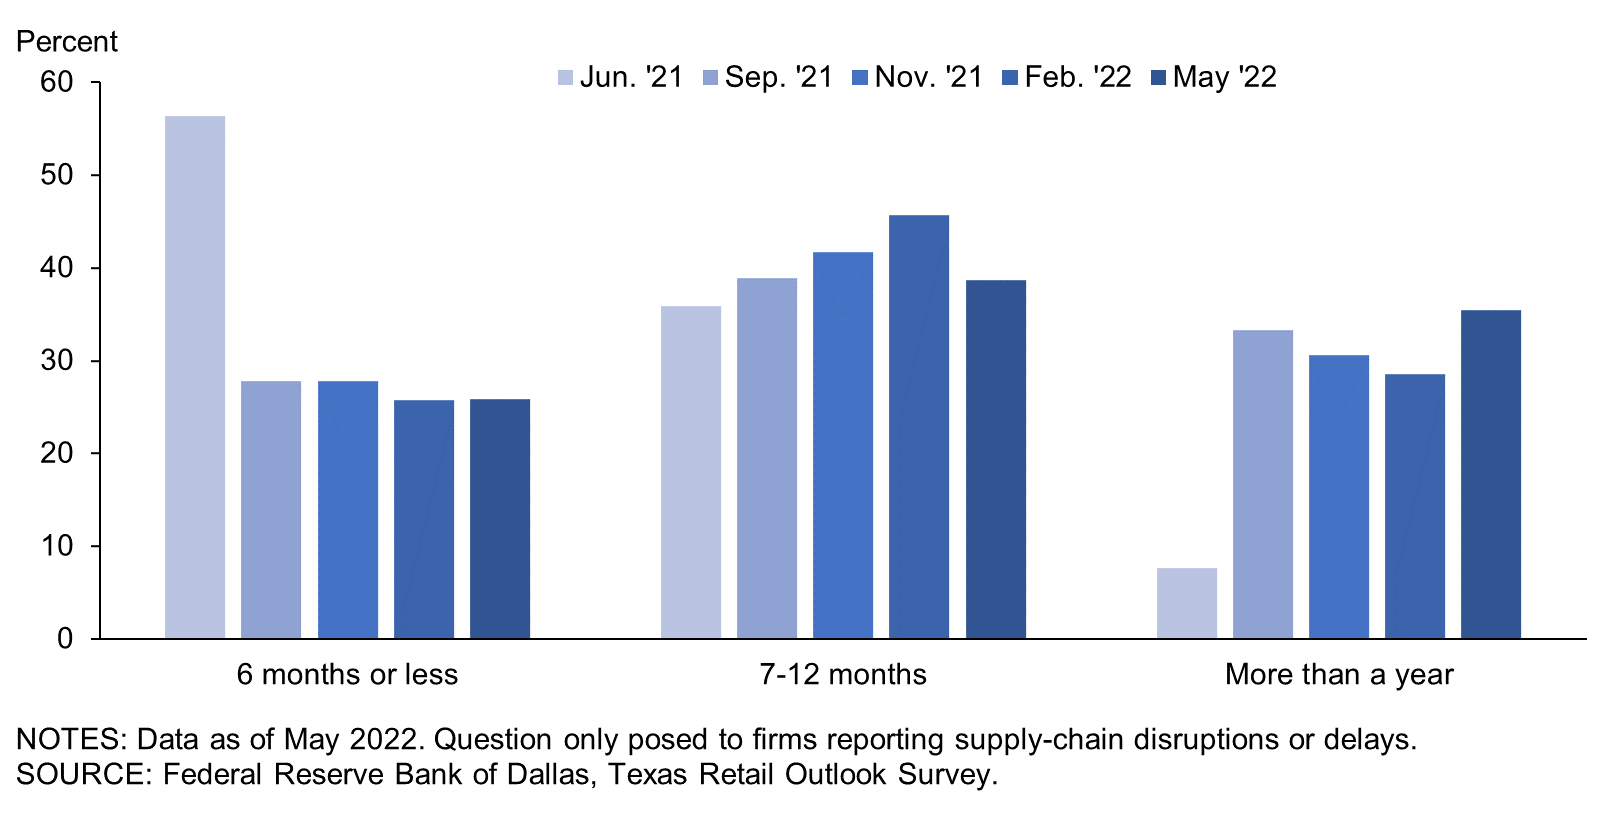
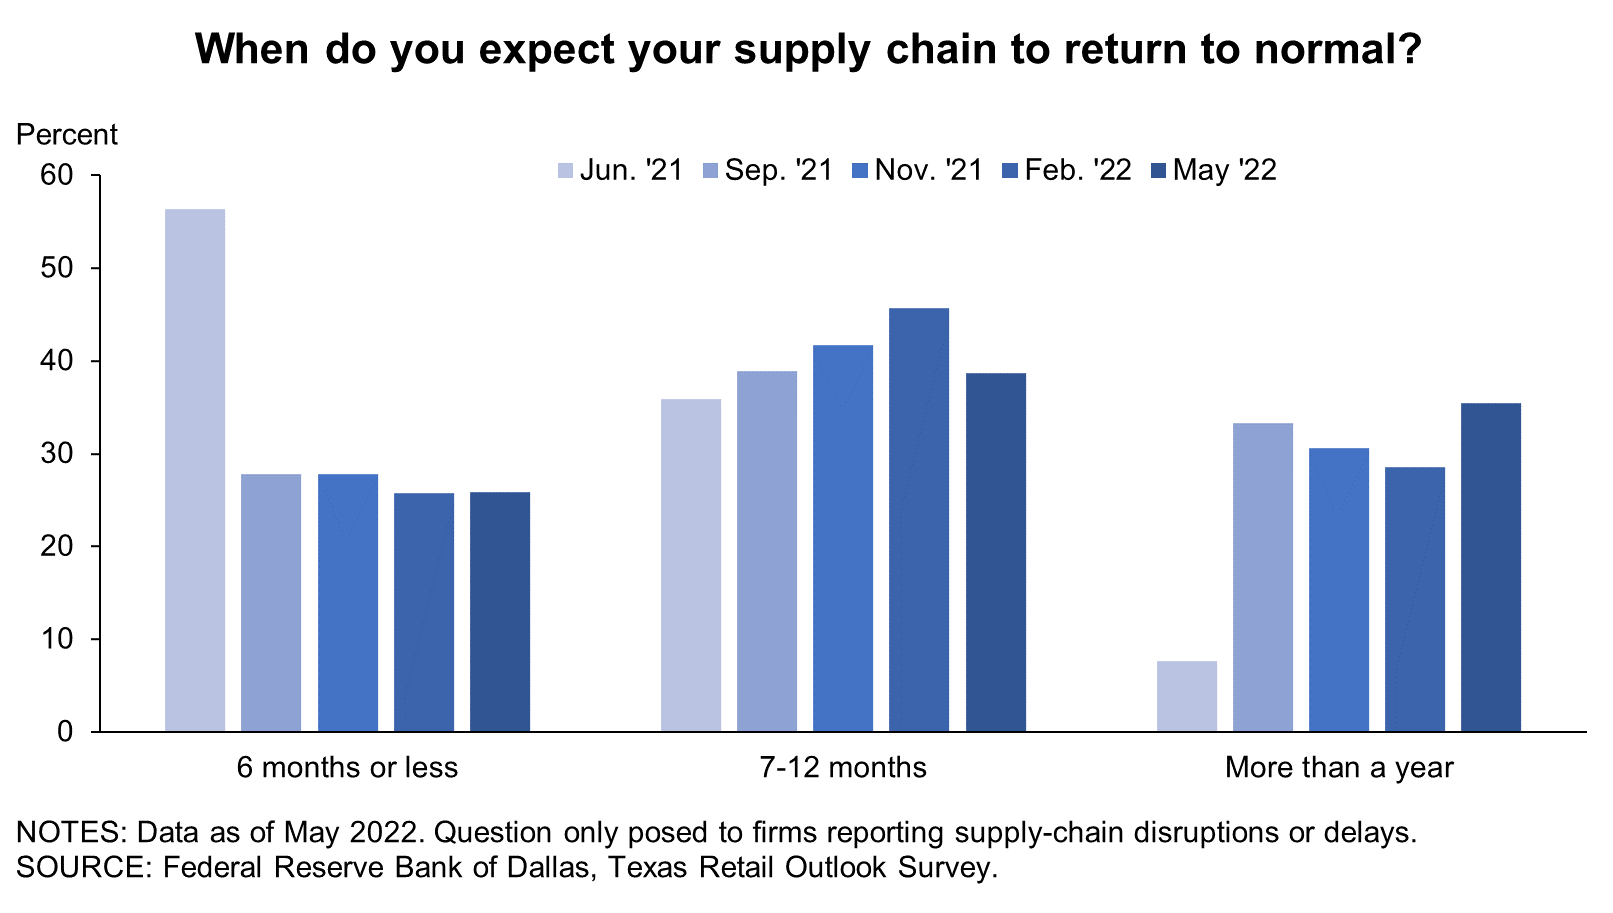
| Jun. '21 (percent) |
Sep. '21 (percent) |
Nov. '21 (percent) |
Feb. '22 (percent) |
May '22 (percent) |
|
| Less than a month | 0.0 | 0.0 | 0.0 | 0.0 | 0.0 |
| 1–3 months | 15.4 | 11.1 | 2.8 | 0.0 | 3.2 |
| 4–6 months | 41.0 | 16.7 | 25.0 | 25.7 | 22.6 |
| 7–9 months | 12.8 | 16.7 | 25.0 | 25.7 | 16.1 |
| 10– 12 months | 23.1 | 22.2 | 16.7 | 20.0 | 22.6 |
| More than a year | 7.7 | 33.3 | 30.6 | 28.6 | 35.5 |
NOTES: 36 responses. This question was only posed to those currently experiencing any supply-chain disruptions or delays. These calculations exclude respondents that answered “Not sure,” which represented 4.9 percent of responses in June ’21, 5.3 percent in Sep. ’21, 10.0 percent in Nov. ’21, 7.9 percent in Feb ’22 and 13.9 percent in May ’22.
| Dec. '18 (percent) |
Aug. '19 (percent) |
May '21 (percent) |
Jul. '21 (percent) |
Dec. '21 (percent) |
May '22 (percent) |
|
| None | 18.4 | 26.5 | 20.4 | 26.2 | 14.3 | 14.0 |
| Some | 52.6 | 53.1 | 51.0 | 35.7 | 34.3 | 44.2 |
| Most | 15.8 | 10.2 | 18.4 | 26.2 | 40.0 | 27.9 |
| All | 13.2 | 10.2 | 10.2 | 11.9 | 11.4 | 14.0 |
NOTE: 43 responses.
| May '21 (percent) |
Jul. '21 (percent) |
Dec. '21 (percent) |
May '22 (percent) |
|
| Raising prices in 2022 | 43.6 | 35.5 | 76.7 | 91.7 |
| Raising prices in 2023 | * | * | * | 11.1 |
| Offering variable pricing or adding contract contingencies to allow for rising input costs | 2.6 | 12.9 | 13.3 | 11.1 |
| Adding a temporary price surcharge | 2.6 | ** | 0.0 | 5.6 |
| Offering reduced product or service for the same price | 10.3 | 3.2 | 3.3 | 2.8 |
| Other | 2.6 | 6.5 | 0.0 | 0.0 |
NOTES: 36 responses. This question was posed only to those passing at least some of the higher costs on to customers. *This answer choice was introduced in the May ’22 survey. **This answer choice was not included in the Jul. ’21 survey.
Special Questions Comments
- The questions about six months from now are hard to answer as everything changes so fast. It is hard to tell what it will be like in two months.
- The manufacturer has increased prices and we pass that along to the customers.
- The chip shortage is still our problem with the supply chain.
- Supplies were very tight last year. This year is getting better.
Questions regarding the Texas Business Outlook Surveys can be addressed to Emily Kerr at emily.kerr@dal.frb.org.
Sign up for our email alert to be automatically notified as soon as the latest surveys are released on the web.