Special Questions

Special Questions
Texas Business Outlook Surveys
Data were collected August 16–24, and 365 Texas business executives responded to the surveys.
| Feb. '21 (percent) |
Jun. '21 (percent) |
Sep. '21 (percent) |
Nov. '21 (percent) |
Feb. '22 (percent) |
May '22 (percent) |
Aug. '22 (percent) |
|
| Yes | 35.5 | 61.0 | 64.5 | 69.7 | 64.7 | 64.9 | 58.5 |
| No | 64.5 | 39.0 | 35.5 | 30.3 | 35.3 | 35.1 | 41.5 |
NOTE: 364 responses.
| Jun. '21 (percent) |
Sep. '21 (percent) |
Nov. '21 (percent) |
Feb. '22 (percent) |
May '22 (percent) |
Aug. '22 (percent) |
|
| Improved significantly | 2.2 | 1.3 | 0.8 | 0.0 | 0.9 | 0.5 |
| Improved slightly | 16.6 | 17.3 | 18.3 | 24.9 | 33.0 | 42.9 |
| No change | 21.4 | 30.5 | 29.3 | 35.6 | 30.0 | 33.0 |
| Worsened slightly | 41.0 | 34.1 | 39.0 | 29.2 | 30.0 | 19.8 |
| Worsened significantly | 18.8 | 16.8 | 12.6 | 10.3 | 6.2 | 3.8 |
NOTES: 212 responses. This question was only posed to those currently experiencing any supply-chain disruptions or delays.
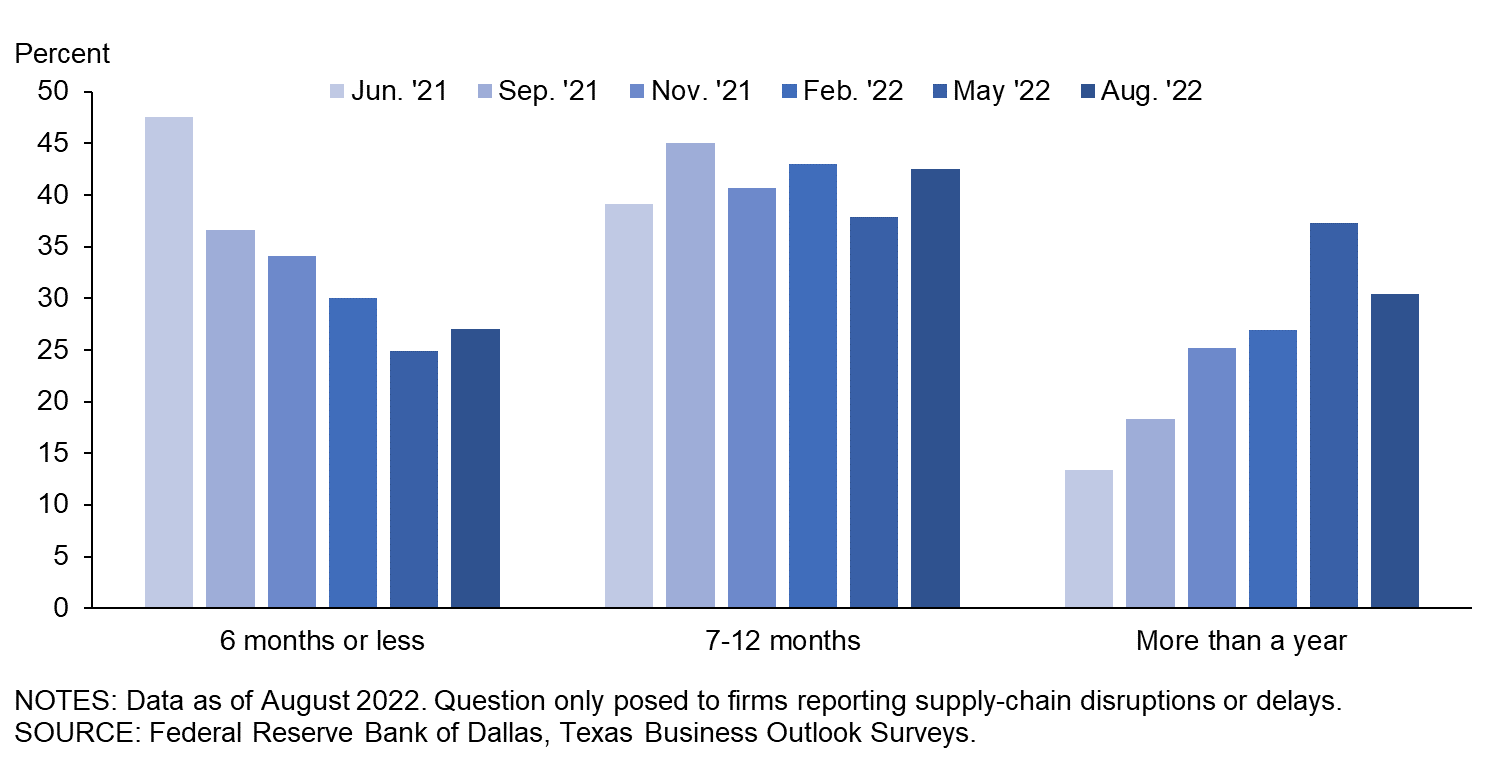
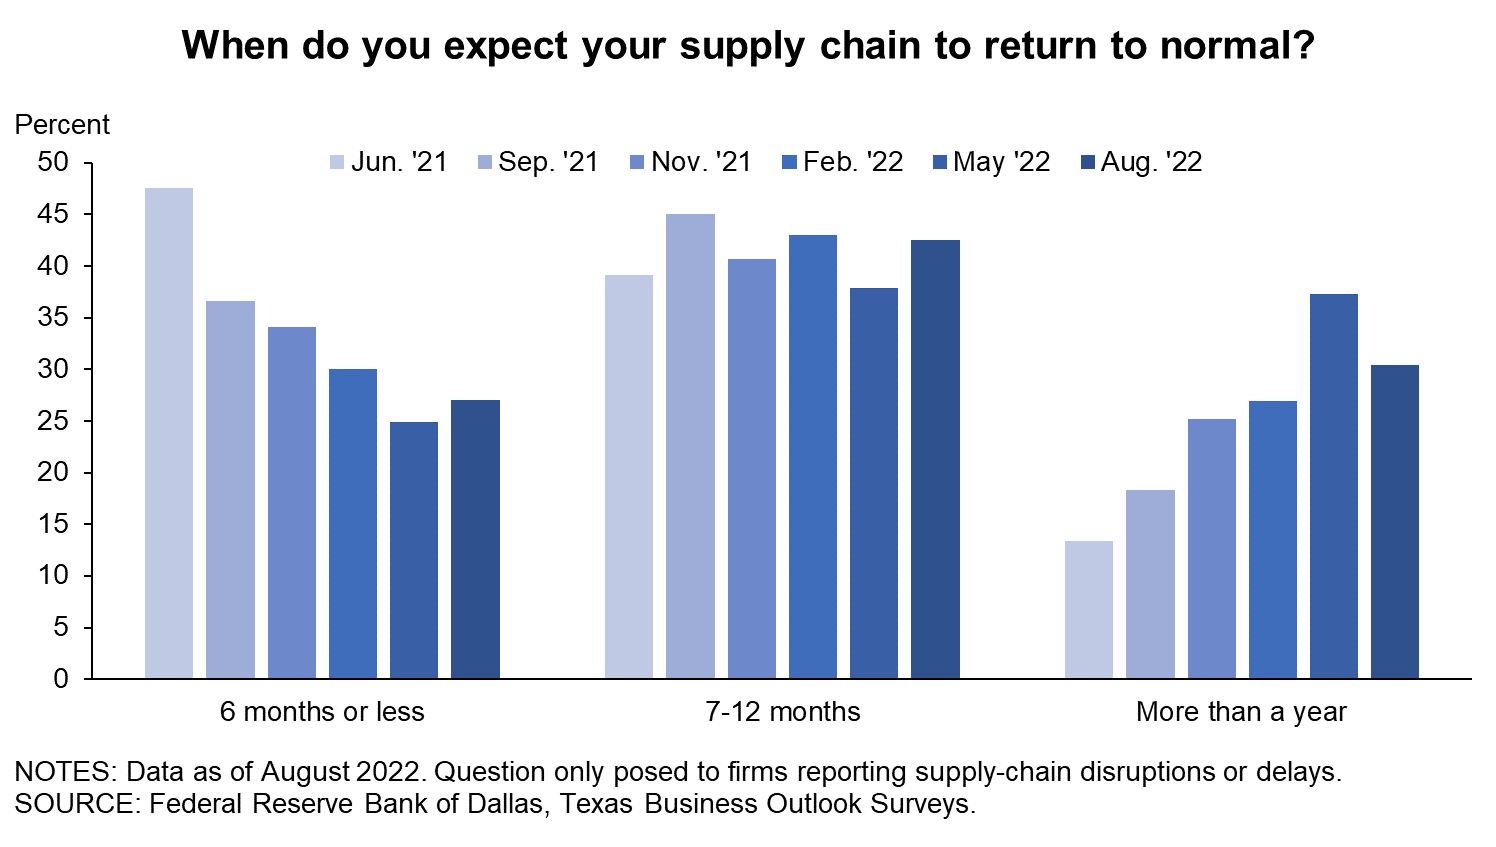
| Jun. '21 (percent) |
Sep. '21 (percent) |
Nov. '21 (percent) |
Feb. '22 (percent) |
May '22 (percent) |
Aug. '22 (percent) |
|
| Less than a month | 0.5 | 0.0 | 0.5 | 0.5 | 0.0 | 0.6 |
| 1–3 months | 8.9 | 8.4 | 7.0 | 4.1 | 4.7 | 6.6 |
| 4–6 months | 38.1 | 28.3 | 26.6 | 25.4 | 20.2 | 19.9 |
| 7–9 months | 24.3 | 22.0 | 19.6 | 19.7 | 15.5 | 22.1 |
| 10– 12 months | 14.9 | 23.0 | 21.0 | 23.3 | 22.3 | 20.4 |
| More than a year | 13.4 | 18.3 | 25.2 | 26.9 | 37.3 | 30.4 |
NOTES: 181 responses. This question was only posed to those currently experiencing any supply-chain disruptions or delays. These calculations exclude respondents that answered “Not sure,” which represented 11.8 percent of responses in June ’21, 15.9 percent in Sep. ’21, 13.7 percent in Nov. ’21, 17.9 percent in Feb. ’22, 15.0 percent in May ’22 and 14.6 percent in Aug. ’22.
| Dec. '18 (percent) |
Aug. '19 (percent) |
May '21 (percent) |
Jul. '21 (percent) |
Dec. '21 (percent) |
May '22 (percent) |
Aug. '22 (percent) |
|
| None | 24.4 | 41.0 | 36.0 | 41.3 | 24.1 | 32.1 | 25.7 |
| Some | 49.2 | 43.9 | 38.4 | 37.5 | 40.6 | 43.4 | 48.5 |
| Most | 18.1 | 10.4 | 16.7 | 14.1 | 24.1 | 16.5 | 15.2 |
| All | 8.4 | 4.6 | 8.9 | 7.2 | 11.1 | 8.1 | 10.5 |
NOTE: 342 responses.
Survey respondents were given the opportunity to provide comments. These comments can be found on the individual survey Special Questions results pages, accessible by the tabs above.
Texas Manufacturing Outlook Survey
Data were collected August 16–24, and 86 Texas manufacturers responded to the survey.
| Feb. '21 (percent) |
Jun. '21 (percent) |
Sep. '21 (percent) |
Nov. '21 (percent) |
Feb. '22 (percent) |
May '22 (percent) |
Aug. '22 (percent) |
|
| Yes | 61.8 | 86.1 | 92.0 | 92.5 | 92.5 | 83.3 | 70.9 |
| No | 38.2 | 13.9 | 8.0 | 7.5 | 7.5 | 16.7 | 29.1 |
NOTE: 86 responses.
| Jun. '21 (percent) |
Sep. '21 (percent) |
Nov. '21 (percent) |
Feb. '22 (percent) |
May '22 (percent) |
Aug. '22 (percent) |
|
| Improved significantly | 2.3 | 1.3 | 0.0 | 0.0 | 0.0 | 0.0 |
| Improved slightly | 11.5 | 10.0 | 16.5 | 23.3 | 35.7 | 34.4 |
| No change | 23.0 | 31.3 | 27.1 | 33.7 | 21.4 | 39.3 |
| Worsened slightly | 43.7 | 37.5 | 43.5 | 29.1 | 35.7 | 23.0 |
| Worsened significantly | 19.5 | 20.0 | 12.9 | 14.0 | 7.1 | 3.3 |
NOTES: 61 responses. This question was only posed to those currently experiencing any supply-chain disruptions or delays.
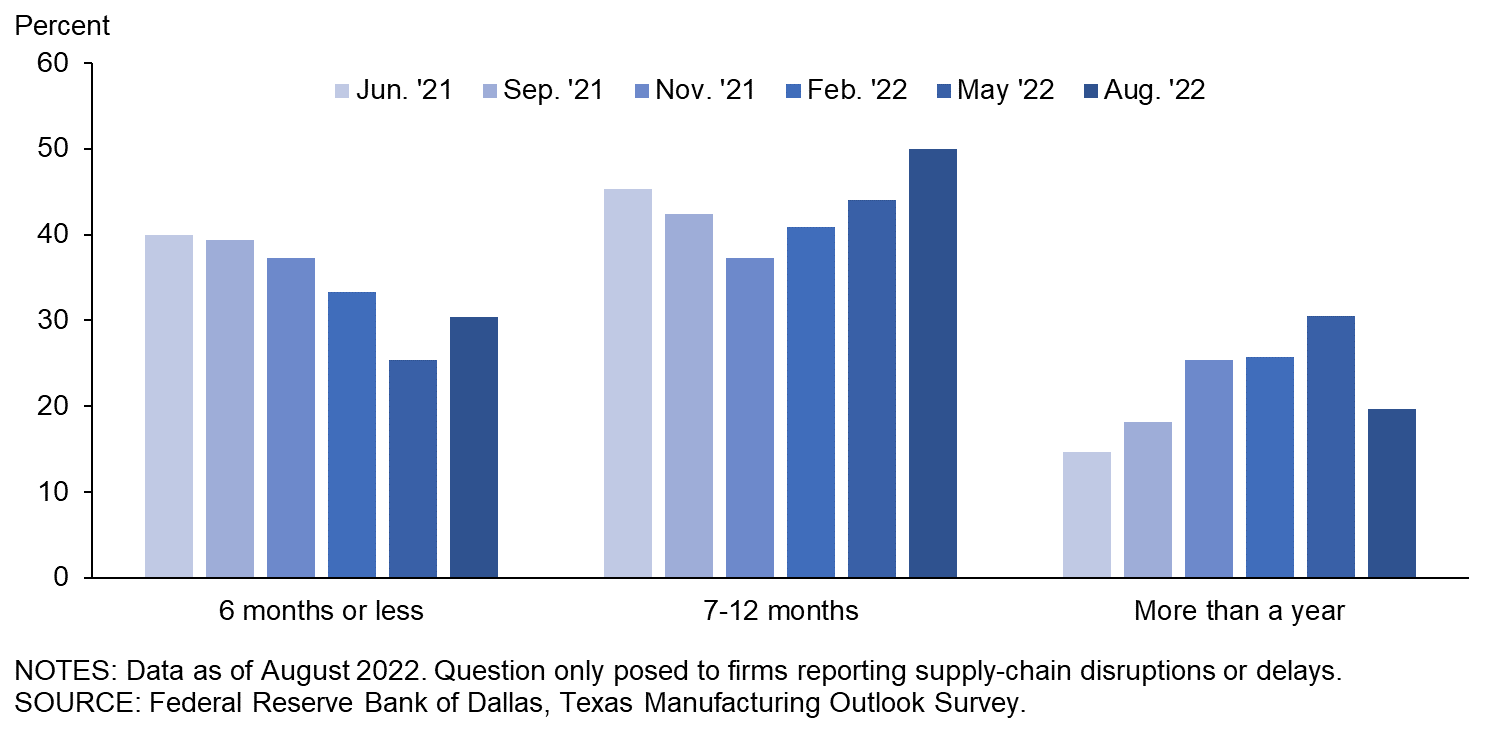
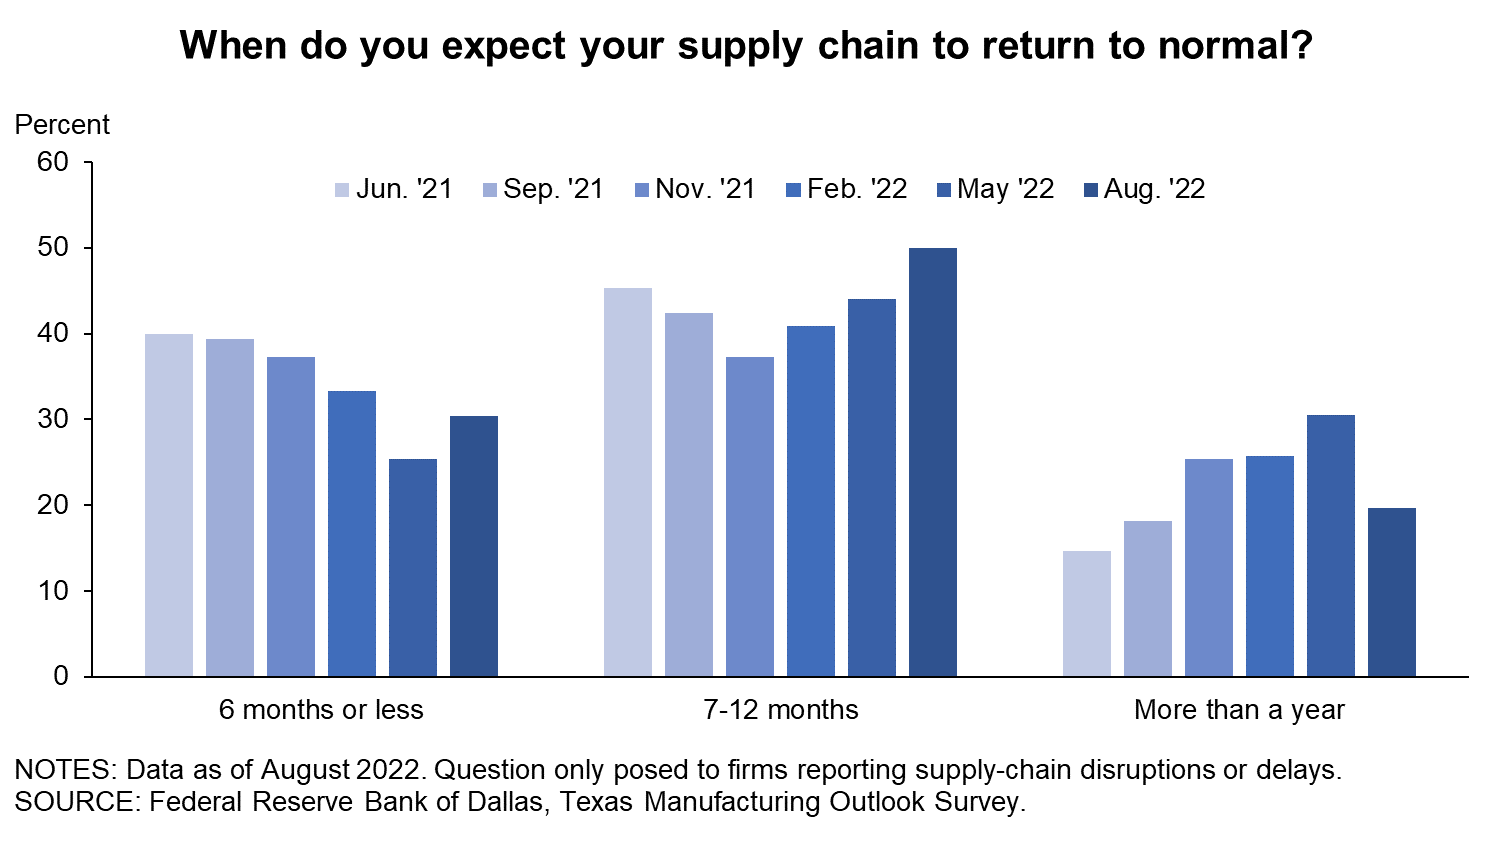
| Jun. '21 (percent) |
Sep. '21 (percent) |
Nov. '21 (percent) |
Feb. '22 (percent) |
May '22 (percent) |
Aug. '22 (percent) |
|
| Less than a month | 0.0 | 0.0 | 1.3 | 0.0 | 0.0 | 0.0 |
| 1–3 months | 6.7 | 7.6 | 5.3 | 1.5 | 3.4 | 3.6 |
| 4–6 months | 33.3 | 31.8 | 30.7 | 31.8 | 22.0 | 26.8 |
| 7–9 months | 28.0 | 24.2 | 17.3 | 22.7 | 16.9 | 23.2 |
| 10– 12 months | 17.3 | 18.2 | 20.0 | 18.2 | 27.1 | 26.8 |
| More than a year | 14.7 | 18.2 | 25.3 | 25.8 | 30.5 | 19.6 |
NOTES: 56 responses. This question was only posed to those currently experiencing any supply-chain disruptions or delays. These calculations exclude respondents that answered “Not sure,” which represented 13.8 percent of responses in June ’21, 18.5 percent in Sep. ’21, 12.8 percent in Nov. ’21, 23.3 percent in Feb. ’22, 15.7 percent in May ’22 and 8.2 percent in Aug. ’22.
| Dec. '18 (percent) |
Aug. '19 (percent) |
May '21 (percent) |
Jul. '21 (percent) |
Dec. '21 (percent) |
May '22 (percent) |
Aug. '22 (percent) |
|
| None | 17.2 | 40.6 | 15.2 | 24.2 | 6.9 | 13.1 | 12.8 |
| Some | 50.5 | 45.5 | 44.6 | 41.8 | 35.6 | 42.9 | 52.3 |
| Most | 23.2 | 9.9 | 29.3 | 24.2 | 35.6 | 29.8 | 19.8 |
| All | 9.1 | 4.0 | 10.9 | 9.9 | 21.8 | 14.3 | 15.1 |
NOTE: 86 responses.
Special Questions Comments
These comments have been edited for publication.
- We’re still seeing difficulty acquiring certain sizes and types of raw metals. Fortunately, we’ve been able to substitute with other materials after recommendations from our customers. Certain chemicals for elastomer manufacturing are becoming a problem. Some of our suppliers are saying they can’t accept any new orders for the year and that they won’t be able to supply anything until first quarter 2023.
- All cost increases have been passed on. Price decreases are coming. We are holding on to current prices, but lead times are coming down now, so price declines are on the way.
- Inflation is increasing our costs, and we are not able to pass all the cost increases to our customers.
- We are experiencing long delays from domestic foundries. There appears to be a shortage of domestic foundries, and the requirement to use only iron poured in domestic foundries per the American Iron and Steel requirement exacerbates the situation.
- We implemented an out-of-cycle wage increase of 3 percent for hourly personnel to combat inflation and stay competitive with other employers.
- We have built our inventory over time to meet the demand that we are currently expecting. We are not perfect and are seeing some delays, but they are not as bad as our competitors who have little money and inventory.
- We have absorbed wage increases and not passed them along to customers. Raw material price increases are passed to customers as each new job is quoted.
- Recession may improve supply-chain deliveries, but that has its own problems.
- Food inflation has taken a toll on sales. When certain items pass a perceived price threshold, buyers switch to different, less-expensive items.
Texas Service Sector Outlook Survey
Data were collected August 16–24, and 279 Texas business executives responded to the survey.
| Feb. '21 (percent) |
Jun. '21 (percent) |
Sep. '21 (percent) |
Nov. '21 (percent) |
Feb. '22 (percent) |
May '22 (percent) |
Aug. '22 (percent) |
|
| Yes | 25.5 | 51.8 | 55.3 | 61.6 | 55.2 | 59.0 | 54.7 |
| No | 74.5 | 48.2 | 44.7 | 38.4 | 44.8 | 41.0 | 45.3 |
NOTE: 278 responses.
| Jun. '21 (percent) |
Sep. '21 (percent) |
Nov. '21 (percent) |
Feb. '22 (percent) |
May '22 (percent) |
Aug. '22 (percent) |
|
| Improved significantly | 2.1 | 1.4 | 1.2 | 0.0 | 1.3 | 0.7 |
| Improved slightly | 19.7 | 21.2 | 19.3 | 25.9 | 31.8 | 46.4 |
| No change | 20.4 | 30.1 | 30.4 | 36.7 | 33.8 | 30.5 |
| Worsened slightly | 39.4 | 32.2 | 36.6 | 29.3 | 27.4 | 18.5 |
| Worsened significantly | 18.3 | 15.1 | 12.4 | 8.2 | 5.7 | 4.0 |
NOTES: 151 responses. This question was only posed to those currently experiencing any supply-chain disruptions or delays.
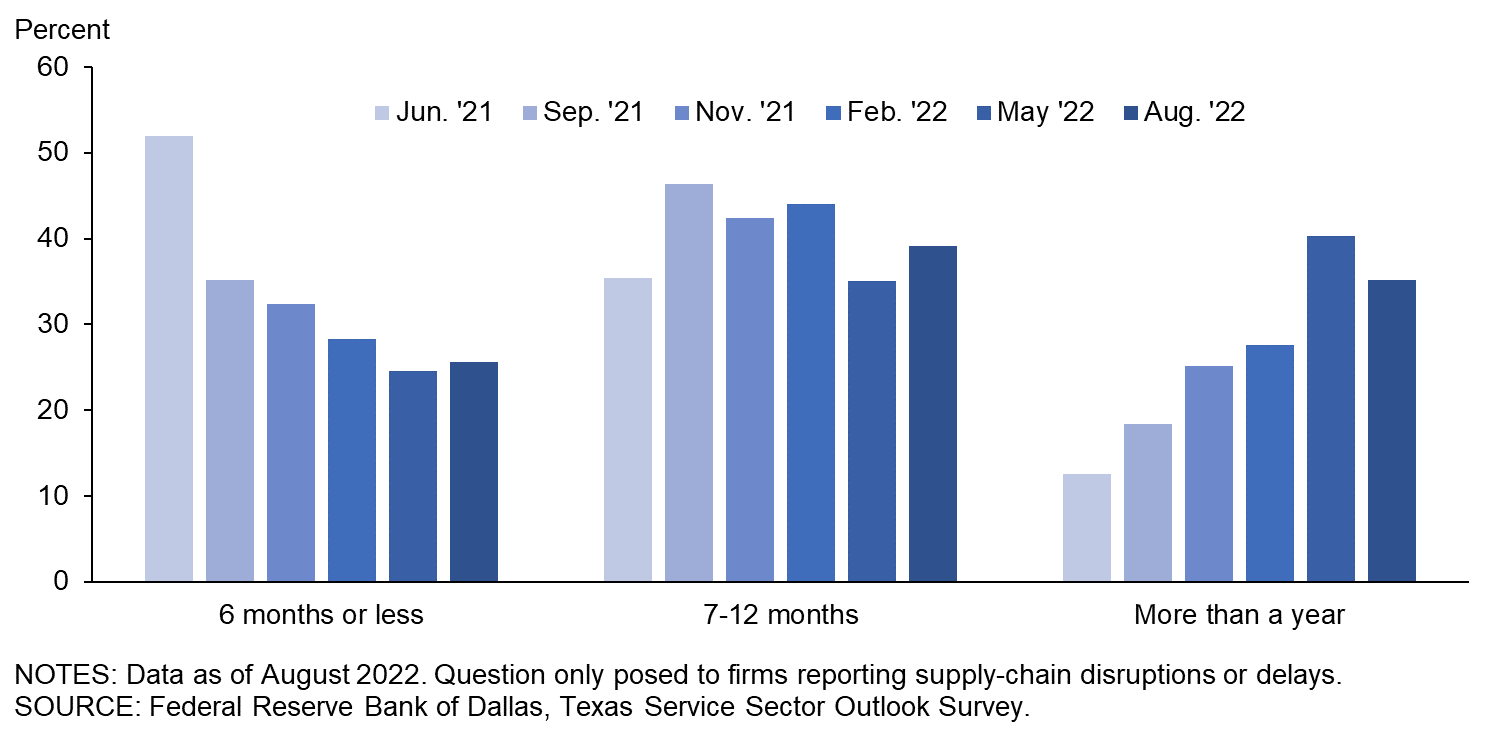
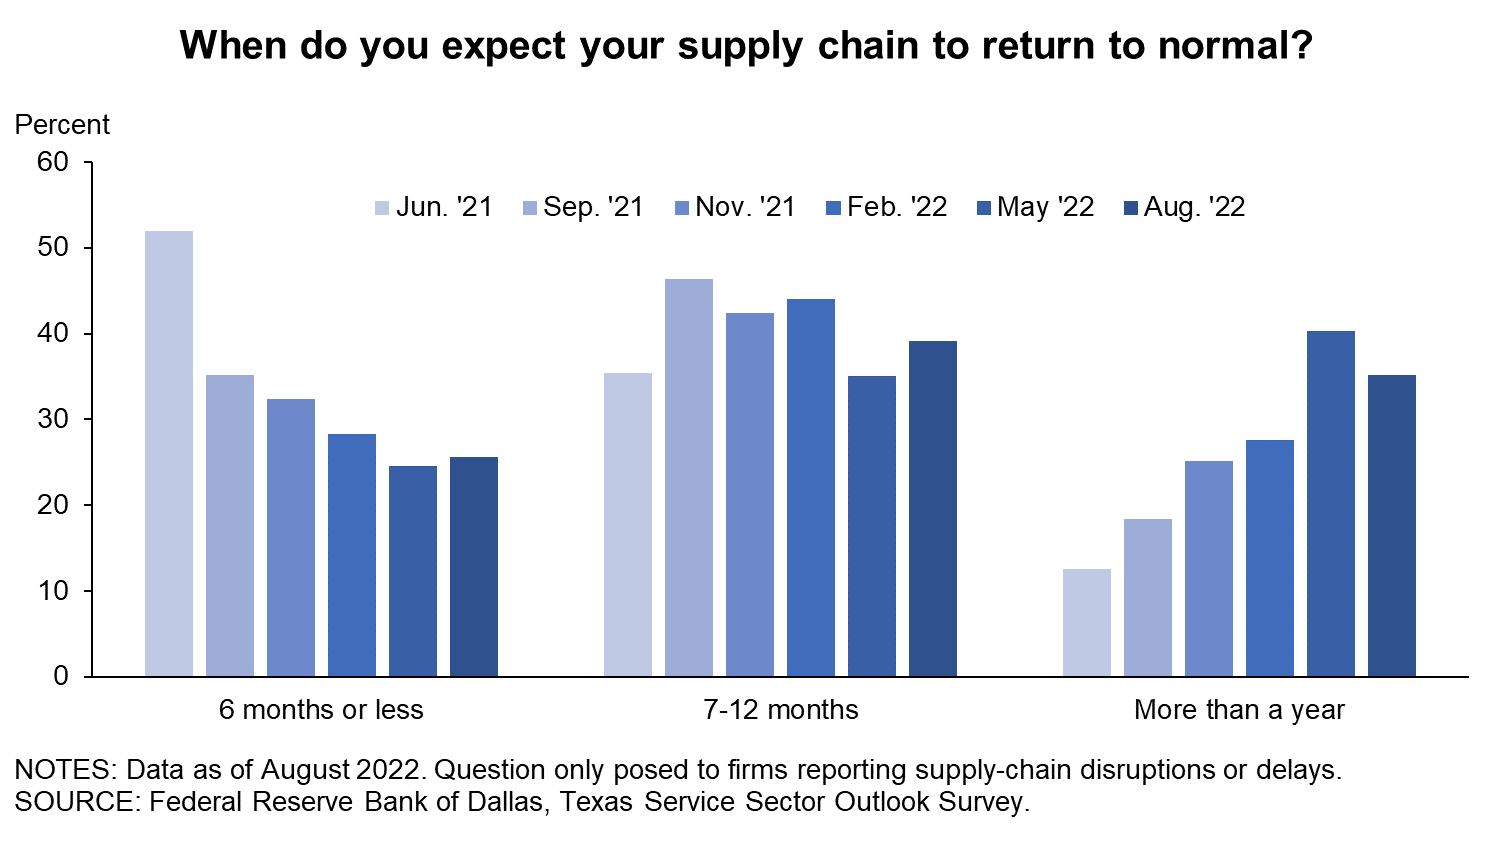
| Jun. '21 (percent) |
Sep. '21 (percent) |
Nov. '21 (percent) |
Feb. '22 (percent) |
May '22 (percent) |
Aug. '22 (percent) |
|
| Less than a month | 0.8 | 0.0 | 0.0 | 0.8 | 0.0 | 0.8 |
| 1–3 months | 10.2 | 8.8 | 7.9 | 5.5 | 5.2 | 8.0 |
| 4–6 months | 40.9 | 26.4 | 24.5 | 22.0 | 19.4 | 16.8 |
| 7–9 months | 22.0 | 20.8 | 20.9 | 18.1 | 14.9 | 21.6 |
| 10– 12 months | 13.4 | 25.6 | 21.6 | 26.0 | 20.1 | 17.6 |
| More than a year | 12.6 | 18.4 | 25.2 | 27.6 | 40.3 | 35.2 |
NOTES: 125 responses. This question was only posed to those currently experiencing any supply-chain disruptions or delays. These calculations exclude respondents that answered “Not sure,” which represented 10.6 percent of responses in June ’21, 14.4 percent in Sep. ’21, 14.2 percent in Nov. ’21, 14.8 percent in Feb. ’22, 14.6 percent in May ’22 and 17.2 percent in Aug. ’22.
| Dec. '18 (percent) |
Aug. '19 (percent) |
May '21 (percent) |
Jul. '21 (percent) |
Dec. '21 (percent) |
May '22 (percent) |
Aug. '22 (percent) |
|
| None | 28.0 | 41.2 | 43.9 | 48.0 | 30.7 | 38.2 | 30.1 |
| Some | 48.5 | 43.3 | 36.1 | 35.8 | 42.5 | 43.5 | 47.3 |
| Most | 15.5 | 10.6 | 11.9 | 10.0 | 19.7 | 12.2 | 13.7 |
| All | 8.0 | 4.9 | 8.2 | 6.1 | 7.0 | 6.1 | 9.0 |
NOTE: 256 responses.
Special Questions Comments
These comments have been edited for publication.
- Supply-chain disruptions are delaying a capital expenditure project by two months as we wait for technical equipment from Canada.
- Insurance costs for property insurance in Texas are continuing to increase; we quote those and pass [the increases] along to the client.
- The pass-through of costs is indirect. We are in real estate, so rental increases help but do not address the core of changing margins.
- The pandemic caused a whole lot of the workforce that built this country for the last 40 years to retire; many of the baby boomers just said they are done. I suspect that is what has happened to the workforce.
- While our labor costs in consulting are based on what the traffic will bear in any specific job, the percentage given to the provider (contractor) has stayed constant. This means that the providing contractor may get a lower hourly rate, and they have the choice to work or not.
- We have too many balls in the air to accurately predict the future with any reliability. An extreme shortage of concrete is slowing construction, with a significant impact on profit.
- For fixed-fee professional services, our profit margin is shrinking due to high inflation, wage escalation, a drop in productivity, interruptions due to health and child care problems, and more time being spent on training. A lack of qualified and experienced applicants continues to hold back our capacity to grow, replace underperforming staff and increase productivity. We need immediate immigration reform to augment and supply our industries with eager experienced workers. As for productivity, the pandemic has taken the air out of seasoned workers, and young workers seem to be pretty clueless to its importance.
- The cost of labor has increased faster than we can increase billing rates for engineering services.
- We operate under five-year contracts with fixed prices. Only the volume of transactions changes from month to month, but it has been steady the last two quarters.
- We are deploying a range of tools to address the level of work and availability of staff including better allocating available resources, more-effective client retention strategies and alternative staffing strategies.
- We are unable to pass cost increases on to customers.
- In health care, we have no pricing ability. We are dependent upon the payors who have not budged during this wage crisis. This is a deflationary industry.
- [We are on] fixed contracts with government and insurers. There is no chance to pass increased costs to customers, and there is growing margin pressure in health care and among health care providers.
- There is little opportunity in health care to pass along cost increases when most reimbursement is fixed per contract or government regulation.
- Our cost of goods has risen beyond what I can charge for a burrito. So, we have to then increase [prices by an amount] we believe will have less customer resistance.
- We can only charge guests so much for a meal, but our costs for everything are skyrocketing. Our P&L [property and liability] insurance renewal increased 130 percent. This is unsustainable.
- I increased my wages in March and passed along those costs. Next, I will pass along the credit card fees to the customer [and introduce] a cash discount program. I have been reluctant, but I see it everywhere. By doing so, I will add to the bottom line, which, in order to prevent a cash flow problem, I think is a good solution.
- Equipment (brewing and grinding machines purchased from Europe) and supplies (napkins, cups, etc.) are still difficult to acquire with certainty and not possible to acquire on a short timeline.
Texas Retail Outlook Survey
Data were collected August 16–24, and 56 Texas retailers responded to the survey.
| Feb. '21 (percent) |
Jun. '21 (percent) |
Sep. '21 (percent) |
Nov. '21 (percent) |
Feb. '22 (percent) |
May '22 (percent) |
Aug. '22 (percent) |
|
| Yes | 64.4 | 87.2 | 80.9 | 93.0 | 84.4 | 83.7 | 80.4 |
| No | 35.6 | 12.8 | 19.1 | 7.0 | 15.6 | 16.3 | 19.6 |
NOTE: 56 responses.
| Jun. '21 (percent) |
Sep. '21 (percent) |
Nov. '21 (percent) |
Feb. '22 (percent) |
May '22 (percent) |
Aug. '22 (percent) |
|
| Improved significantly | 0.0 | 0.0 | 0.0 | 0.0 | 2.8 | 0.0 |
| Improved slightly | 22.0 | 23.7 | 25.0 | 21.1 | 36.1 | 40.0 |
| No change | 17.1 | 28.9 | 30.0 | 34.2 | 36.1 | 35.6 |
| Worsened slightly | 34.1 | 15.8 | 32.5 | 31.6 | 19.4 | 17.8 |
| Worsened significantly | 26.8 | 31.6 | 12.5 | 13.2 | 5.6 | 6.7 |
NOTES: 45 responses. This question was only posed to those currently experiencing any supply-chain disruptions or delays.
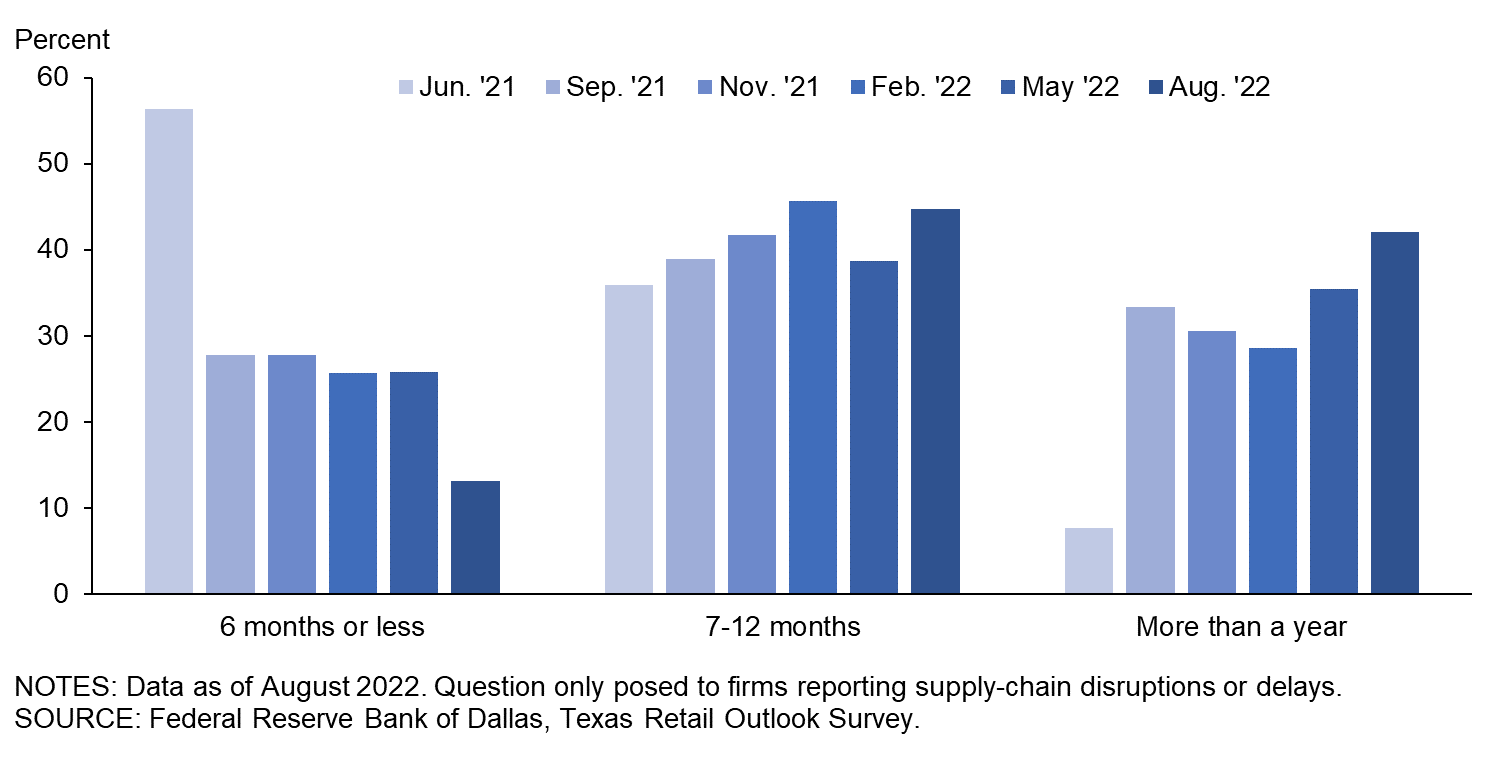
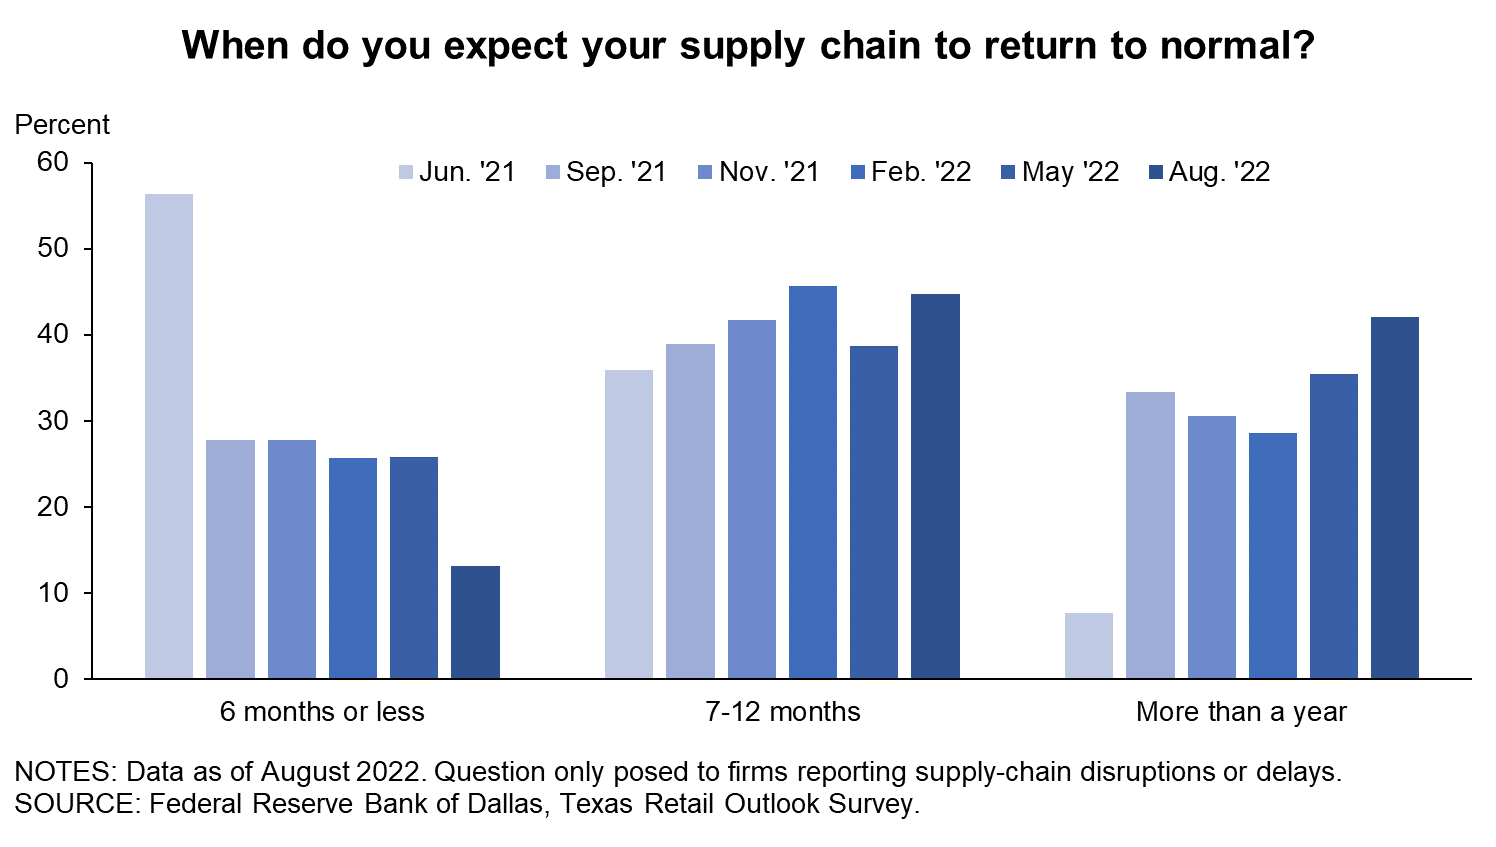
| Jun. '21 (percent) |
Sep. '21 (percent) |
Nov. '21 (percent) |
Feb. '22 (percent) |
May '22 (percent) |
Aug. '22 (percent) |
|
| Less than a month | 0.0 | 0.0 | 0.0 | 0.0 | 0.0 | 0.0 |
| 1–3 months | 15.4 | 11.1 | 2.8 | 0.0 | 3.2 | 2.6 |
| 4–6 months | 41.0 | 16.7 | 25.0 | 25.7 | 22.6 | 10.5 |
| 7–9 months | 12.8 | 16.7 | 25.0 | 25.7 | 16.1 | 23.7 |
| 10– 12 months | 23.1 | 22.2 | 16.7 | 20.0 | 22.6 | 21.1 |
| More than a year | 7.7 | 33.3 | 30.6 | 28.6 | 35.5 | 42.1 |
NOTES: 38 responses. This question was only posed to those currently experiencing any supply-chain disruptions or delays. These calculations exclude respondents that answered “Not sure,” which represented 4.9 percent of responses in June ’21, 5.3 percent in Sep. ’21, 10.0 percent in Nov. ’21, 7.9 percent in Feb ’22, 13.9 percent in May ’22 and 15.6 percent in Aug. ’22.
| Dec. '18 (percent) |
Aug. '19 (percent) |
May '21 (percent) |
Jul. '21 (percent) |
Dec. '21 (percent) |
May '22 (percent) |
Aug. '22 (percent) |
|
| None | 18.4 | 26.5 | 20.4 | 26.2 | 14.3 | 14.0 | 9.4 |
| Some | 52.6 | 53.1 | 51.0 | 35.7 | 34.3 | 44.2 | 47.2 |
| Most | 15.8 | 10.2 | 18.4 | 26.2 | 40.0 | 27.9 | 24.5 |
| All | 13.2 | 10.2 | 10.2 | 11.9 | 11.4 | 14.0 | 18.9 |
NOTE: 53 responses.
Special Questions Comments
These comments have been edited for publication.
- The general outlook toward the economy is one of expected inflation. This understanding is providing some acceptance of higher prices.
- We are passing additional costs and surcharges on to consumers as a separate line item; however, as these charges continue to increase, that number has gotten so large that we are starting to see some consumer pushback. My concern about surcharges is that they'll be just like the fuel surcharges that [transportation companies] rolled out in 2009. Once started, they'll never go away. Our vendors will always find some reason to justify them.
- I can't raise prices as fast as they [prices] are [increasing] for my company. If I did, it would hurt my business. We are making less profit now.
- Commodity-based sales are hard to pass through to customers.
Questions regarding the Texas Business Outlook Surveys can be addressed to Emily Kerr at emily.kerr@dal.frb.org.
Sign up for our email alert to be automatically notified as soon as the latest surveys are released on the web.