Special Questions

Special Questions
For this month’s survey, Texas business executives were asked supplemental questions on labor market conditions. Results below include responses from participants from both the Texas Manufacturing Outlook Survey and Texas Service Sector Outlook Survey.
Texas Business Outlook Surveys
Data were collected July 14-22 and 305 Texas business executives responded to the surveys.
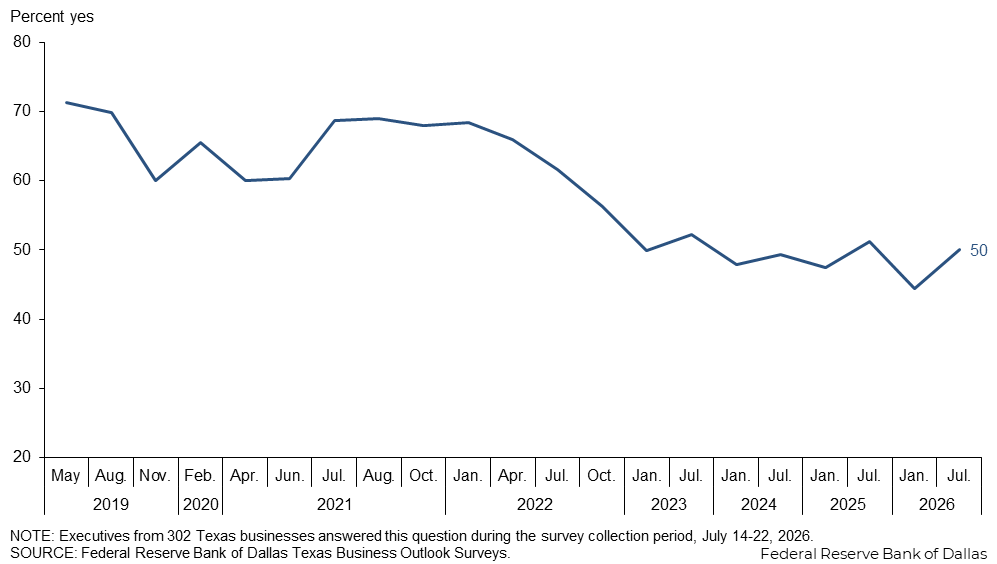
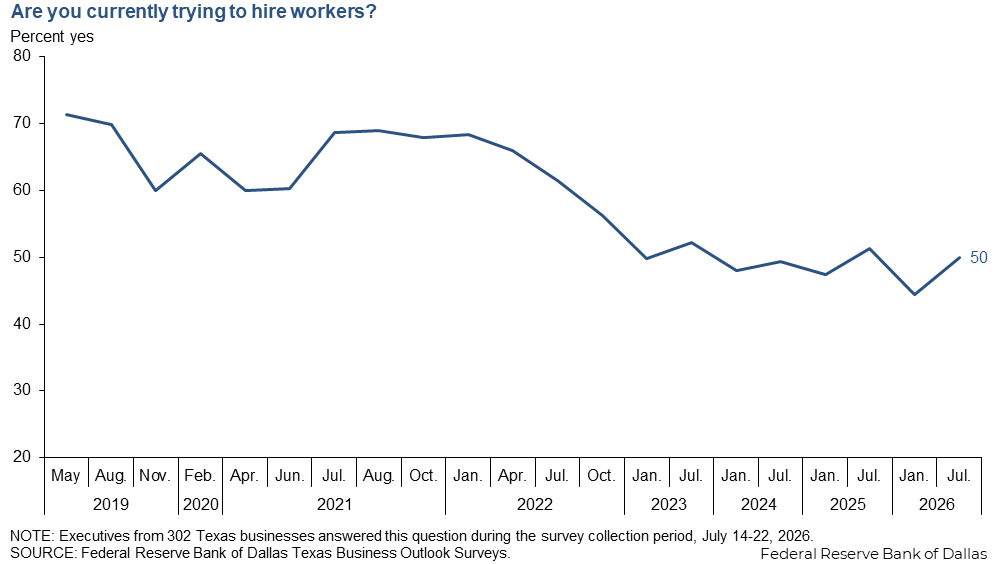
Half of surveyed firms are currently trying to hire, up from a low of 44 percent in January. Hiring is slightly more widespread in the service sector than in manufacturing.
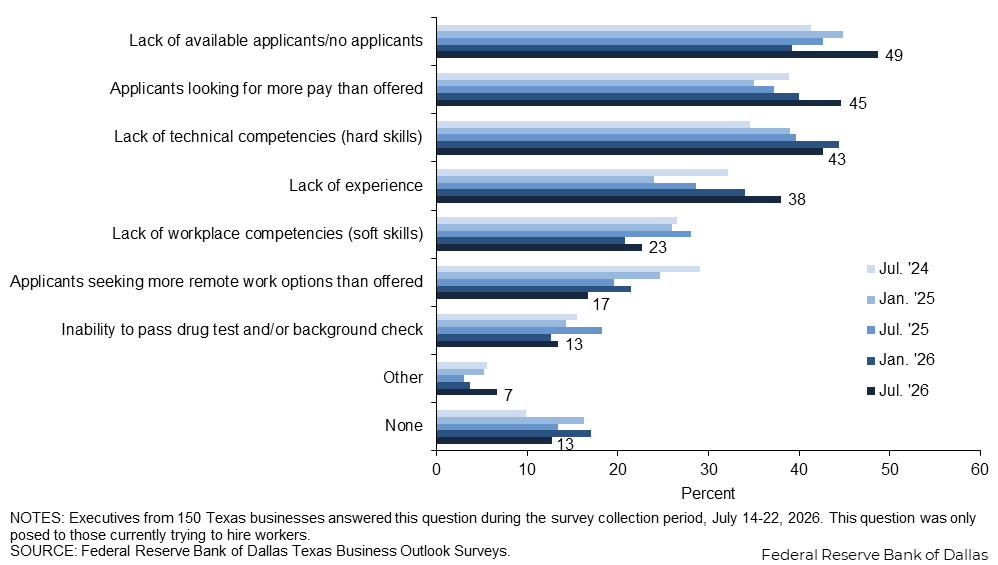
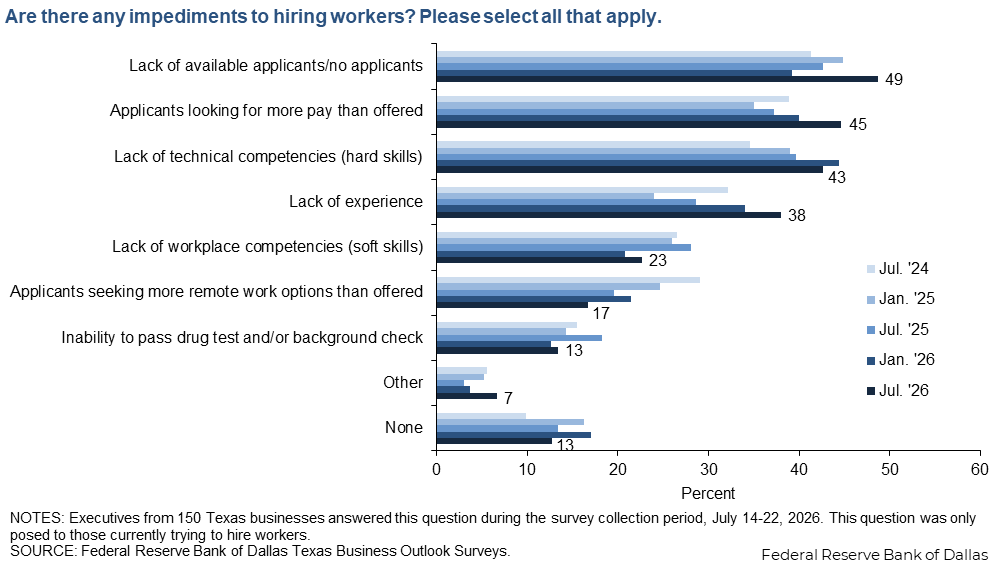
A shortage of applicants became the top hiring impediment, followed by applicants looking for more pay than offered. Lack of experience continues to become a more widespread obstacle, while applicants seeking more remote work options continues to retreat.
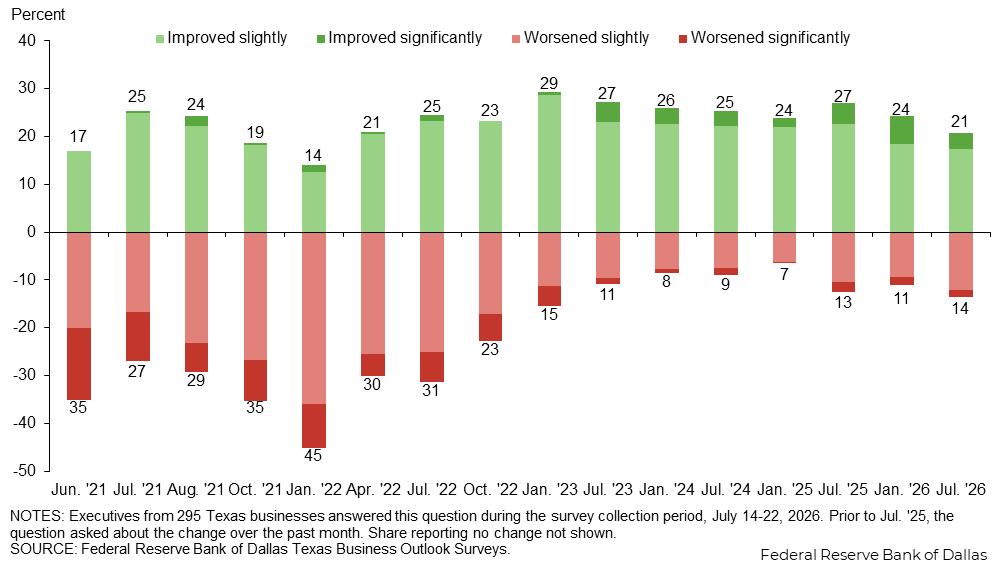
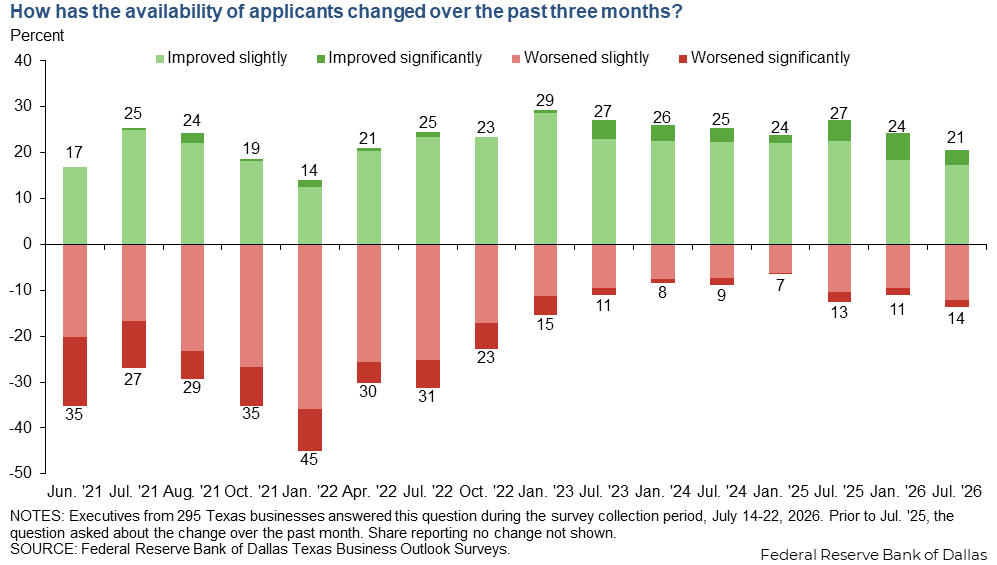
Availability of applicants improved on net over the past three months, a continuation of the trend since the beginning of 2023.
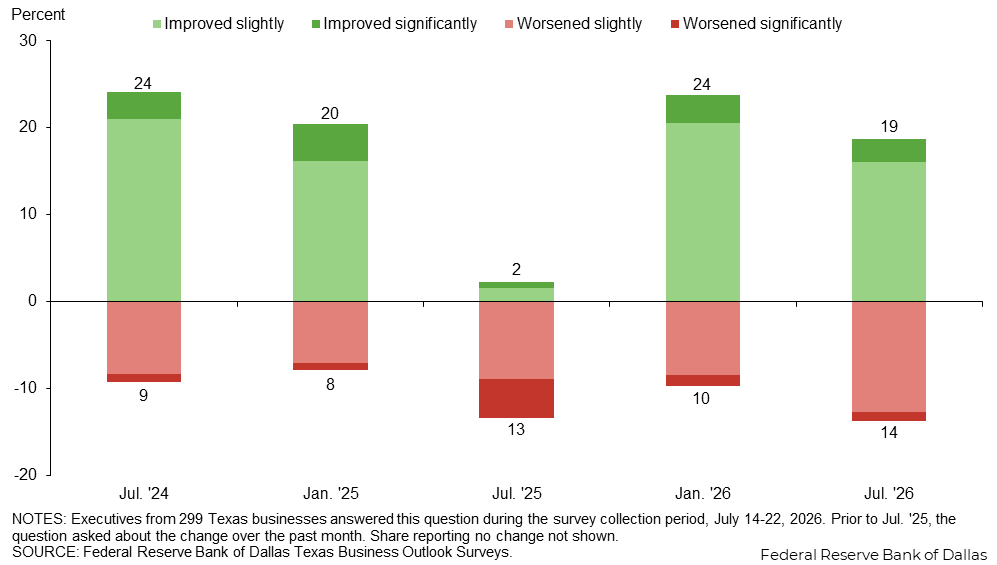
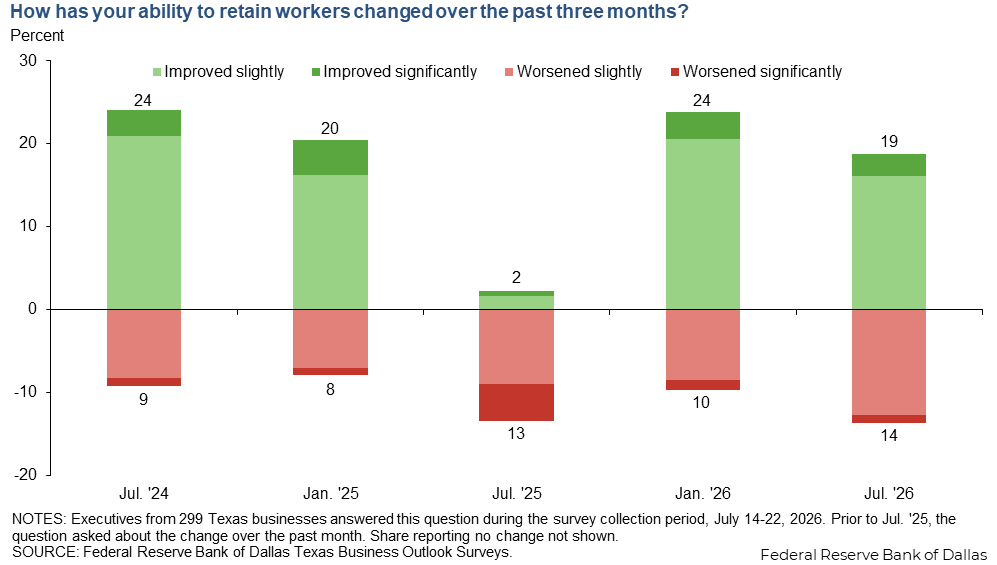
Worker retention has become easier over the past three months on net, though the gap between the share reporting an improvement and the share reporting a worsening has narrowed somewhat since January.
Fourteen percent of firms reported an impact from immigration policy changes. The share was slightly higher in the service sector than in manufacturing.
| Jan. '26 (percent) |
Jul. '26 (percent) |
|
| Yes, in a way that significantly impacts our overall operations | 5.2 | 5.0 |
| Yes, in a way that slightly impacts our overall operations | 11.0 | 9.0 |
| No | 54.2 | 56.5 |
| Not applicable | 29.5 | 29.6 |
NOTE: 301 responses.
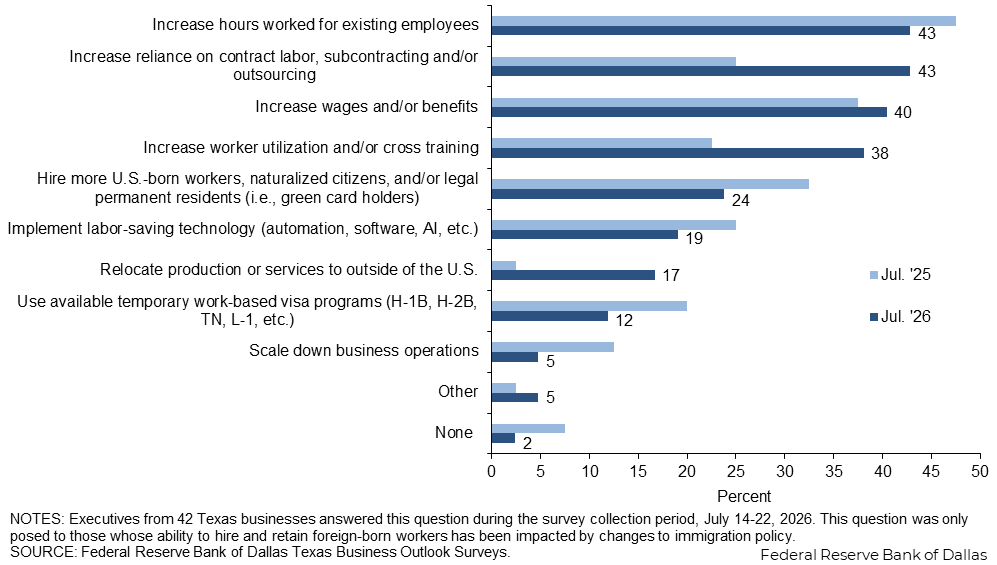
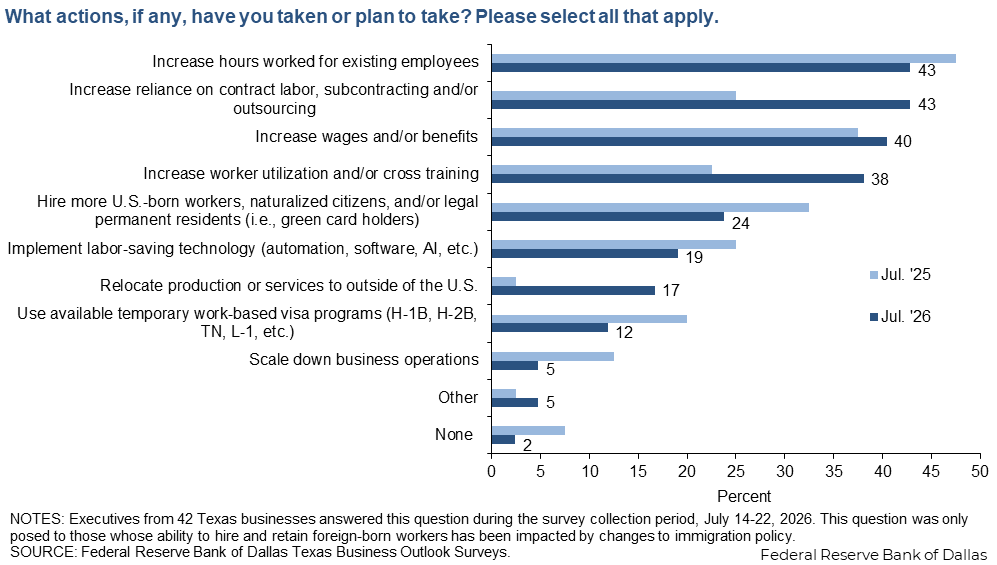
Increasing work hours and increasing reliance on contract labor or outsourcing are the top two actions taken in response to workforce impacts from immigration policy changes. The shares of firms increasing worker utilization or relocating operations outside of the U.S. rose notably compared with a year ago.
Among firms noting that immigration policy changes have not impacted their ability to hire and retain foreign-born workers, the vast majority do not expect an impact to materialize in the remainder of the year.
| Jul. '26 (percent) |
|
| Yes, in a way that significantly impacts our overall operations | 1.8 |
| Yes, in a way that slightly impacts our overall operations | 4.1 |
| No | 89.9 |
| Not applicable | 4.1 |
NOTES: 169 responses. This question was only posed to those answering no to question 4.
Responses can be found on the individual survey Special Questions results pages, accessible on the Manufacturing and Service Sector tabs above.
Survey respondents were given the opportunity to also provide comments, which can be found in the Comments tab above.
Texas Manufacturing Outlook Survey
Data were collected July 14-22 and 64 Texas manufacturers responded to the survey.
| Jul. '23 (percent) |
Jan. '24 (percent) |
Jul. '24 (percent) |
Jan. '25 (percent) |
Jul. '25 (percent) |
Jan. '26 (percent) |
Jul. '26 (percent) |
|
| Yes | 55.4 | 46.1 | 46.2 | 42.5 | 43.4 | 43.0 | 44.4 |
| No | 44.6 | 53.9 | 53.8 | 57.5 | 56.6 | 57.0 | 55.6 |
NOTE: 63 responses.
| Jul. '23 (percent) |
Jan. '24 (percent) |
Jul. '24 (percent) |
Jan. '25 (percent) |
Jul. '25 (percent) |
Jan. '26 (percent) |
Jul. '26 (percent) |
|
| Lack of technical competencies (hard skills) | 60.9 | 63.4 | 41.7 | 52.9 | 51.5 | 47.1 | 57.1 |
| Lack of available applicants/no applicants | 56.5 | 53.7 | 36.1 | 35.3 | 42.4 | 38.2 | 53.6 |
| Lack of experience | 56.5 | 39.0 | 25.0 | 32.4 | 27.3 | 29.4 | 50.0 |
| Applicants looking for more pay than offered | 45.7 | 31.7 | 33.3 | 35.3 | 36.4 | 41.2 | 35.7 |
| Lack of workplace competencies (soft skills) | 30.4 | 29.3 | 19.4 | 29.4 | 24.2 | 23.5 | 25.0 |
| Inability to pass drug test and/or background check | 23.9 | 19.5 | 19.4 | 20.6 | 24.2 | 20.6 | 17.9 |
| Applicants seeking more remote work options than offered> | 12.2 | 22.2 | 20.6 | 9.1 | 11.8 | 3.6 | |
| Other | 0.0 | 2.4 | 5.6 | 2.9 | 6.1 | 2.9 | 3.6 |
| None | 4.3 | 9.8 | 16.7 | 23.5 | 18.2 | 23.5 | 10.7 |
| Don’t know | 0.0 | 0.0 |
NOTES: 28 responses. This question was only posed to those currently trying to hire workers. “Applicants seeking more remote work options than offered" was added in Jan. ’24.
| Jul. '23 (percent) |
Jan. '24 (percent) |
Jul. '24 (percent) |
Jan. '25 (percent) |
Jul. '25 (percent) |
Jan. '26 (percent) |
Jul. '26 (percent) |
|
| Improved significantly | 4.9 | 3.4 | 3.9 | 1.2 | 5.4 | 6.3 | 1.6 |
| Improved slightly | 22.2 | 25.0 | 23.7 | 21.0 | 23.0 | 16.5 | 14.8 |
| No change | 65.4 | 64.8 | 59.2 | 69.1 | 56.8 | 59.5 | 70.5 |
| Worsened slightly | 7.4 | 4.5 | 9.2 | 7.4 | 12.2 | 15.2 | 11.5 |
| Worsened significantly | 0.0 | 2.3 | 3.9 | 1.2 | 2.7 | 2.5 | 1.6 |
NOTES: 61 responses. Prior to Jul. '25, the question asked about the change over the past month.
| Jan. '24 (percent) |
Jul. '24 (percent) |
Jan. '25 (percent) |
Jul. '25 (percent) |
Jan. '26 (percent) |
Jul. '26 (percent) |
|
| Improved significantly | 7.9 | 3.9 | 6.2 | 0.0 | 2.5 | 6.5 |
| Improved slightly | 24.7 | 27.6 | 19.8 | 0.0 | 24.1 | 12.9 |
| No change | 59.6 | 63.2 | 65.4 | 90.1 | 62.0 | 71.0 |
| Worsened slightly | 6.7 | 3.9 | 8.6 | 8.5 | 10.1 | 9.7 |
| Worsened significantly | 1.1 | 1.3 | 0.0 | 1.4 | 1.3 | 0.0 |
NOTES: 62 responses. Prior to Jul. '25, the question asked about the change over the past month.
| Jan. '26 (percent) |
Jul. '26 (percent) |
|
| Yes, in a way that significantly impacts our overall operations | 7.6 | 1.6 |
| Yes, in a way that slightly impacts our overall operations | 8.9 | 9.5 |
| No | 55.7 | 63.5 |
| Not applicable | 27.8 | 25.4 |
NOTE: 63 responses.
| Jul. '26 (percent) |
|
| Yes, in a way that significantly impacts our overall operations | 0.0 |
| Yes, in a way that slightly impacts our overall operations | 7.5 |
| No | 85.0 |
| Not applicable | 7.5 |
NOTES: 40 responses. This question was only posed to those answering no to question 4.
- Current immigration policy will lead to worker shortages in the future.
- Workers with experience and skillsets appear to be declining in the Permian Basin area.
- We have always been open to hiring any qualified candidate who is legally allowed to work. However, the changes to Temporary Protected Status make it difficult to hire people under that status, because it could end for their country with very little notice. It is expensive for us to hire and train workers, so on balance we prefer to hire a qualified candidate who has a higher likelihood of being able to work over the long term.
- We have board members who are in the dairy and agriculture sectors. It is impacting them and will do so in the future.
Texas Service Sector Outlook Survey
Data were collected July 14-22 and 241 Texas manufacturers responded to the survey.
| Jul. '23 (percent) |
Jan. '24 (percent) |
Jul. '24 (percent) |
Jan. '25 (percent) |
Jul. '25 (percent) |
Jan. '26 (percent) |
Jul. '26 (percent) |
|
| Yes | 51.3 | 48.6 | 50.4 | 49.0 | 53.7 | 44.8 | 51.5 |
| No | 48.7 | 51.4 | 49.6 | 51.0 | 46.3 | 55.2 | 48.5 |
NOTE: 239 responses.
| Jul. '23 (percent) |
Jan. '24 (percent) |
Jul. '24 (percent) |
Jan. '25 (percent) |
Jul. '25 (percent) |
Jan. '26 (percent) |
Jul. '26 (percent) |
|
| Lack of available applicants/no applicants | 54.7 | 47.7 | 42.9 | 47.5 | 42.7 | 39.6 | 47.5 |
| Applicants looking for more pay than offered | 57.6 | 47.0 | 40.5 | 35.0 | 37.4 | 39.6 | 46.7 |
| Lack of technical competencies (hard skills) | 43.9 | 40.2 | 32.5 | 35.0 | 36.6 | 43.6 | 39.3 |
| Lack of experience | 40.3 | 28.0 | 34.1 | 21.7 | 29.0 | 35.6 | 35.2 |
| Lack of workplace competencies (soft skills) | 26.6 | 21.2 | 28.6 | 25.0 | 29.0 | 19.8 | 22.1 |
| Applicants seeking more remote work options than offered | 20.5 | 31.0 | 25.8 | 22.1 | 24.8 | 19.7 | |
| Inability to pass drug test and/or background check | 16.5 | 18.2 | 14.3 | 12.5 | 16.8 | 9.9 | 12.3 |
| Other | 5.0 | 6.1 | 5.6 | 5.8 | 2.3 | 4.0 | 7.4 |
| None | 5.8 | 12.9 | 7.9 | 14.2 | 12.2 | 14.9 | 13.1 |
| Don’t know | 1.6 | 0.0 |
NOTES: 122 responses. This question was only posed to those currently trying to hire workers. “Applicants seeking more remote work options than offered" was added in Jan. ’24.
| Jul. '23 (percent) |
Jan. '24 (percent) |
Jul. '24 (percent) |
Jan. '25 (percent) |
Jul. '25 (percent) |
Jan. '26 (percent) |
Jul. '26 (percent) |
|
| Improved significantly | 4.0 | 3.4 | 2.8 | 2.1 | 4.1 | 5.7 | 3.8 |
| Improved slightly | 23.2 | 21.8 | 21.8 | 22.4 | 22.5 | 19.2 | 17.9 |
| No change | 60.9 | 65.8 | 67.7 | 69.7 | 61.5 | 66.4 | 64.5 |
| Worsened slightly | 10.1 | 8.6 | 6.9 | 5.8 | 9.8 | 7.4 | 12.4 |
| Worsened significantly | 1.8 | 0.4 | 0.8 | 0.0 | 2.0 | 1.3 | 1.3 |
NOTES: 234 responses. Prior to Jul. '25, the question asked about the change over the past month.
| Jan. '24 (percent) |
Jul. '24 (percent) |
Jan. '25 (percent) |
Jul. '25 (percent) |
Jan. '26 (percent) |
Jul. '26 (percent) |
|
| Improved significantly | 2.2 | 2.8 | 3.7 | 0.8 | 3.5 | 1.7 |
| Improved slightly | 23.8 | 19.0 | 15.0 | 2.1 | 19.3 | 16.9 |
| No change | 67.8 | 67.7 | 73.6 | 82.6 | 68.0 | 66.7 |
| Worsened slightly | 5.5 | 9.7 | 6.5 | 9.1 | 7.9 | 13.5 |
| Worsened significantly | 0.7 | 0.8 | 1.2 | 5.4 | 1.3 | 1.3 |
NOTES: 237 responses. Prior to Jul. '25, the question asked about the change over the past month.
| Jan. '26 (percent) |
Jul. '26 (percent) |
|
| Yes, in a way that significantly impacts our overall operations | 4.4 | 5.9 |
| Yes, in a way that slightly impacts our overall operations | 11.8 | 8.8 |
| No | 53.7 | 54.6 |
| Not applicable | 30.1 | 30.7 |
NOTE: 238 responses.
| Jul. '26 (percent) |
|
| Yes, in a way that significantly impacts our overall operations | 2.3 |
| Yes, in a way that slightly impacts our overall operations | 3.1 |
| No | 91.5 |
| Not applicable | 3.1 |
NOTES: 129 responses. This question was only posed to those answering no to question 4.
- From what I have observed over the last 10 years, a lot of food production (beef, chicken, pork kill-plants) relies heavily on immigrants. It’s hard work. If there aren’t any immigrants working the lines, I’m not sure how the production plants are backfilling the void. We are not seeing any disruption in the supply chain, so I’m assuming for now, they’re able to cover any labor gaps.
- The few workers we have on temporary work visas are less likely to see a future with our company.
- Fewer customers to sell to.
- It scares the legal immigrant workers.
- We have more law enforcement officers in our region because they are not at the border, so more truck inspections.
- ICE raids.
- Uncertain change in law will impact current H-1B hires.
- Residents and workers alike are terrified of [ICE]. It is negatively impacting our apartment occupancy and ability to get work done efficiently.
- We are very dedicated to our immigrant labor pools since they are tried and tested over many years. We continue to employ deported team members in their home countries via offshore, remote contracts. And then we’ve built local teams around them at lower labor rates, all bolstered by heavy investments in AI too. Overzealous deportation campaigns of non-criminal, productive labor are a terrible idea.
- Our immigrant workers have advanced degrees from universities. We have not seen a change in availability of applicants, but there are some countries for which it is difficult to obtain a visa.
- The lack of immigrants, hence, in-migration to Dallas, has slowed the demand for rental housing and fast-food eating establishments, hence, slowed apartment demand and its outlook somewhat. The lack of new workers will slow the growth rate of Dallas. City of Dallas is facing some revenue shortages. We need new hardworking, tax paying immigrants.
- This does not impact my company. There are times that we have requests for very specialized engineers, and the cost of bringing on an employee on a specialized visa has gone up, so we have to look for people who already can work in the U.S. without any restrictions.
- Current policy raises anxiety among our workers.
- We lost an employee wanting to relocate to his/her home country due to immigration policies in the U.S.
- It is certainly making our partners quite nervous about how they provide services, which then puts stress on other work they consider doing. But because their attention is so laser-focused on their clients, it makes it difficult for them to think at a higher level and develop strategy.
- The disastrous immigration policy has reduced construction which reduces my consulting opportunities.
- The current restrictive immigration environment is impacting the availability of construction labor. Given that we operate within the architecture, engineering and construction (AEC) industry, these conditions are influencing overall market dynamics by reducing the available labor pool needed to execute projects. As a result, contractors may face increased challenges in staffing projects, which can contribute to higher labor costs, scheduling constraints and potential delays in project delivery.
- Immigration policy has an impact on the construction industry and not so much on the architectural/engineering sector.
- We do not hire [undocumented immigrants]. Recently, we have not had any [undocumented immigrants] apply to be hired. It used to be a common occurrence.
- All of our foreign-born employees are U.S. citizens and have been vetted through the government’s E-Verify system. Despite that, there is the constant concern that ICE or another federal entity will arrive on our property and take away employees indiscriminately or without just/legitimate cause.
- They affect our student population as well as our hiring ability. The supply of U.S. PhD-qualified academics is not sufficient to fill positions. Additionally, we have to be able to bring not only the employee but also their spouse, who may be at a different point in the visa/green card process.
- We don’t hire foreign workers directly. However, in the entertainment industry we do bring touring companies from around the world to perform, and we have had issues with those entertainers receiving their visas to perform, and with fees increasing. This has not been an issue in the past and has gotten to the point of performances being at risk. This creates new business risk for us, and hurts our ability to bring the best artists in the world to our city. You cannot substitute a foreign performer (or their company manager and other support people) with local people. That is not how this works. It’s like saying Adele is British, but she could be replaced by a local Adele impersonator. Yes, it is the “same show” but it is not the same. The visas for exceptional talent have never been problematic until the past two years.
- It is not helpful; people are concerned.
- At the risk of sounding like an old guy, too many young American-born workers are simply unwilling to put in the effort to learn and prove themselves so they may advance. This generation wants to set their own schedules, usually not when our guests want to dine with us, and have little to no skills or the willingness to learn. They ghost us when effort is required. Our legal immigrant staff is our backbone and share this opinion. Why can’t we get a workable immigration or guest-worker program?
- Immigration has always played a major role in our food industry because they will do the jobs Americans will not do.
- We are concerned about worker availability given the explosive growth of our region.
- Many of our industrial clients are experiencing delays in construction projects due to both legal and undocumented Hispanic workers being afraid to come to work.
Questions regarding the Texas Business Outlook Surveys can be addressed to Emily Kerr at emily.kerr@dal.frb.org.
Sign up for our email alert to be automatically notified as soon as the latest surveys are released on the web.
Special Questions Comments
Survey participants are given the opportunity to submit comments. Some comments have been edited for grammar and clarity.