Special Questions

Special Questions
For this month’s survey, Texas business executives were asked supplemental questions on demand and margins. Results below include responses from participants from both the Texas Manufacturing Outlook Survey and Texas Service Sector Outlook Survey.
Texas Business Outlook Surveys
Data were collected Aug. 18–26 and 304 Texas business executives responded to the surveys.
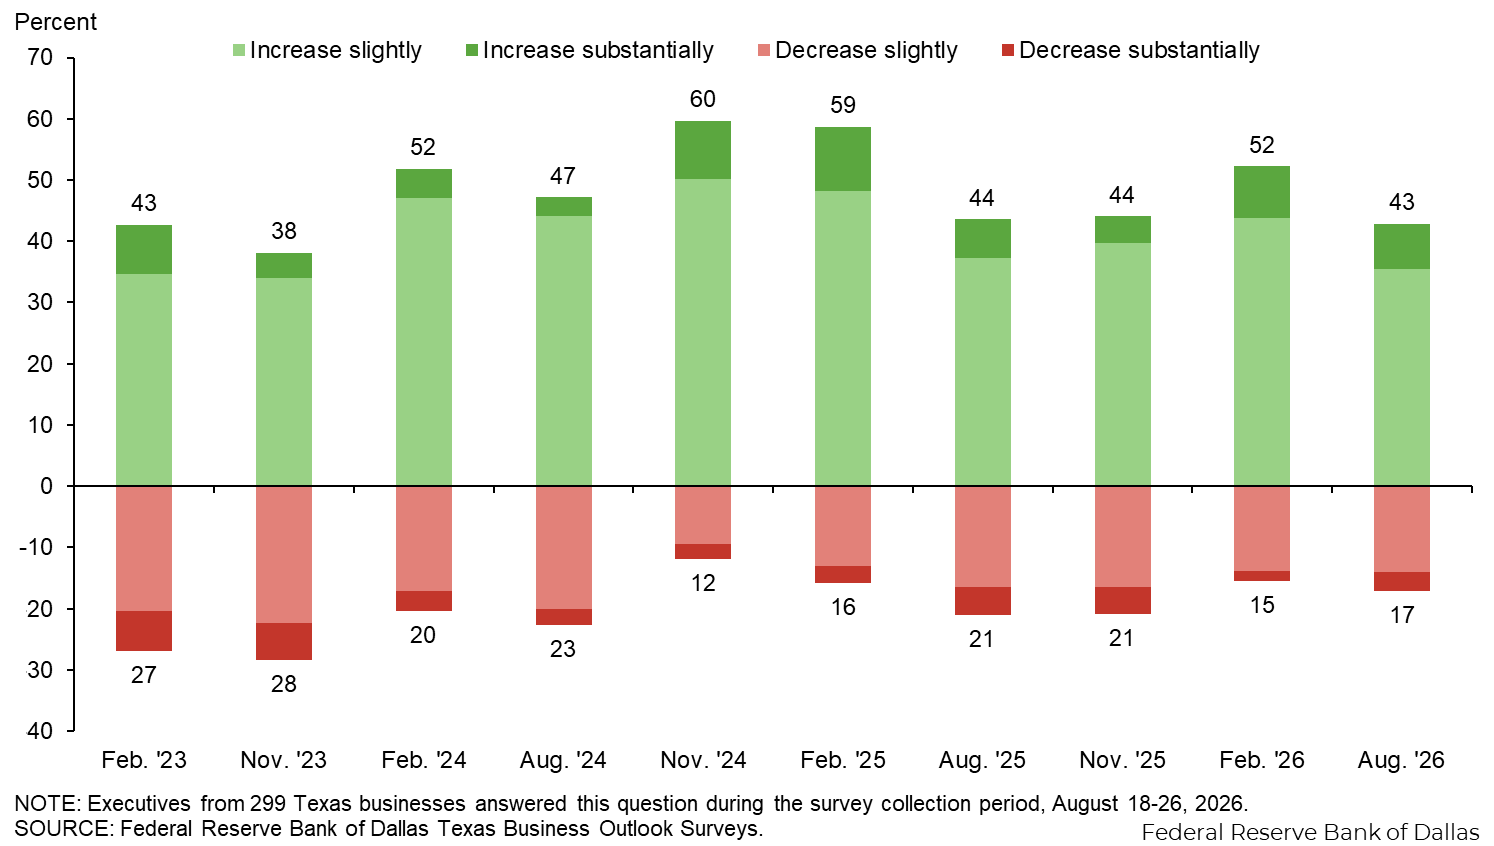
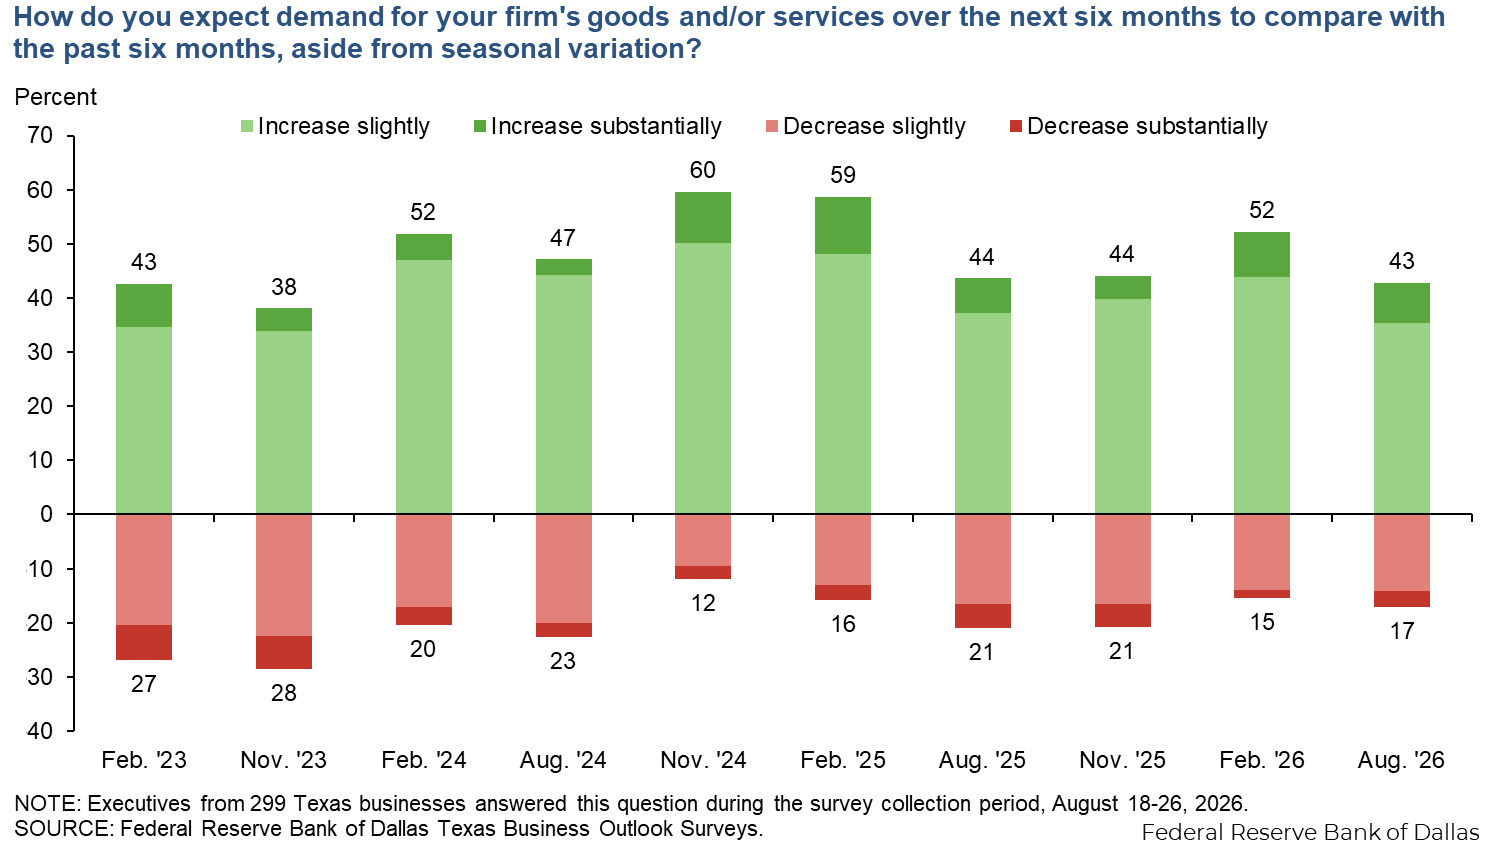
Demand expectations among Texas businesses are now slightly less bullish than what was reported in February. Of responding firms, 43 percent expect increases in demand over the next six months, exceeding the 17 percent share expecting decreases. Manufacturers in particular report optimism regarding future demand.
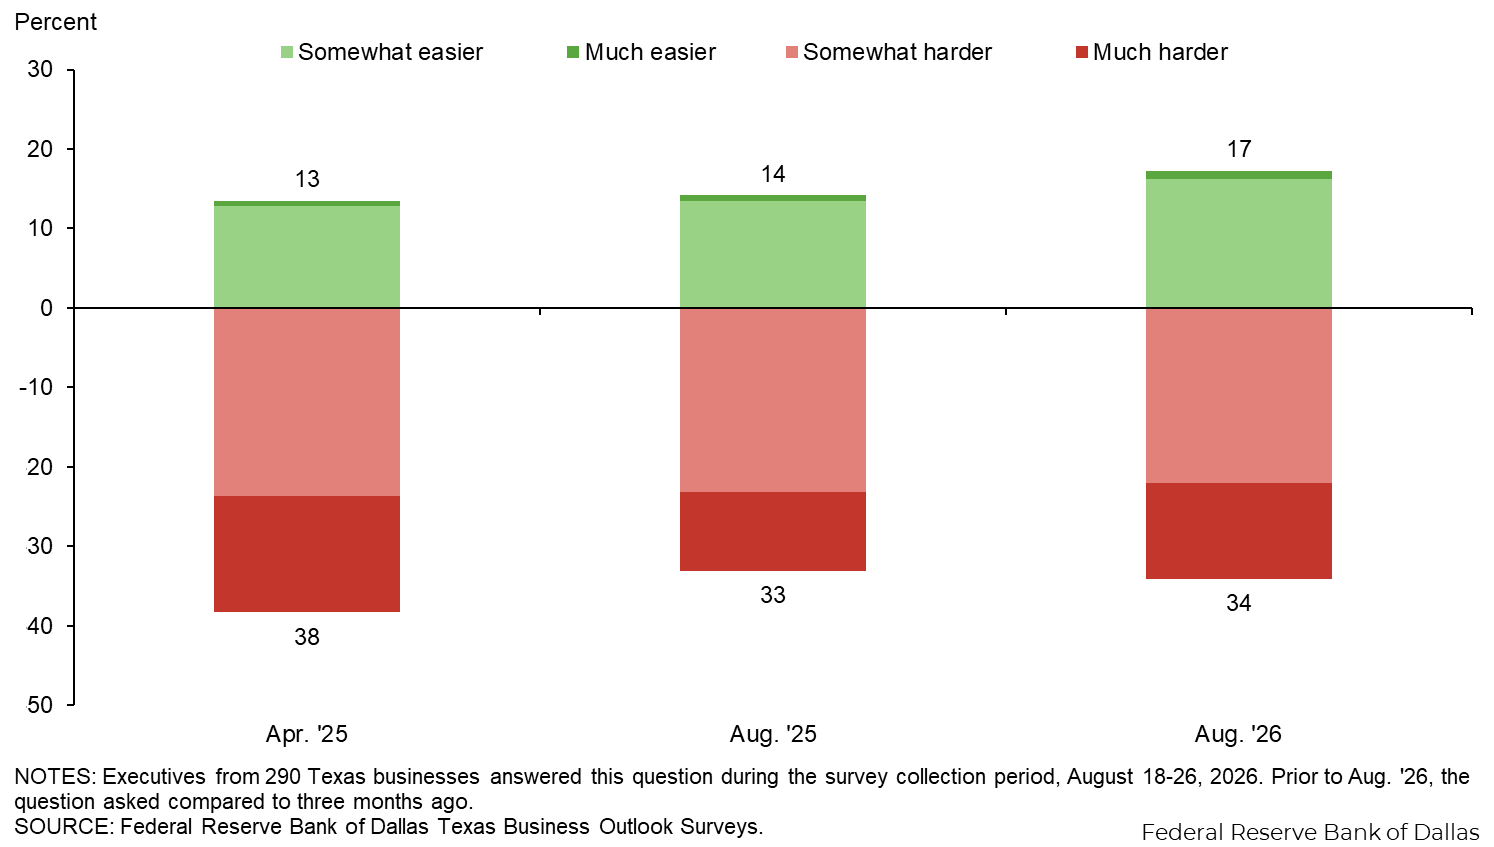
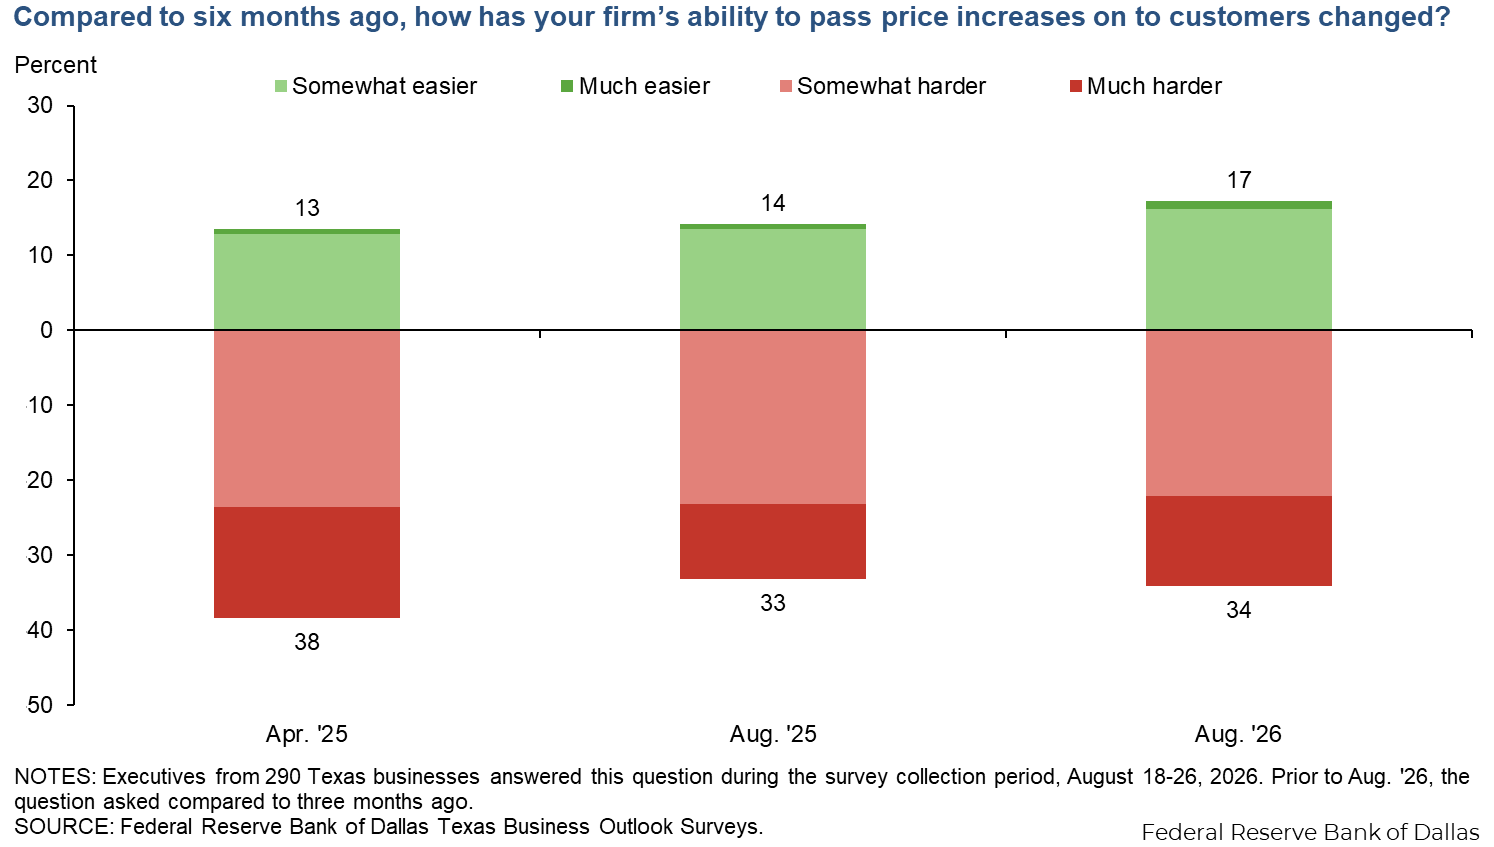
Pricing power has declined on net over the past six months as more firms said it’s gotten harder to pass price increases on to customers than said it’s gotten easier.
Margin compression continues on net, as the share of Texas businesses citing decreases in margins exceeds the share citing increases.
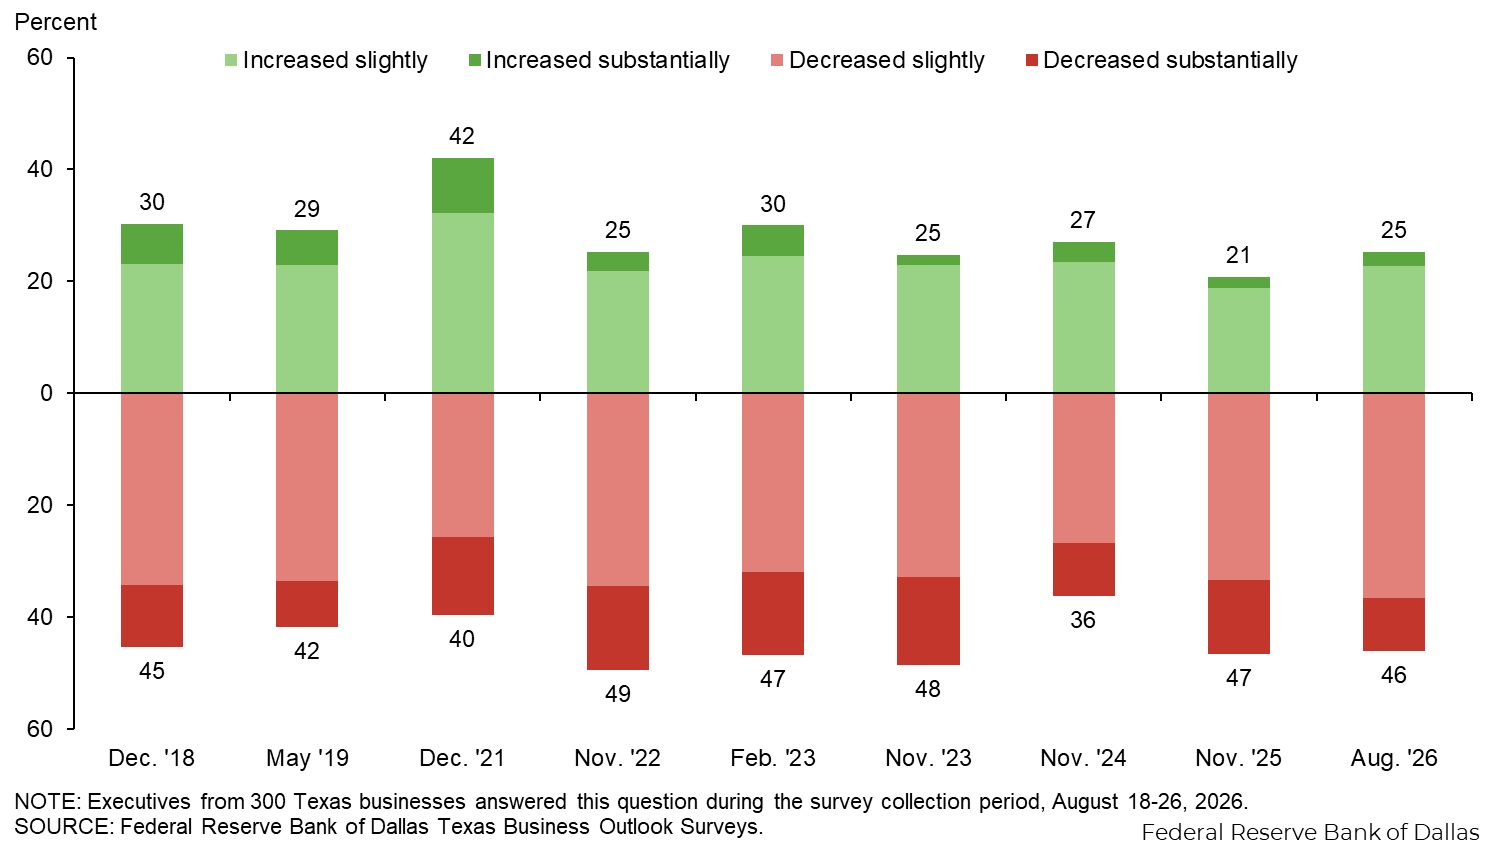
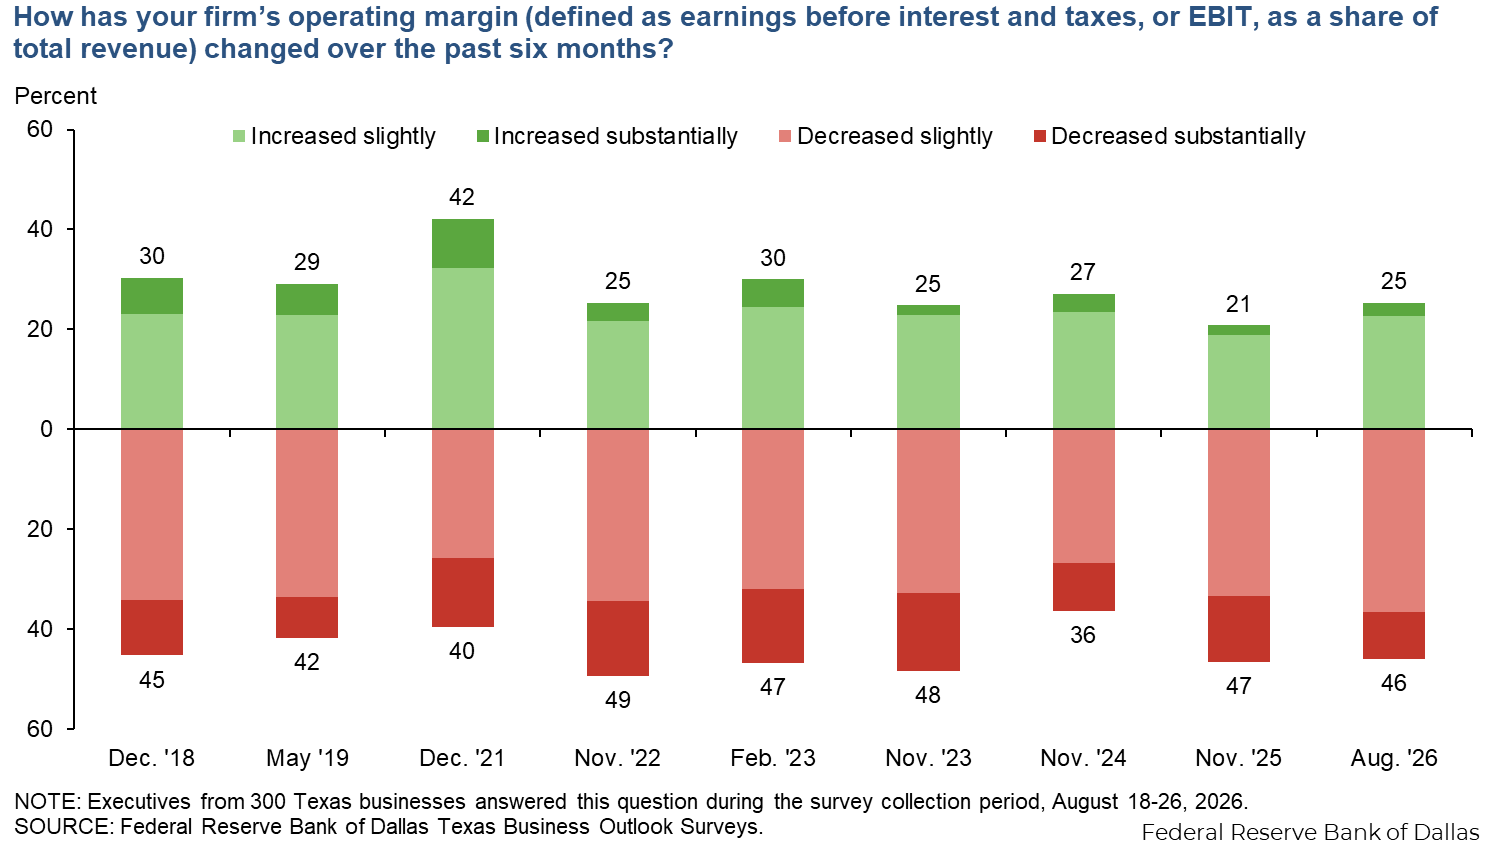
The following question was posed to those answering increased/decreased substantially to question 3.
Responses can be found on the individual survey Special Questions results pages, accessible on the Manufacturing and Service Sector tabs above.
Looking ahead, more Texas businesses expect increases than expect decreases in margins over the next six months. Expectations of margin growth were most widespread among manufacturers (45 percent).
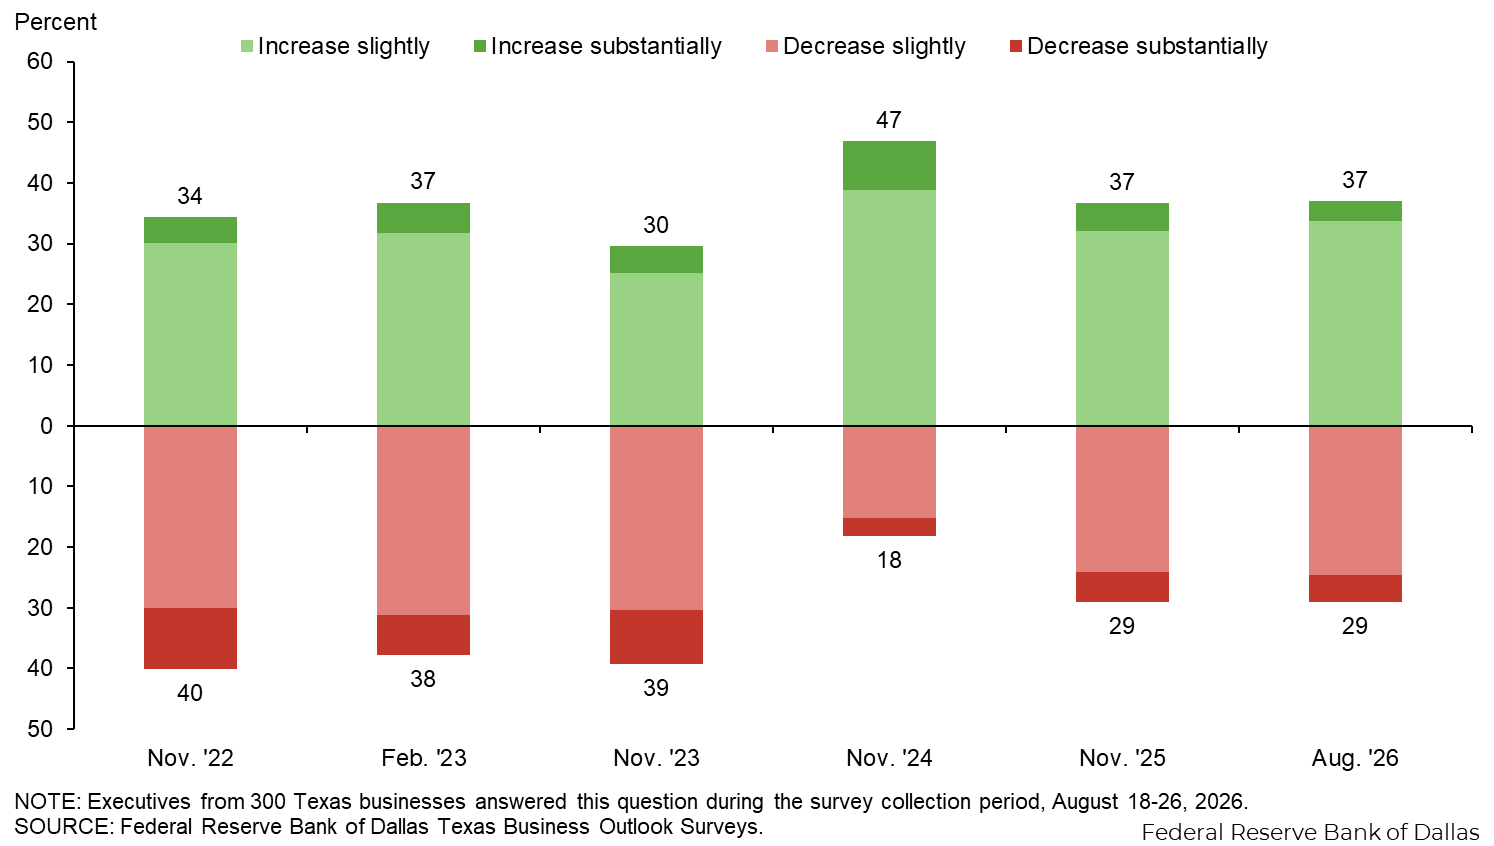
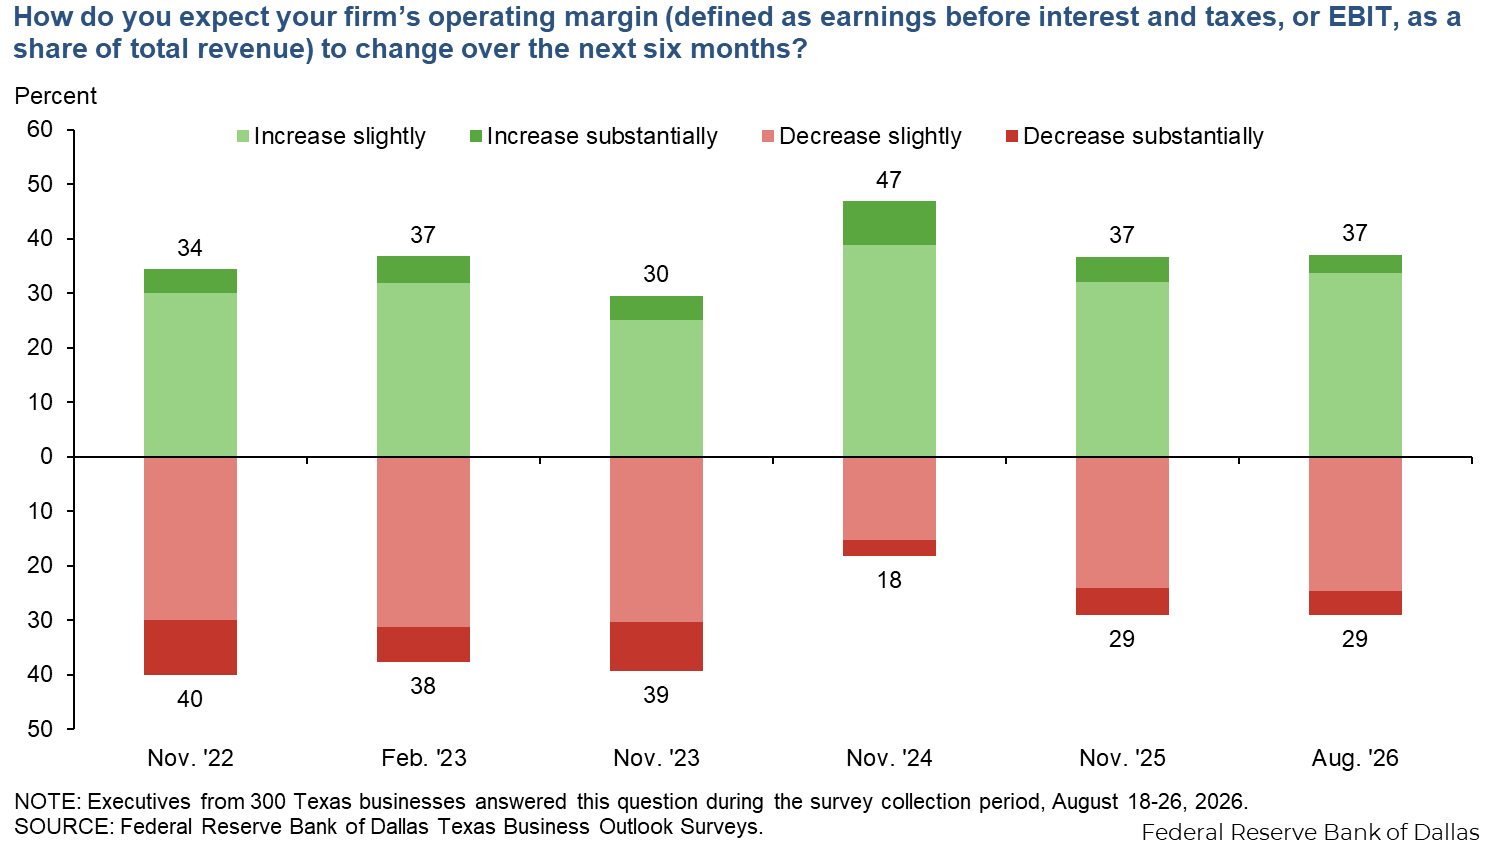
Survey respondents were given the opportunity to also provide comments, which can be found in the Comments tab above.
Texas Manufacturing Outlook Survey
Data were collected August 18–26, and 68 Texas manufacturers responded to the survey.
| Feb. '23 (percent) |
Feb. '24 (percent) |
Aug. '24 (percent) |
Feb. '25 (percent) |
Aug. '25 (percent) |
Feb. '26 (percent) |
Aug. '26 (percent) |
|
| Increase substantially | 11.0 | 5.5 | 1.3 | 19.8 | 12.3 | 14.3 | 13.4 |
| Increase slightly | 30.0 | 46.2 | 53.8 | 43.0 | 37.0 | 42.9 | 38.8 |
| Remain the same | 28.0 | 23.1 | 20.0 | 15.1 | 29.6 | 26.0 | 28.4 |
| Decrease slightly | 17.0 | 17.6 | 22.5 | 18.6 | 16.0 | 14.3 | 14.9 |
| Decrease substantially | 14.0 | 7.7 | 2.5 | 3.5 | 4.9 | 2.6 | 4.5 |
NOTE: 67 responses.
| Apr. '25 (percent) |
Aug. '25 (percent) |
Aug. '26 (percent) |
|
| Much easier | 1.3 | 1.3 | 3.0 |
| Somewhat easier | 22.5 | 16.5 | 19.7 |
| No change | 38.8 | 46.8 | 42.4 |
| Somewhat harder | 22.5 | 27.8 | 19.7 |
| Much harder | 15.0 | 7.6 | 15.2 |
NOTES: 66 responses. Prior to Aug. '26, the question asked compared to three months ago.
| May '19 (percent) |
Dec. '21 (percent) |
Nov. '22 (percent) |
Nov. '23 (percent |
Nov. '24 (percent |
Nov. '25 (percent |
Aug. '26 (percent) |
|
| Increased substantially | 11.4 | 4.6 | 5.3 | 2.3 | 4.8 | 1.5 | 4.5 |
| Increased slightly | 23.8 | 26.4 | 14.7 | 32.2 | 21.4 | 19.4 | 28.4 |
| Remained the same | 22.9 | 19.5 | 20.0 | 18.4 | 28.6 | 28.4 | 25.4 |
| Decreased slightly | 33.3 | 25.3 | 38.9 | 27.6 | 32.1 | 34.3 | 31.3 |
| Decreased substantially | 8.6 | 24.1 | 21.1 | 19.5 | 13.1 | 16.4 | 10.4 |
NOTE: 67 responses.
The following question was posed to those answering increased/decreased substantially to question 3.
- Tighter supply.
- Price flexibility.
- Product sales mix and price increases to customers.
- Increases in wages are not being offset by increases in prices for goods sold.
- Freight costs due to higher fuel costs. Raw materials have increased a little more than selling prices.
- Lack of work.
- Price and tariff increases. We got a significant tariff refund, so that may improve the numbers once they are calculated.
| Nov. '22 (percent) |
Feb. '23 (percent) |
Nov. '23 (percent) |
Nov. '24 (percent) |
Nov. '25 (percent) |
Aug. '26 (percent) |
|
| Increase substantially | 5.3 | 3.0 | 4.6 | 16.7 | 6.0 | 3.0 |
| Increase slightly | 32.6 | 37.0 | 24.1 | 35.7 | 35.8 | 41.8 |
| Remain the same | 20.0 | 21.0 | 28.7 | 35.7 | 31.3 | 31.3 |
| Decrease slightly | 28.4 | 31.0 | 28.7 | 10.7 | 19.4 | 17.9 |
| Decrease substantially | 13.7 | 8.0 | 13.8 | 1.2 | 7.5 | 6.0 |
NOTE: 67 responses.
Survey respondents were given the opportunity to also provide comments, which can be found in the Comments tab above.
Texas Service Sector Outlook Survey
Data were collected August 18–26, and 236 Texas business executives responded to the survey.
| Feb. '23 (percent) |
Feb. '24 (percent) |
Aug. '24 (percent) |
Feb. '25 (percent) |
Aug. '25 (percent) |
Feb. '26 (percent) |
Aug. '26 (percent) |
|
| Increase substantially | 7.0 | 4.5 | 3.5 | 7.2 | 4.5 | 6.4 | 5.6 |
| Increase slightly | 36.2 | 47.4 | 41.2 | 50.0 | 37.2 | 44.2 | 34.5 |
| Remain the same | 31.2 | 29.3 | 33.3 | 29.2 | 37.2 | 34.3 | 43.5 |
| Decrease slightly | 21.6 | 16.9 | 19.2 | 11.0 | 16.6 | 13.7 | 13.8 |
| Decrease substantially | 4.0 | 1.9 | 2.7 | 2.5 | 4.5 | 1.3 | 2.6 |
NOTE: 232 responses.
| Apr. '25 (percent) |
Aug. '25 (percent) |
Aug. '26 (percent) |
|
| Much easier | 0.4 | 0.4 | 0.4 |
| Somewhat easier | 9.8 | 12.5 | 15.2 |
| No change | 51.2 | 54.7 | 50.4 |
| Somewhat harder | 24.0 | 21.6 | 22.8 |
| Much harder | 14.6 | 10.8 | 11.2 |
NOTES: 224 responses. Prior to Aug. '26, the question asked compared to three months ago.
| May '19 (percent) |
Dec. '21 (percent) |
Nov. '22 (percent) |
Nov. '23 (percent |
Nov. '24 (percent |
Nov. '25 (percent |
Aug. '26 (percent) |
|
| Increased substantially | 4.0 | 11.9 | 3.0 | 1.8 | 3.2 | 2.1 | 2.1 |
| Increased slightly | 22.5 | 34.3 | 24.0 | 19.9 | 24.2 | 18.6 | 21.0 |
| Remained the same | 31.7 | 17.8 | 27.0 | 29.4 | 39.3 | 33.9 | 29.6 |
| Decreased slightly | 33.7 | 25.8 | 33.0 | 34.6 | 25.0 | 33.1 | 38.2 |
| Decreased substantially | 8.0 | 10.2 | 13.0 | 14.3 | 8.3 | 12.3 | 9.0 |
NOTE: 233 responses.
The following question was posed to those answering increased/decreased substantially to question 3.
- Expense control.
- More activity and sales.
- Steady improvement in contracted projects while holding staff size constant resulted in increased margin. We had the capacity to handle the additional workload without hiring.
- Productivity improvements.
- Inflated prices and high interest rates.
- New vehicle margins have declined considerably.
- Lower gross margins on sales, increased expenses.
- Fuel prices.
- Gas prices.
- Lack of additional revenue.
- Cost increases and decreased demand.
- We got very busy and needed to add manpower. The people we have been able to find have not been as productive as our core employees, and that lack of productivity has led to working more overtime and reduced margins.
- Client attrition.
- Interest rates.
- High wages.
- Less demand for executive search, contingency hiring and interim contractors. Less demand, less opportunity for revenue, expenses higher (software providers raising prices).
- Cost of everything, limited ability to pass on the costs to customers.
- Fixed costs have gone up while sales have gone down.
- Inflation. The price of labor and goods continues to increase.
- Declining sales and increased expenditures.
| Nov. '22 (percent) |
Feb. '23 (percent) |
Nov. '23 (percent) |
Nov. '24 (percent) |
Nov. '25 (percent) |
Aug. '26 (percent) |
|
| Increase substantially | 4.0 | 5.7 | 4.4 | 5.2 | 4.2 | 3.4 |
| Increase slightly | 29.2 | 30.0 | 25.4 | 39.8 | 30.9 | 31.3 |
| Remain the same | 27.2 | 27.0 | 32.0 | 34.7 | 35.2 | 34.8 |
| Decrease slightly | 30.6 | 31.3 | 30.9 | 16.7 | 25.4 | 26.6 |
| Decrease substantially | 9.0 | 6.0 | 7.4 | 3.6 | 4.2 | 3.9 |
NOTE: 233 responses.
Survey respondents were given the opportunity to also provide comments, which can be found in the Comments tab above.
Questions regarding the Texas Business Outlook Surveys can be addressed to Emily Kerr at emily.kerr@dal.frb.org.
Sign up for our email alert to be automatically notified as soon as the latest surveys are released on the web.
Special Questions Comments
Survey participants are given the opportunity to submit comments. Some comments have been edited for grammar and clarity.