Special Questions

Special Questions
For this month’s survey, Texas business executives were asked supplemental questions on wages, prices and outlook concerns. Results below include responses from participants from both the Texas Manufacturing Outlook Survey and Texas Service Sector Outlook Survey.
Texas Business Outlook Surveys
Data were collected Sept. 15–23, and 282 Texas business executives responded to the surveys.
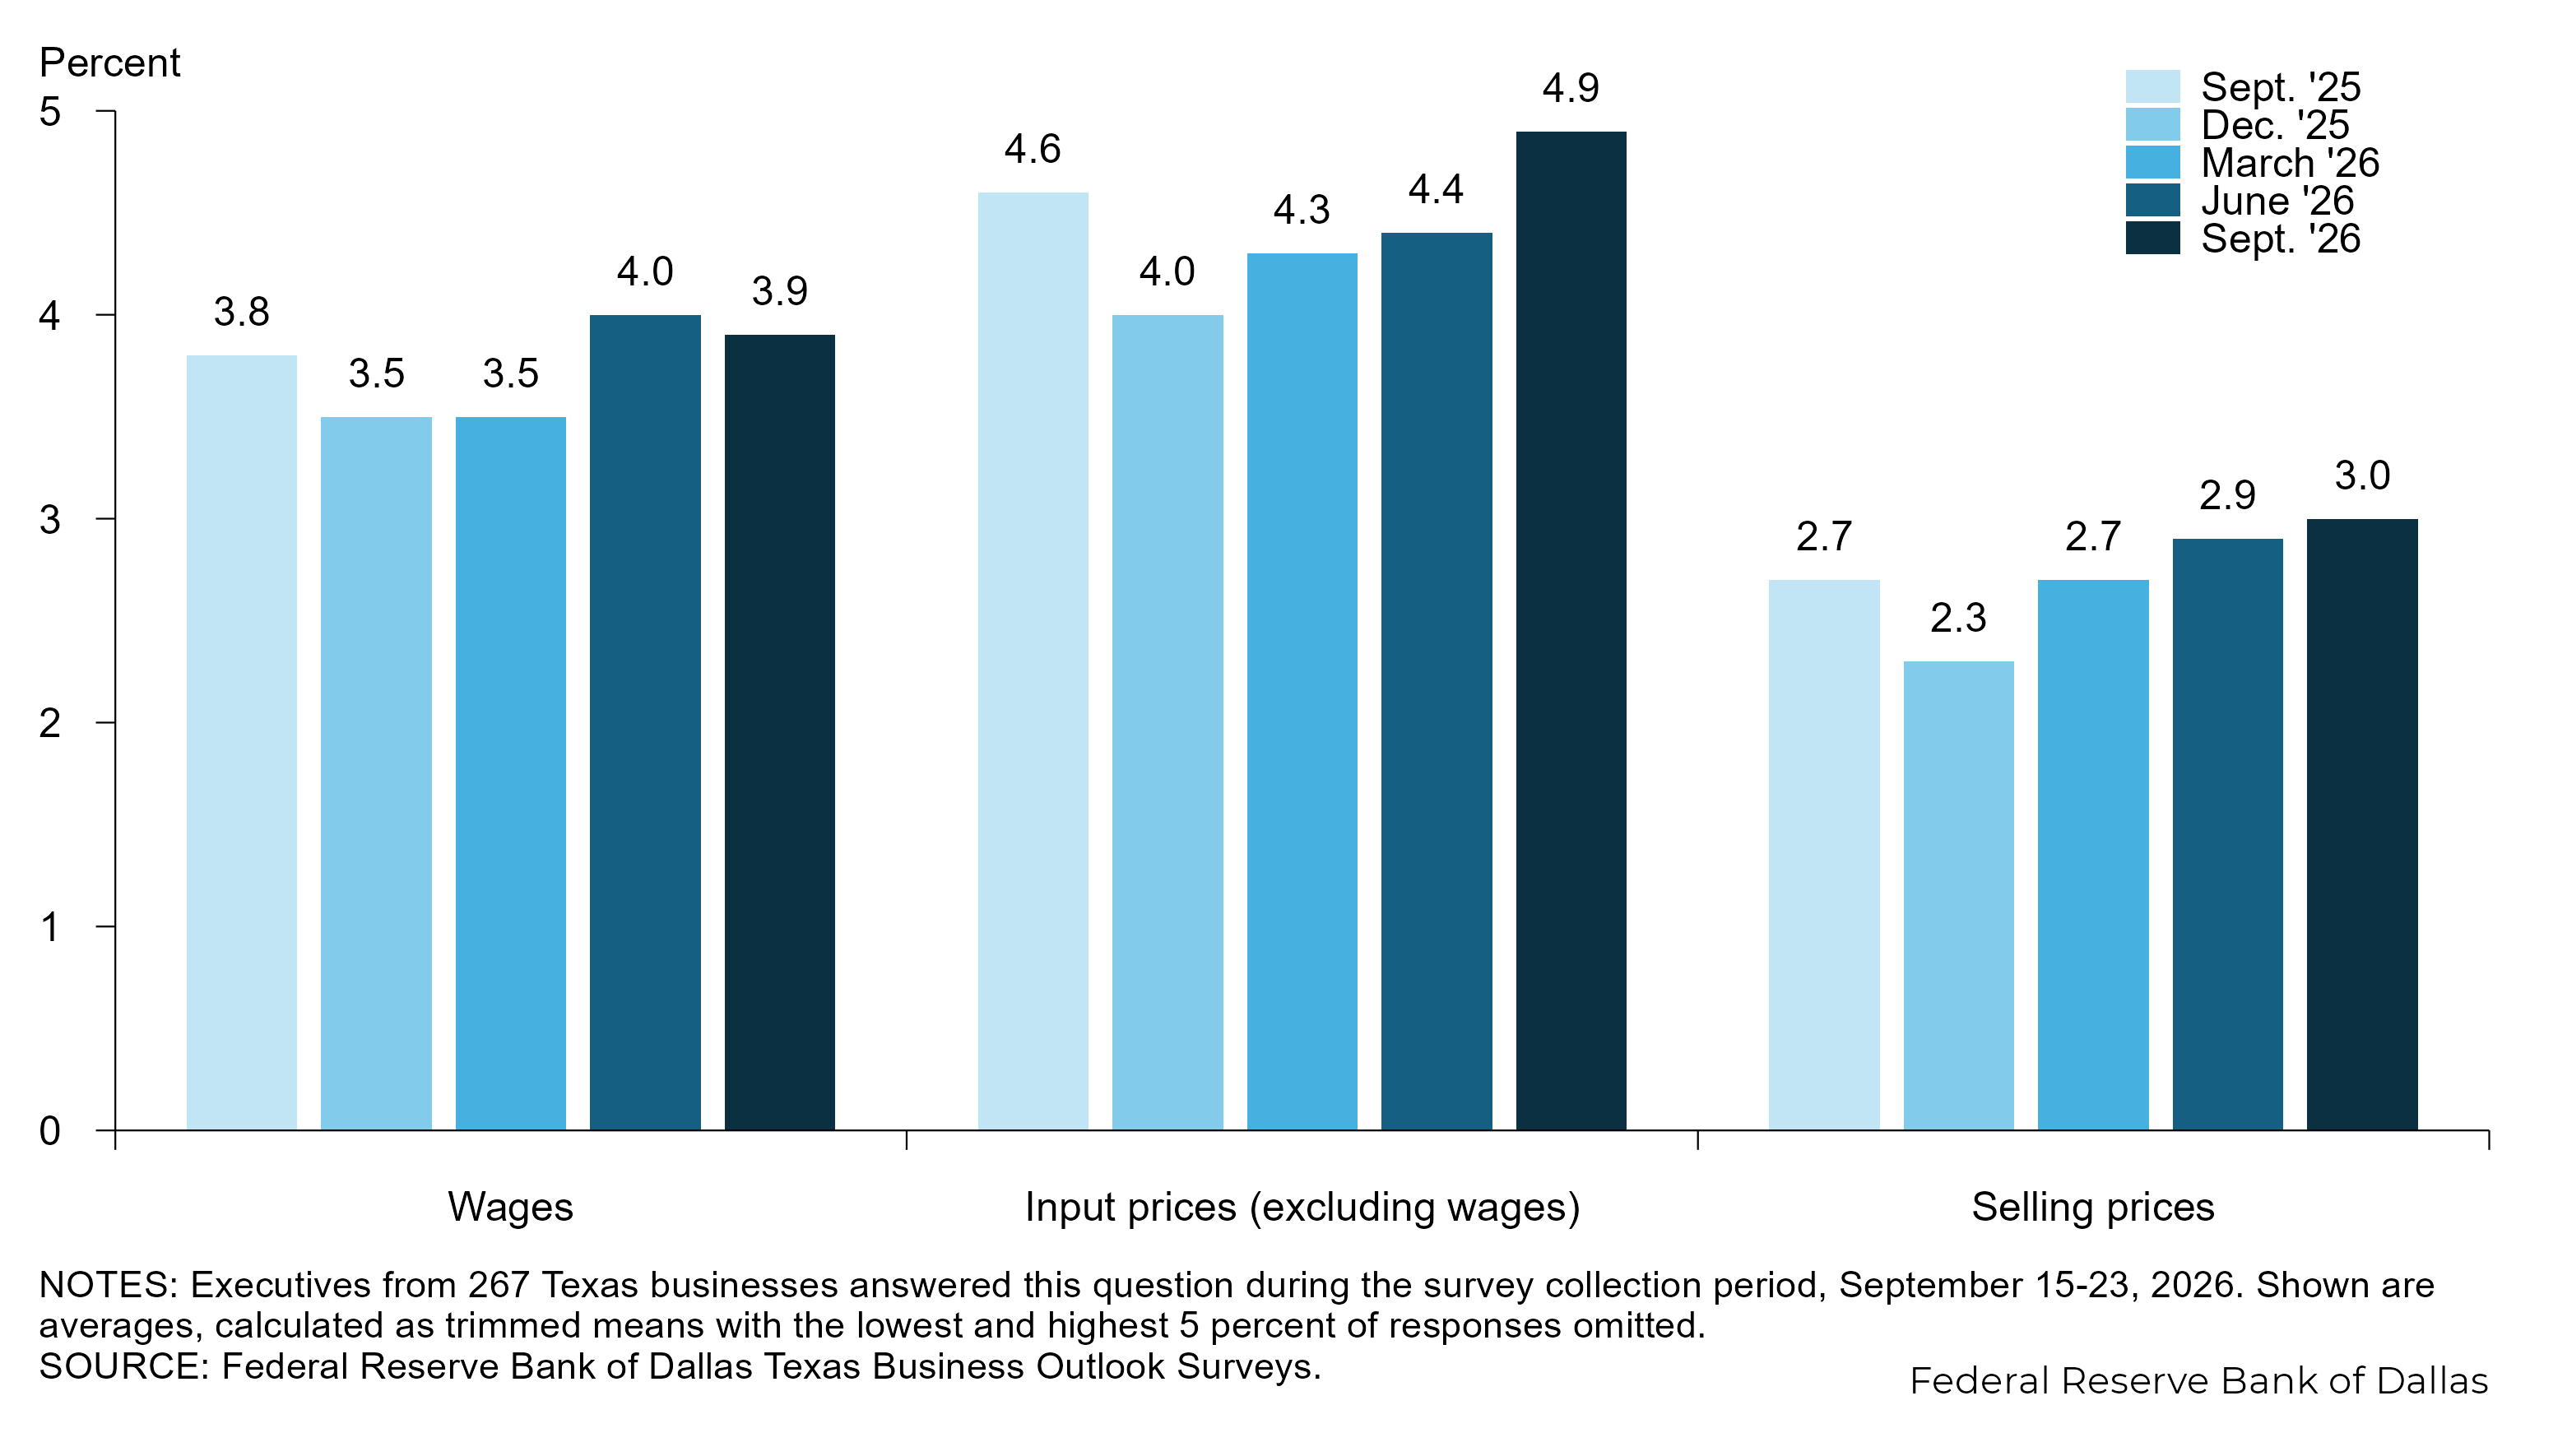
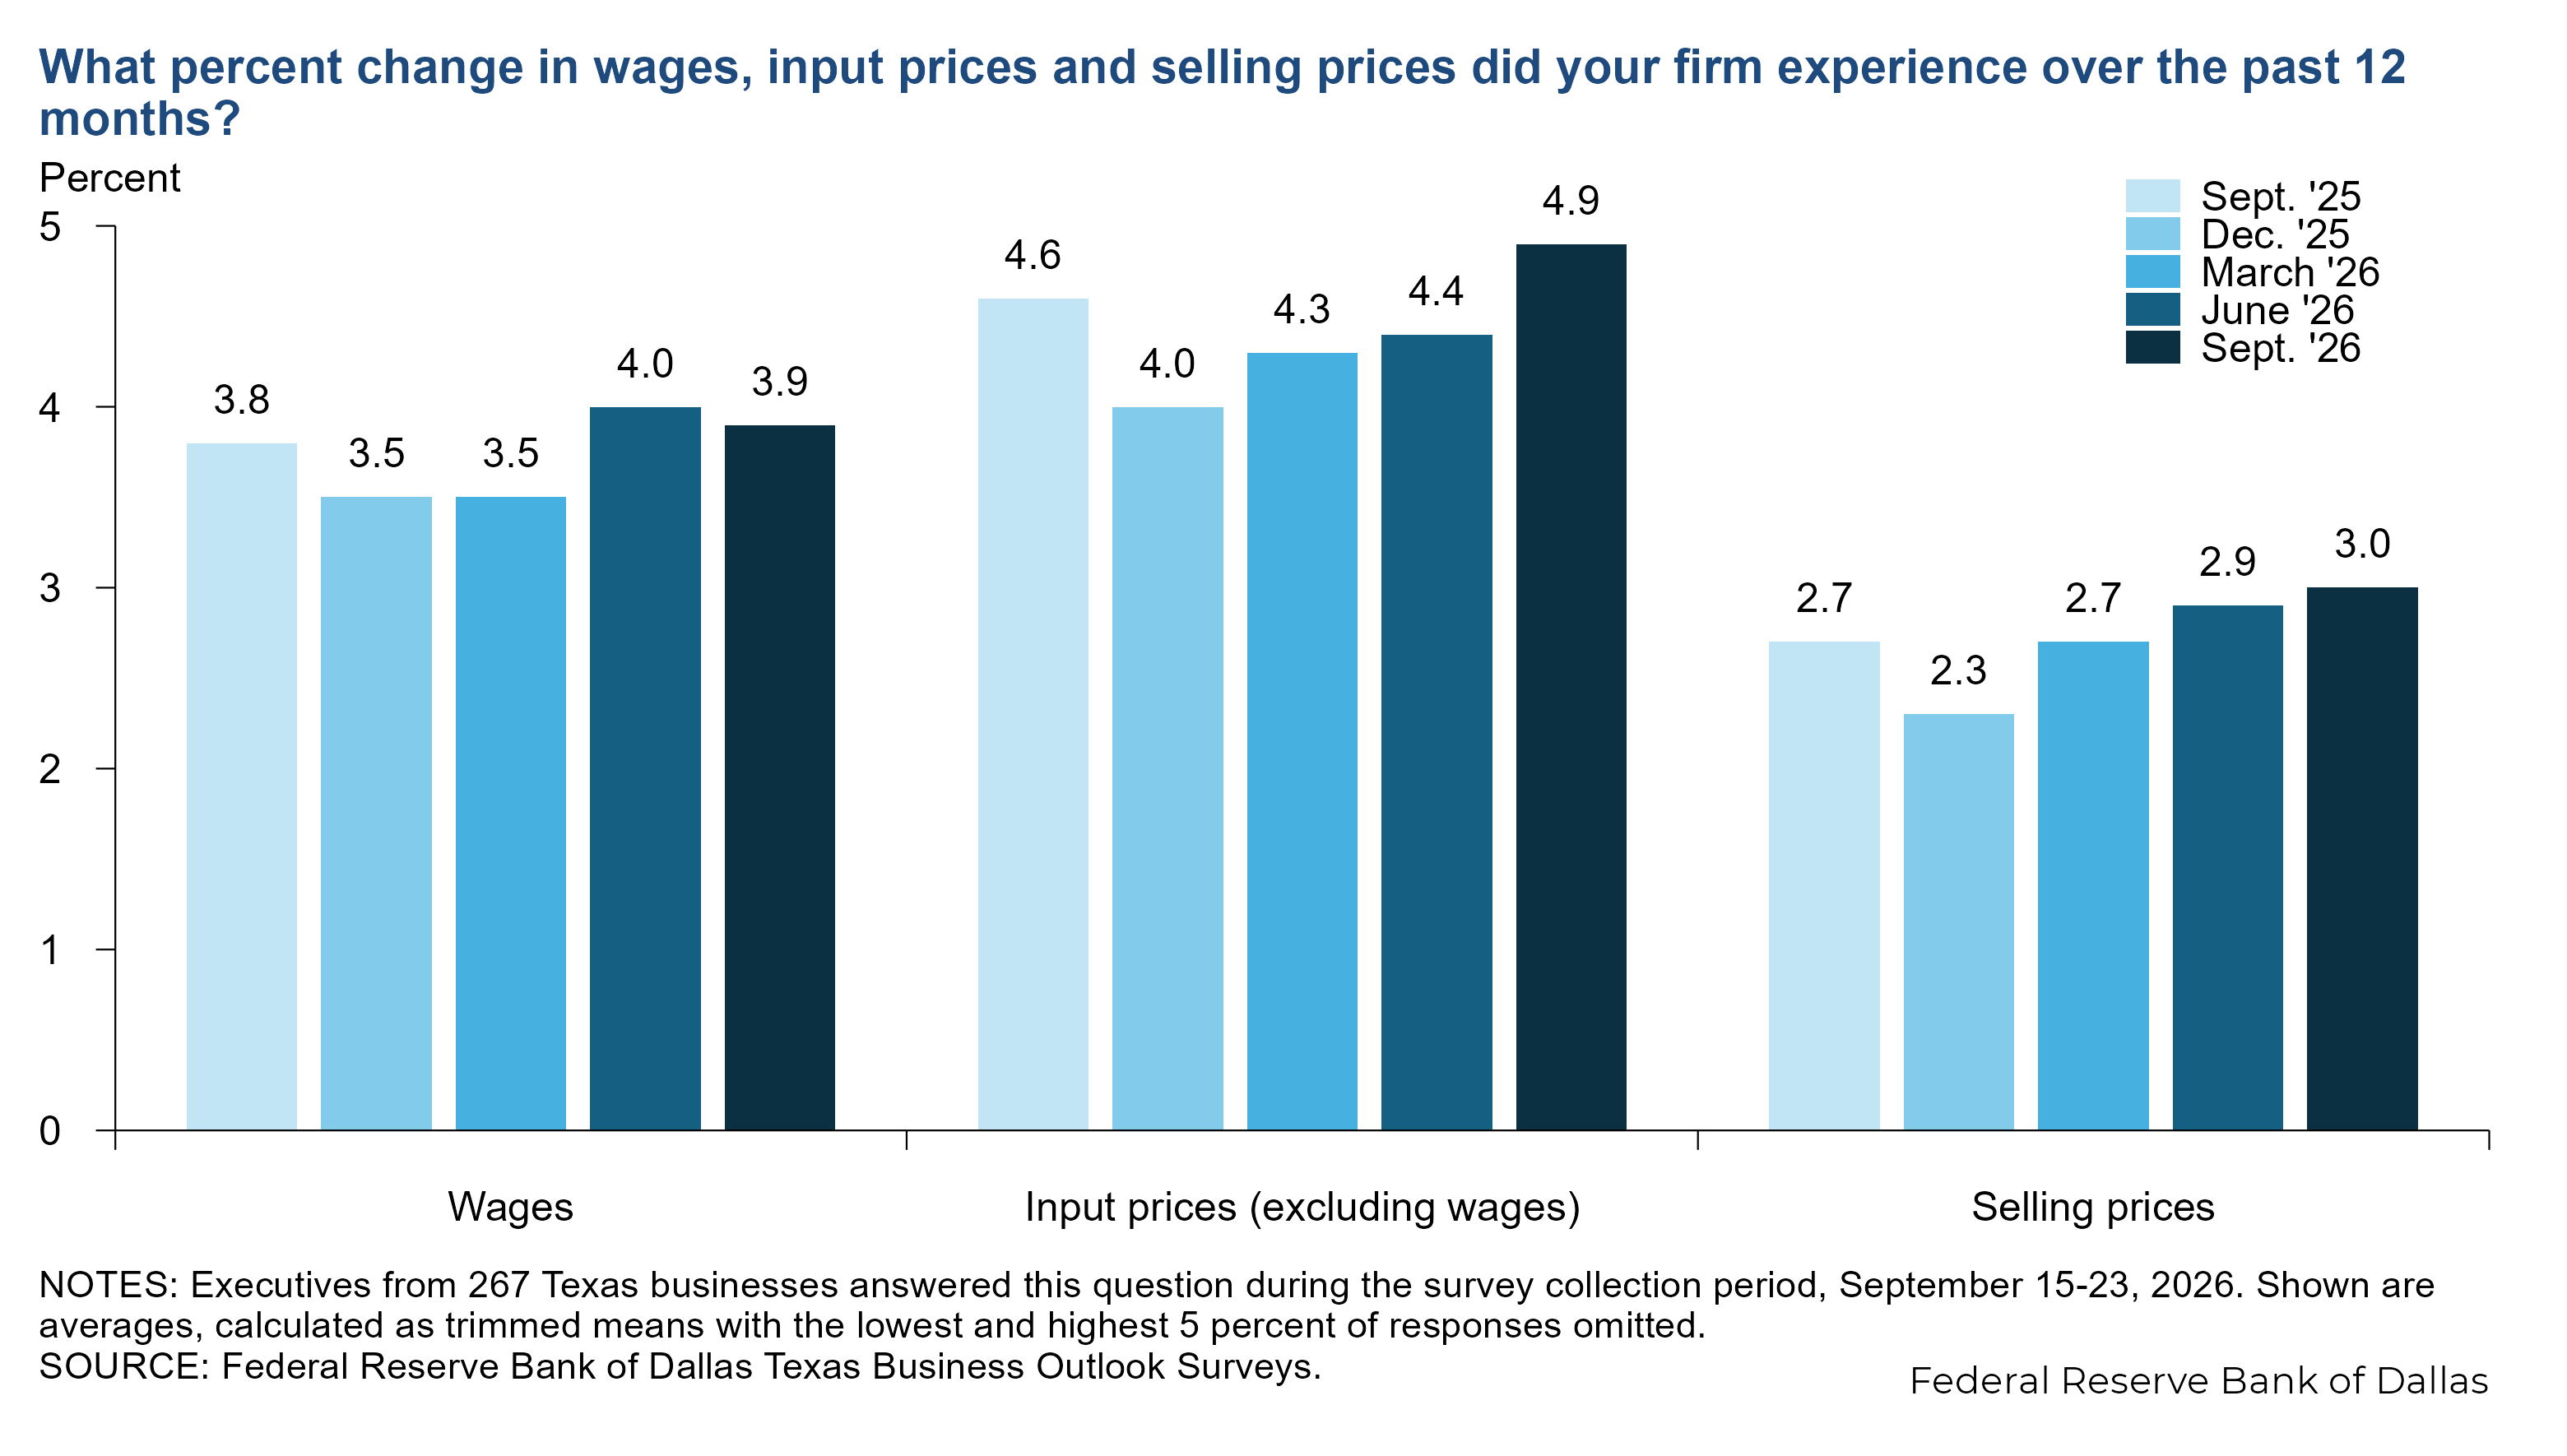
Input price growth has accelerated, while wage and selling price growth was largely unchanged. Texas firms surveyed reported input price growth of 4.9 percent over the past 12 months, on average, up markedly from 4.4 percent in June and representing the strongest pace in more than two years. Wage growth averaged 3.9 percent and selling price growth averaged 3.0 percent overall, similar to what was reported in June. By sector, selling price growth actually picked up in services but was offset by slower price growth in manufacturing.
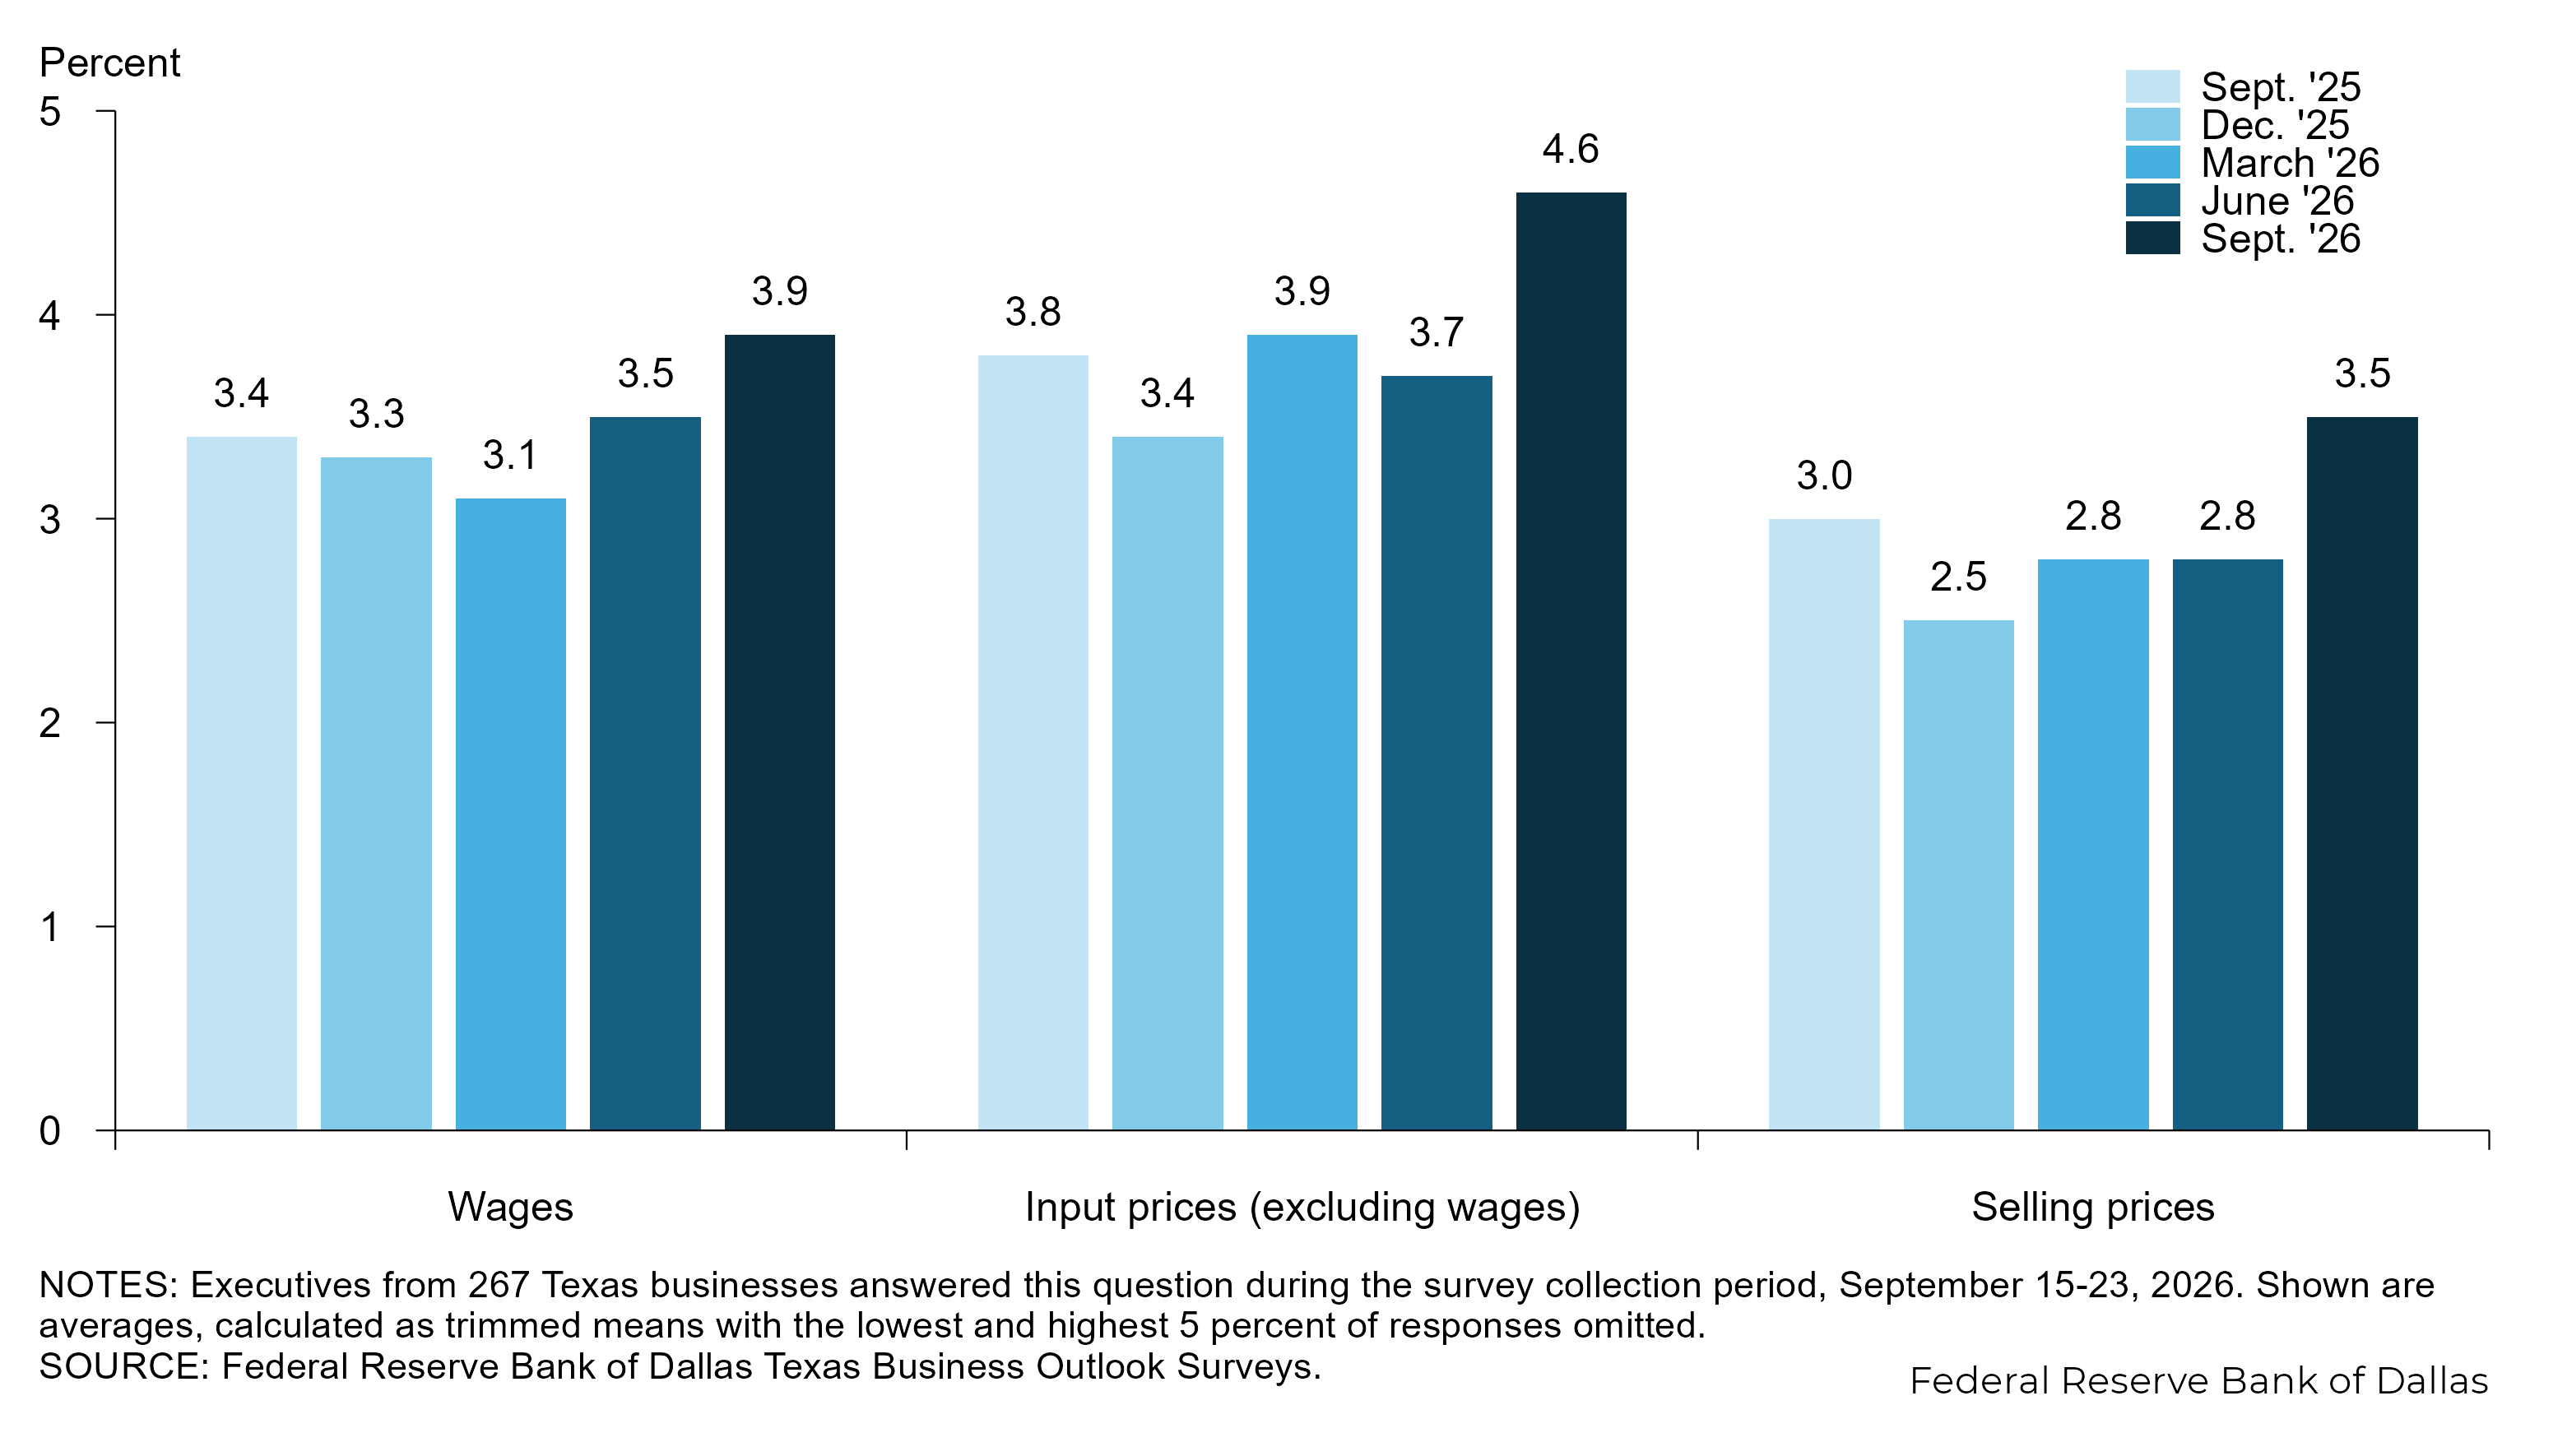
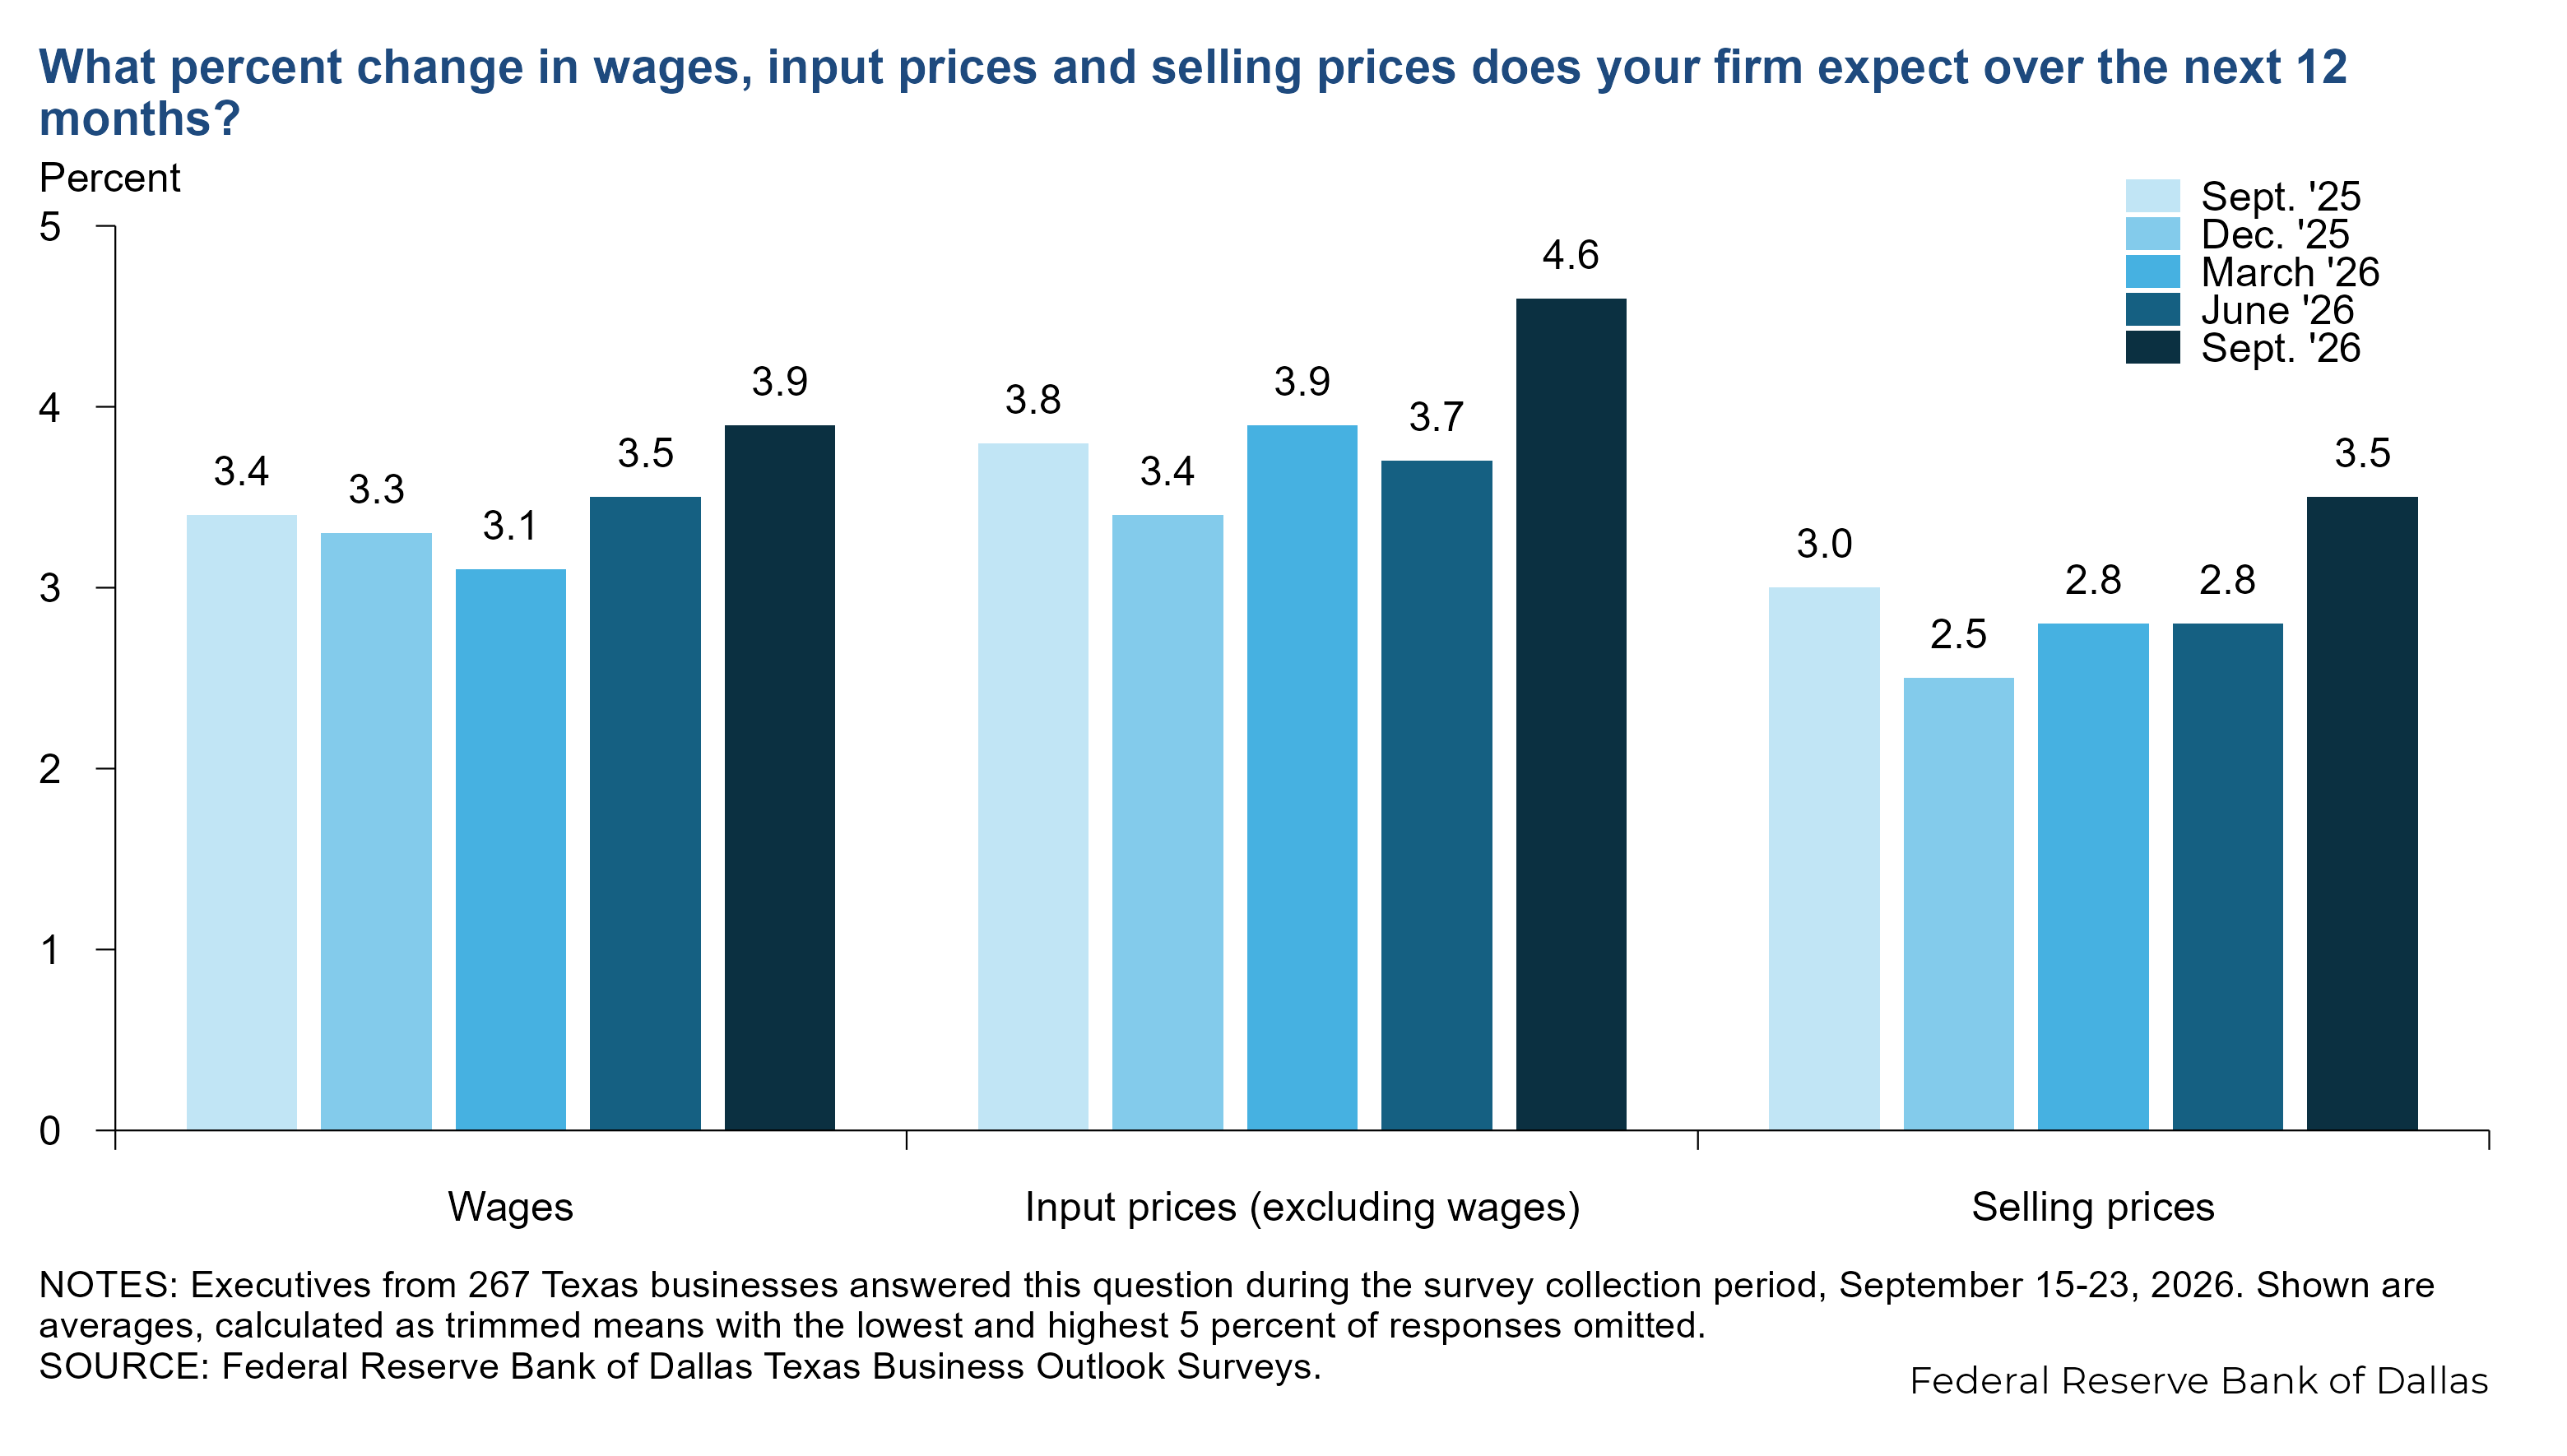
Wage and price growth expectations are up across the board. Texas firms surveyed expect wages to increase 3.9 percent over the next 12 months, on average. They expect input prices to increase 4.6 percent and selling prices to increase 3.5 percent—the strongest pace since December 2023.
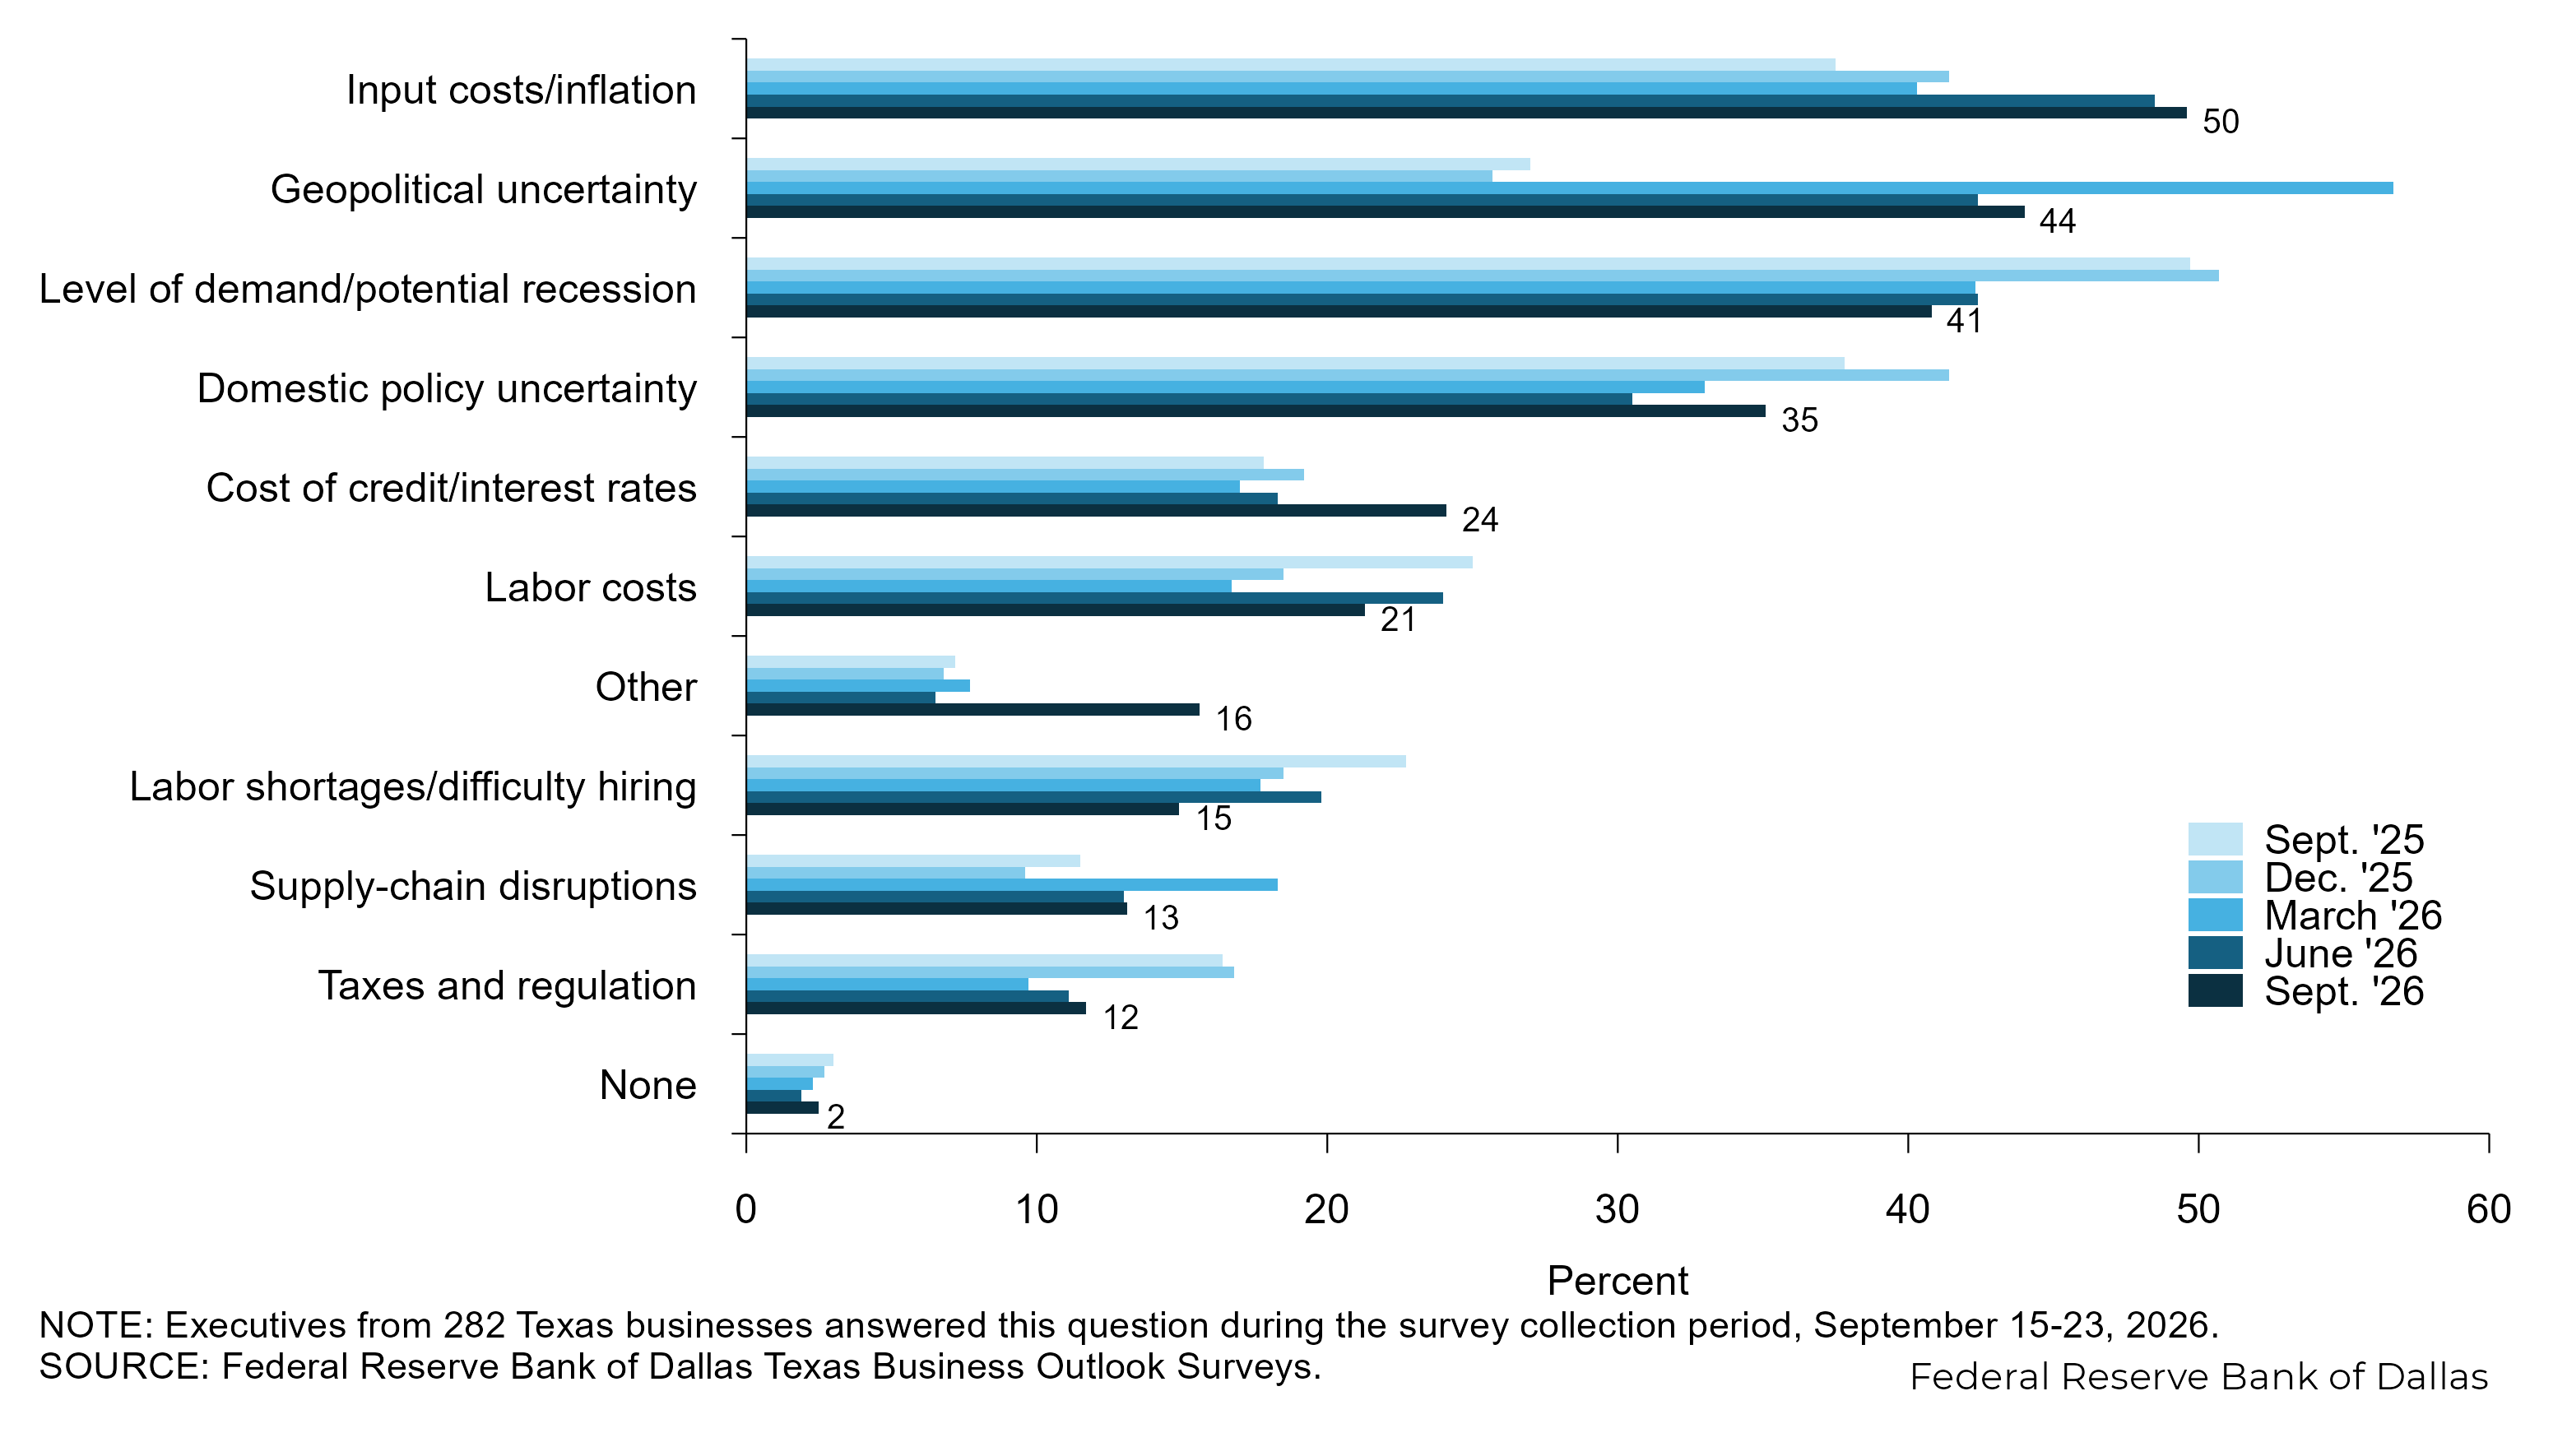
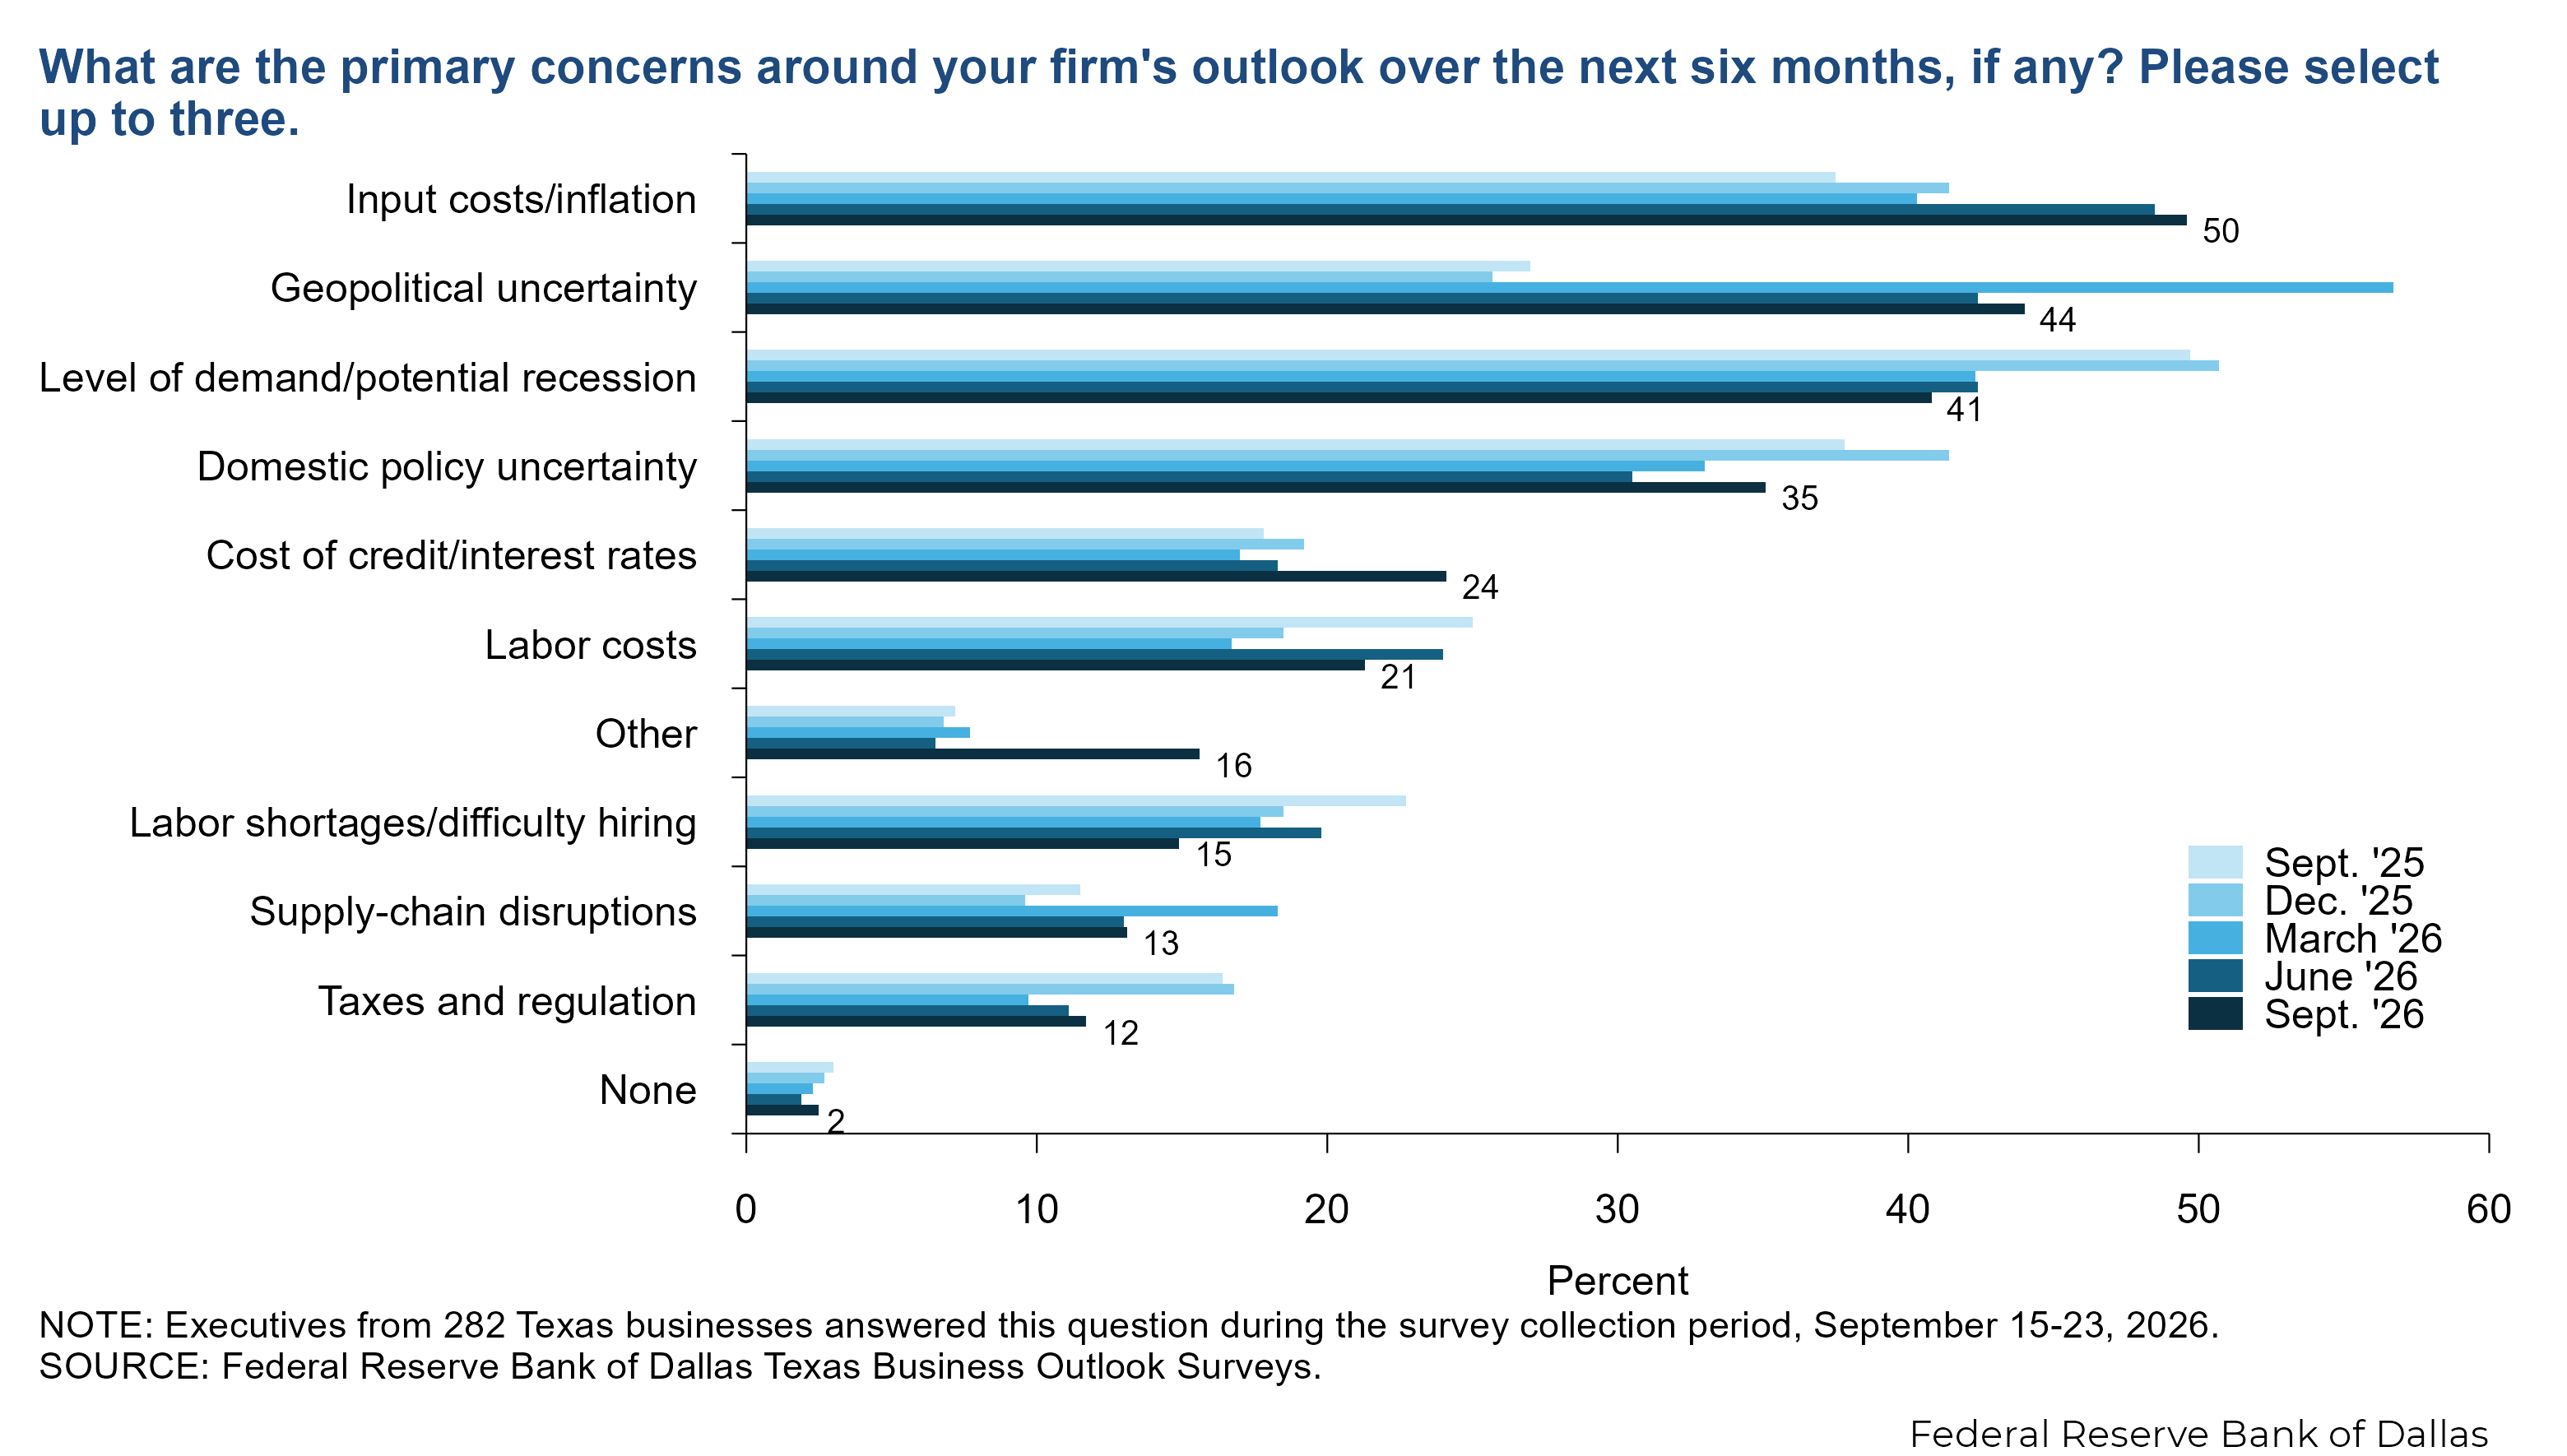
Inflation remained the most widely cited outlook concern, followed by geopolitical uncertainty and the level of demand. The share of firms citing interest rates and domestic policy uncertainty rose in September, while the share citing labor shortages fell.
Survey respondents were given the opportunity to also provide comments, which can be found in the Comments tab above.
Texas Manufacturing Outlook Survey
Data were collected September 15–23, and 60 Texas manufacturers responded to the survey.
| Dec. '25 (percent) |
Mar. '26 (percent) |
Jun. '26 (percent) |
Sep. '26 (percent) |
|||||
| Past 12 months | Next 12 months | Past 12 months | Next 12 months | Past 12 months | Next 12 months | Past 12 months | Next 12 months | |
| Wages | 3.4 | 3.3 | 3.9 | 3.4 | 4.8 | 3.7 | 4.2 | 3.7 |
| Input prices (excluding wages) | 5.5 | 4.1 | 6.0 | 4.5 | 6.1 | 3.8 | 5.8 | 4.5 |
| Selling prices | 2.7 | 2.7 | 3.9 | 3.7 | 4.8 | 3.8 | 4.4 | 4.4 |
NOTES: 56 responses. Shown are averages, calculated as trimmed means with the lowest and highest 5 percent of responses omitted.
| Mar. '25 (percent) |
Jun. '25 (percent) |
Sep. '25 (percent) |
Dec. '25 (percent) |
Mar. '26 (percent) |
Jun. '26 (percent) |
Sep. '26 (percent) |
|
| Input costs/inflation | 43.8 | 45.2 | 45.5 | 46.4 | 44.0 | 52.5 | 60.0 |
| Geopolitical uncertainty | 30.0 | 43.8 | 31.8 | 30.4 | 49.3 | 49.2 | 36.7 |
| Level of demand/potential recession | 50.0 | 47.9 | 50.0 | 53.6 | 49.3 | 37.3 | 35.0 |
| Domestic policy uncertainty | 40.0 | 27.4 | 40.9 | 39.1 | 29.3 | 27.1 | 33.3 |
| Supply-chain disruptions | 17.5 | 30.1 | 19.7 | 17.4 | 32.0 | 30.5 | 25.0 |
| Labor shortages/difficulty hiring | 18.8 | 17.8 | 22.7 | 18.8 | 21.3 | 23.7 | 20.0 |
| Labor costs | 15.0 | 13.7 | 27.3 | 17.4 | 16.0 | 27.1 | 20.0 |
| Cost of credit/interest rates | 10.0 | 13.7 | 10.6 | 13.0 | 13.3 | 13.6 | 16.7 |
| Taxes and regulation | 23.8 | 23.3 | 12.1 | 11.6 | 9.3 | 6.8 | 10.0 |
| Other | 15.0 | 11.0 | 7.6 | 7.2 | 4.0 | 5.1 | 10.0 |
| None | 2.5 | 0.0 | 1.5 | 2.9 | 2.7 | 0.0 | 1.7 |
NOTE: 60 responses.
Survey respondents were given the opportunity to also provide comments, which can be found in the Comments tab above.
Texas Service Sector Outlook Survey
Data were collected September 15–23, and 222 Texas business executives responded to the survey.
| Dec. '25 (percent) |
Mar. '26 (percent) |
Jun. '26 (percent) |
Sep. '26 (percent) |
|||||
| Past 12 months | Next 12 months | Past 12 months | Next 12 months | Past 12 months | Next 12 months | Past 12 months | Next 12 months | |
| Wages | 3.6 | 3.3 | 3.4 | 3.0 | 3.8 | 3.5 | 3.8 | 4.0 |
| Input prices (excluding wages) | 3.7 | 3.1 | 3.7 | 3.7 | 3.9 | 3.8 | 4.6 | 4.7 |
| Selling prices | 2.2 | 2.4 | 2.3 | 2.5 | 2.4 | 2.5 | 2.7 | 3.4 |
NOTES: 211 responses. Shown are averages, calculated as trimmed means with the lowest and highest 5 percent of responses omitted.
| Mar. '25 (percent) |
Jun. '25 (percent) |
Sep. '25 (percent) |
Dec. '25 (percent) |
Mar. '26 (percent) |
Jun. '26 (percent) |
Sep. '26 (percent) |
|
| Input costs/inflation | 33.1 | 29.2 | 35.3 | 39.9 | 39.1 | 47.3 | 46.8 |
| Geopolitical uncertainty | 26.3 | 40.4 | 25.6 | 24.2 | 59.1 | 40.4 | 45.9 |
| Level of demand/potential recession | 50.0 | 44.6 | 49.6 | 49.8 | 40.0 | 43.8 | 42.3 |
| Domestic policy uncertainty | 46.2 | 39.6 | 37.0 | 42.2 | 34.2 | 31.5 | 35.6 |
| Cost of credit/interest rates | 19.9 | 25.4 | 19.7 | 21.1 | 18.2 | 19.7 | 26.1 |
| Labor costs | 19.1 | 19.6 | 24.4 | 18.8 | 16.9 | 23.2 | 21.6 |
| Labor shortages/difficulty hiring | 18.2 | 19.2 | 22.7 | 18.4 | 16.4 | 18.7 | 13.5 |
| Taxes and regulation | 19.5 | 18.3 | 17.6 | 18.4 | 9.8 | 12.3 | 12.2 |
| Supply-chain disruptions | 15.3 | 12.5 | 9.2 | 7.2 | 13.8 | 7.9 | 9.9 |
| Other | 6.8 | 7.1 | 7.1 | 6.7 | 8.9 | 6.9 | 17.1 |
| None | 1.7 | 1.7 | 3.4 | 2.7 | 2.2 | 2.5 | 2.7 |
NOTE: 222 responses.
Survey respondents were given the opportunity to also provide comments, which can be found in the Comments tab above.
Questions regarding the Texas Business Outlook Surveys can be addressed to Emily Kerr at emily.kerr@dal.frb.org.
Sign up for our email alert to be automatically notified as soon as the latest surveys are released on the web.
Special Questions Comments
Survey participants are given the opportunity to submit comments. Some comments have been edited for grammar and clarity.