
Spotlight: Lower U.S. Crude Oil Production Decreases Output, Raises Price of Natural Gas
Natural gas futures plummeted to a historic low in June 2020 only to rebound by late October, with prices more than doubling to $3 per million British thermal units (MMBtu). The main reason for the rebound: a decline in natural gas production from oil wells.
The natural gas market is largely a domestic one. So, unlike oil, which is more of a global commodity, gas prices track domestic supply and demand. With the shale boom, rising gas production in the 2010s depressed natural gas prices to less than half their prerecession levels of the mid-2000s.
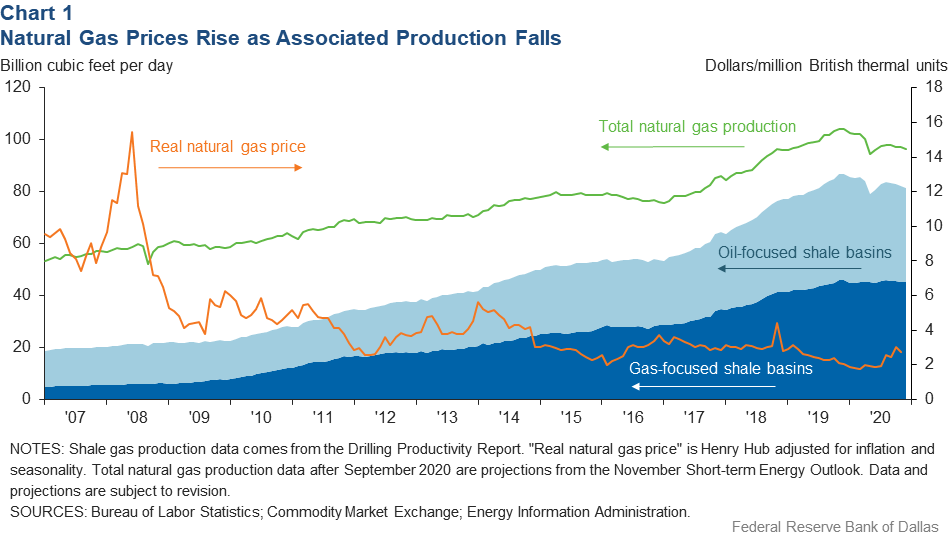
Total natural gas production reached 104.3 billion cubic feet per day (bcf/d) in December 2019, up from nearly 60 bcf/d a decade earlier (Chart 1). This rise came from wells intended to mainly produce gas and from those targeting oil but which—like bubbles of carbonation released when opening a bottle of soda—produce gas.
Surging production the past decade drove a boom in pipeline gas exports to Mexico and Canada and increased exports of liquefied natural gas, which peaked near 7.9 bcf/d in March 2020. Additionally, natural gas production substantially lowered energy and materials costs for the petrochemicals industry and other domestic users. It also helped drive down U.S. carbon dioxide emissions by displacing coal from the mix of fuels used to generate electricity.
The Henry Hub gas price, considered the U.S. benchmark, averaged a meager $2.56 per MMBtu in 2019 as new supplies swamped demand. A mild 2019–20 winter left domestic natural gas inventories near a three-year high in February 2020.
A sharp economic contraction and diminished global demand for transportation followed the onset of the COVID-19 pandemic in March 2020, as governments ordered lockdowns and consumers engaged in social distancing. Consumption of gasoline and other energy liquids fell 17 percent in the second quarter from year-end 2019 levels.
Henry Hub natural gas reached an inflation-adjusted historic low average price of $1.60 per MMBtu in June, as natural gas exports and consumption by power and industrial sectors declined. U.S. oil producers were even forced to shut in crude production as spare storage capacity for unwanted crude evaporated. The number of rigs drilling for oil contracted more than 70 percent from March to June, and the number of active frac crews—teams that bring drilled wells into production—fell 87 percent. Natural gas output fell in tandem.
Output began to return in June when shut-in wells were turned back on. That process was largely completed by late summer, but declining productivity from older wells (shale output can drop by more than 70 percent in a well’s first year) kept U.S. oil and gas production below prepandemic levels. Gas from oil-focused shale basins fell from 40.6 bcf/d before the pandemic to 37.4 bcf/d in October, roughly 64 percent of the overall decline in U.S. gas. In contrast, production from gas-focused shale basins increased slightly.
The Energy Information Administration and most industry analysts project U.S. oil production to be little changed or decline slightly through the end of 2021. Natural gas production from oil wells will likely follow.
With the winter heating season approaching and expected lower U.S. gas production, natural gas futures rose above $3 per MMBtu at the end of October—still far below preshale levels. Subsequent gas price drops in early December—following upticks in oil well completions and oil price futures—signal that U.S. natural gas fortunes are inversely tied to expected shale oil output for now.
About the Authors

Jesse Thompson
Thompson is a senior business economist in the Houston Branch of the Federal Reserve Bank of Dallas.
Camila Holm
Holm is a research analyst in the Research Department at the Federal Reserve Bank of Dallas.
Southwest Economy is published quarterly by the Federal Reserve Bank of Dallas. The views expressed are those of the authors and should not be attributed to the Federal Reserve Bank of Dallas or the Federal Reserve System.
Articles may be reprinted on the condition that the source is credited to the Federal Reserve Bank of Dallas.
Full publication is available online: https://www.dallasfed.org/research/swe/2020/swe2004.