Keeping bank depositors still comes down to rates
How does a bank attract deposits and remain competitive when rates fluctuate and depositors are increasingly mobile? Managing the bank deposit franchise is a cornerstone of bank profitability and stability, and doing so has been challenging during the rapid rise in interest rates in 2022 and the subsequent regional banking turmoil. Banks’ levels of deposit funding appear to still be driven by banks’ loan portfolios. Depositors are mainly seeking better rates, regardless of measures of bank-specific risk such as a bank’s unrealized losses on securities.
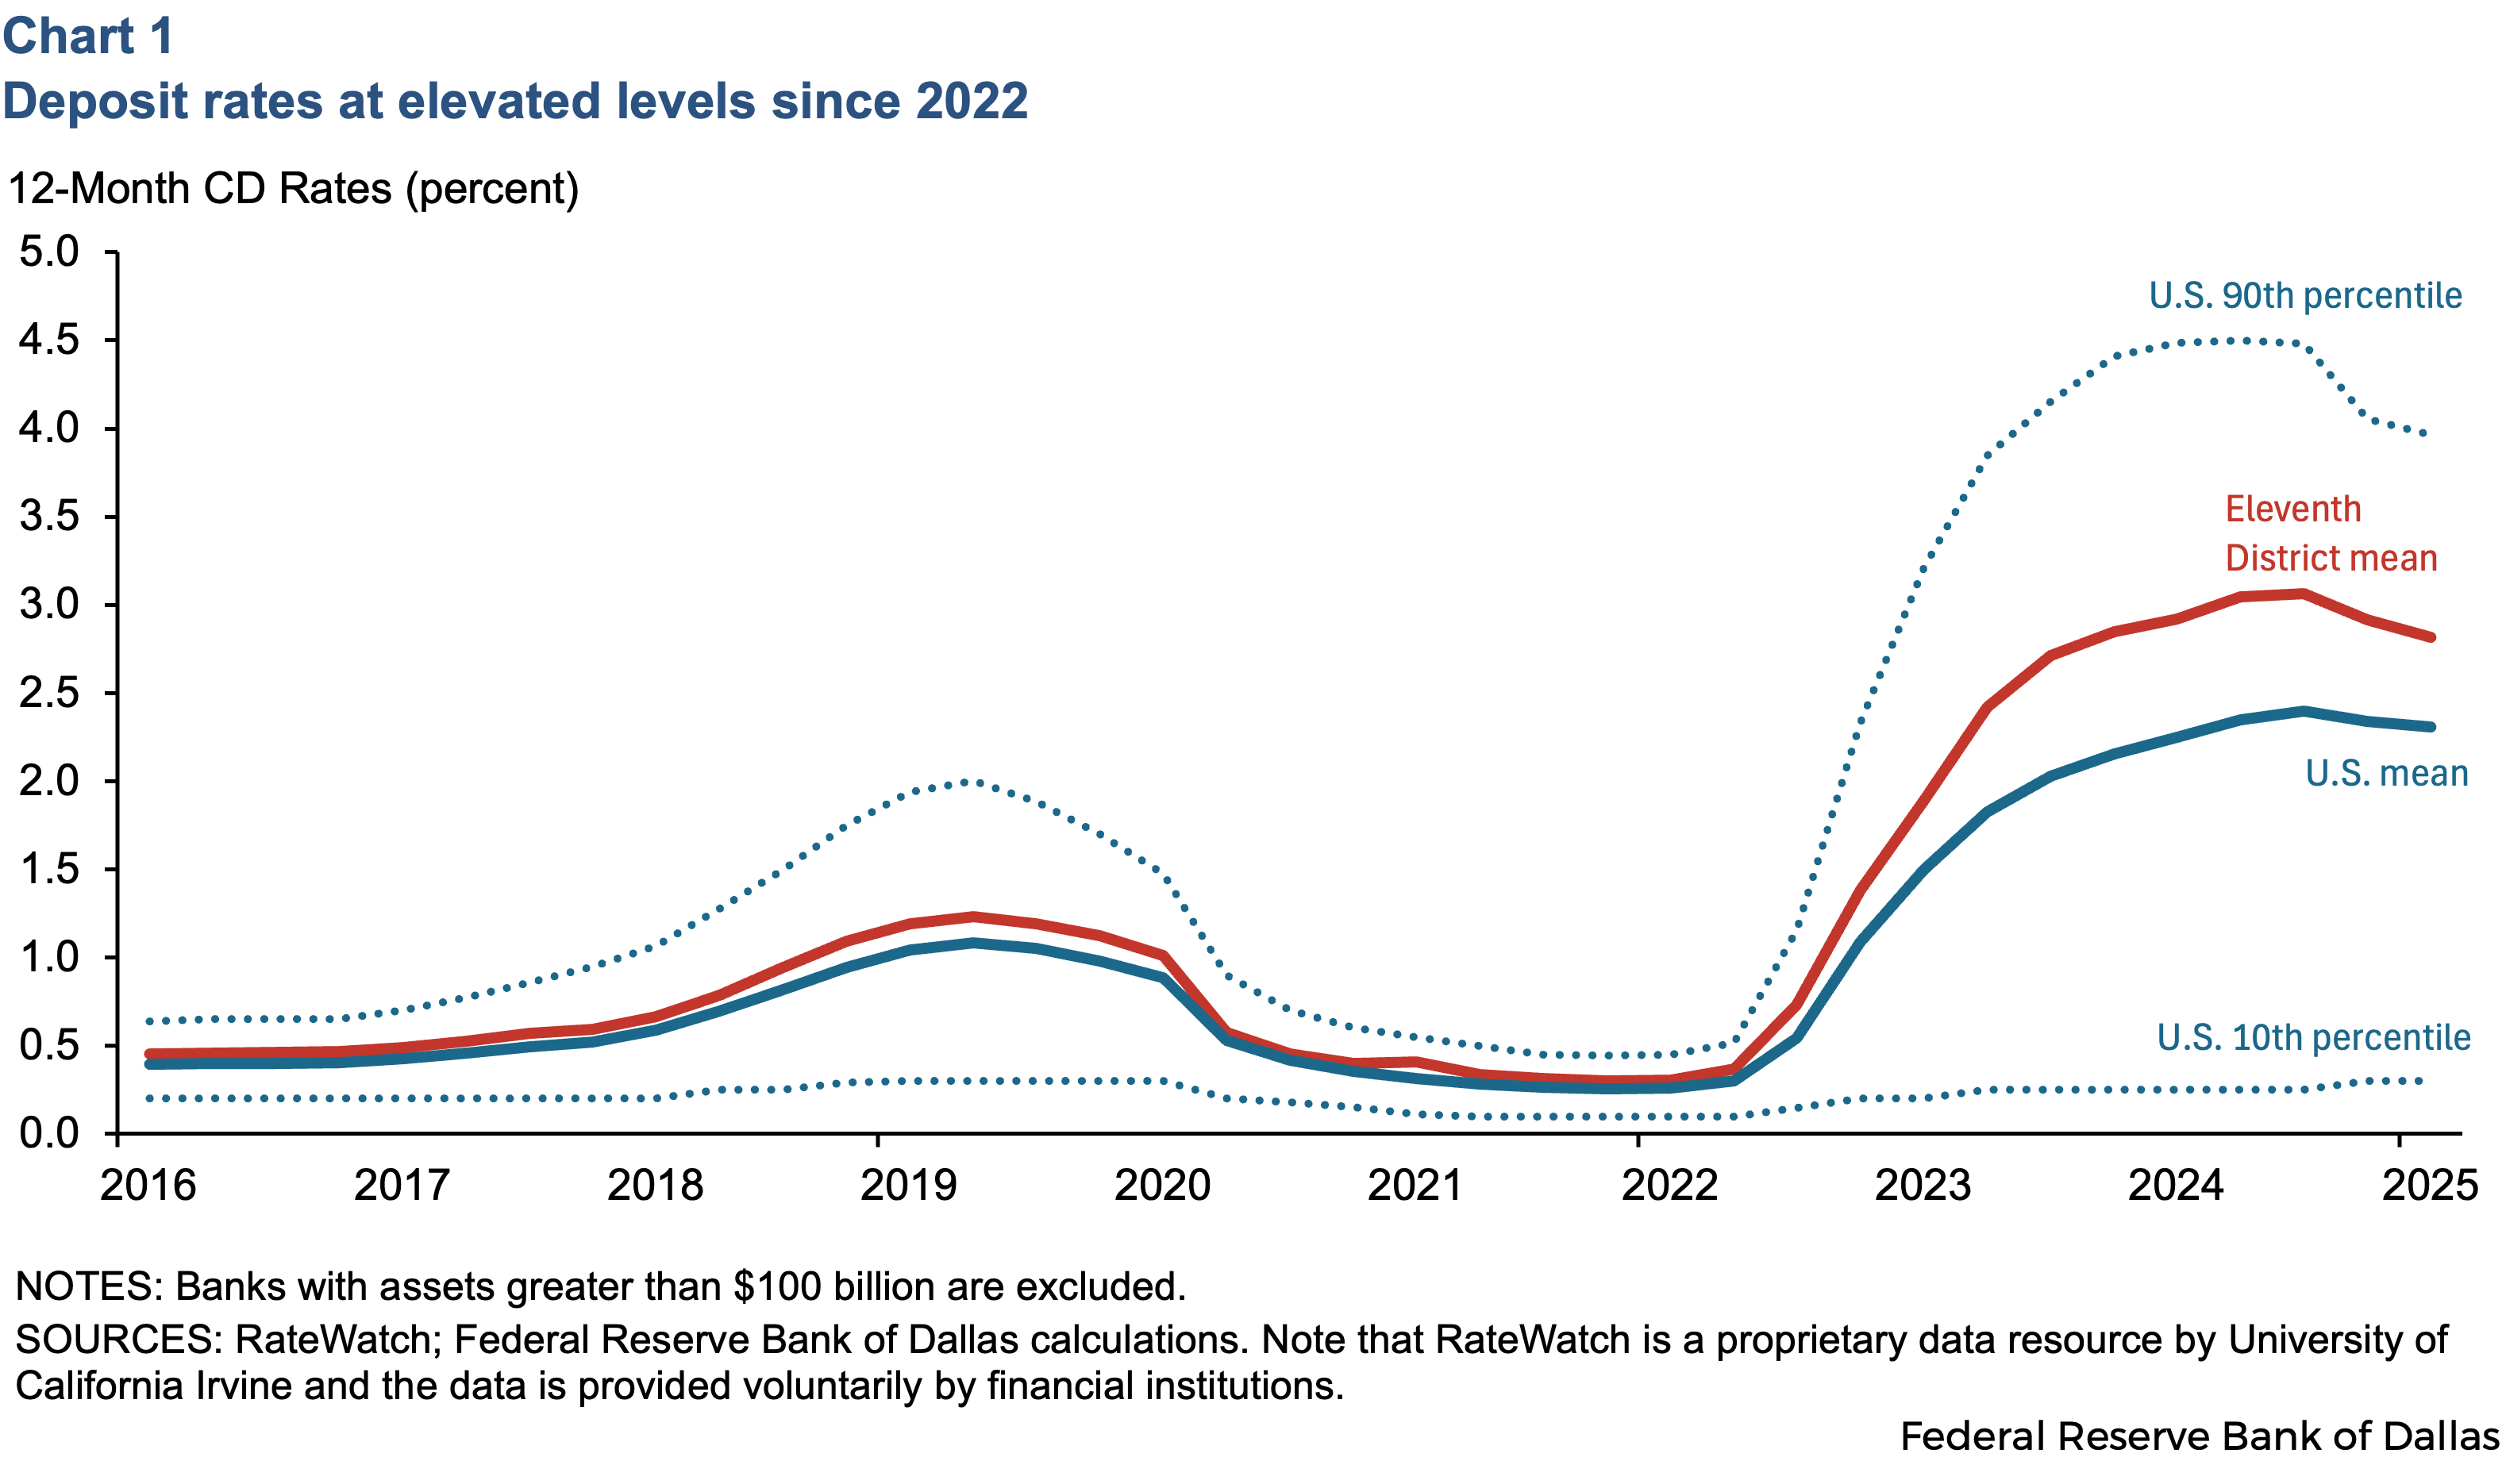
Deposit rates increased substantially as the Fed raised interest rate in 2022 to address rising inflation. This rise in deposit rate costs for banks was uneven, as the extreme values for 12-month certificate of deposit (CD) rates range between 0.1 percent and 4.5 percent for a new CD, while the average rate peaks at 2.5 percent (Chart 1). The average CD rates for banks in the Eleventh District have been higher than their peers nationally, peaking at 3 percent.
Does market discipline theory explain why banks pay different deposit rates?
When looking at why the rise in deposit costs was higher for some banks versus others, one traditional theory is market discipline, which suggests depositors require higher deposit rates to lend to riskier banks versus safer banks. However, in the United States, deposit insurance and minimum-risk-based capital requirements may mean most depositors don’t discriminate among banks based on risk of failure. Furthermore, the proliferation of reciprocal deposit networks, which extend deposit insurance coverage by splitting large deposits among multiple banks, means even fewer depositors have any potential for losses if a bank fails.
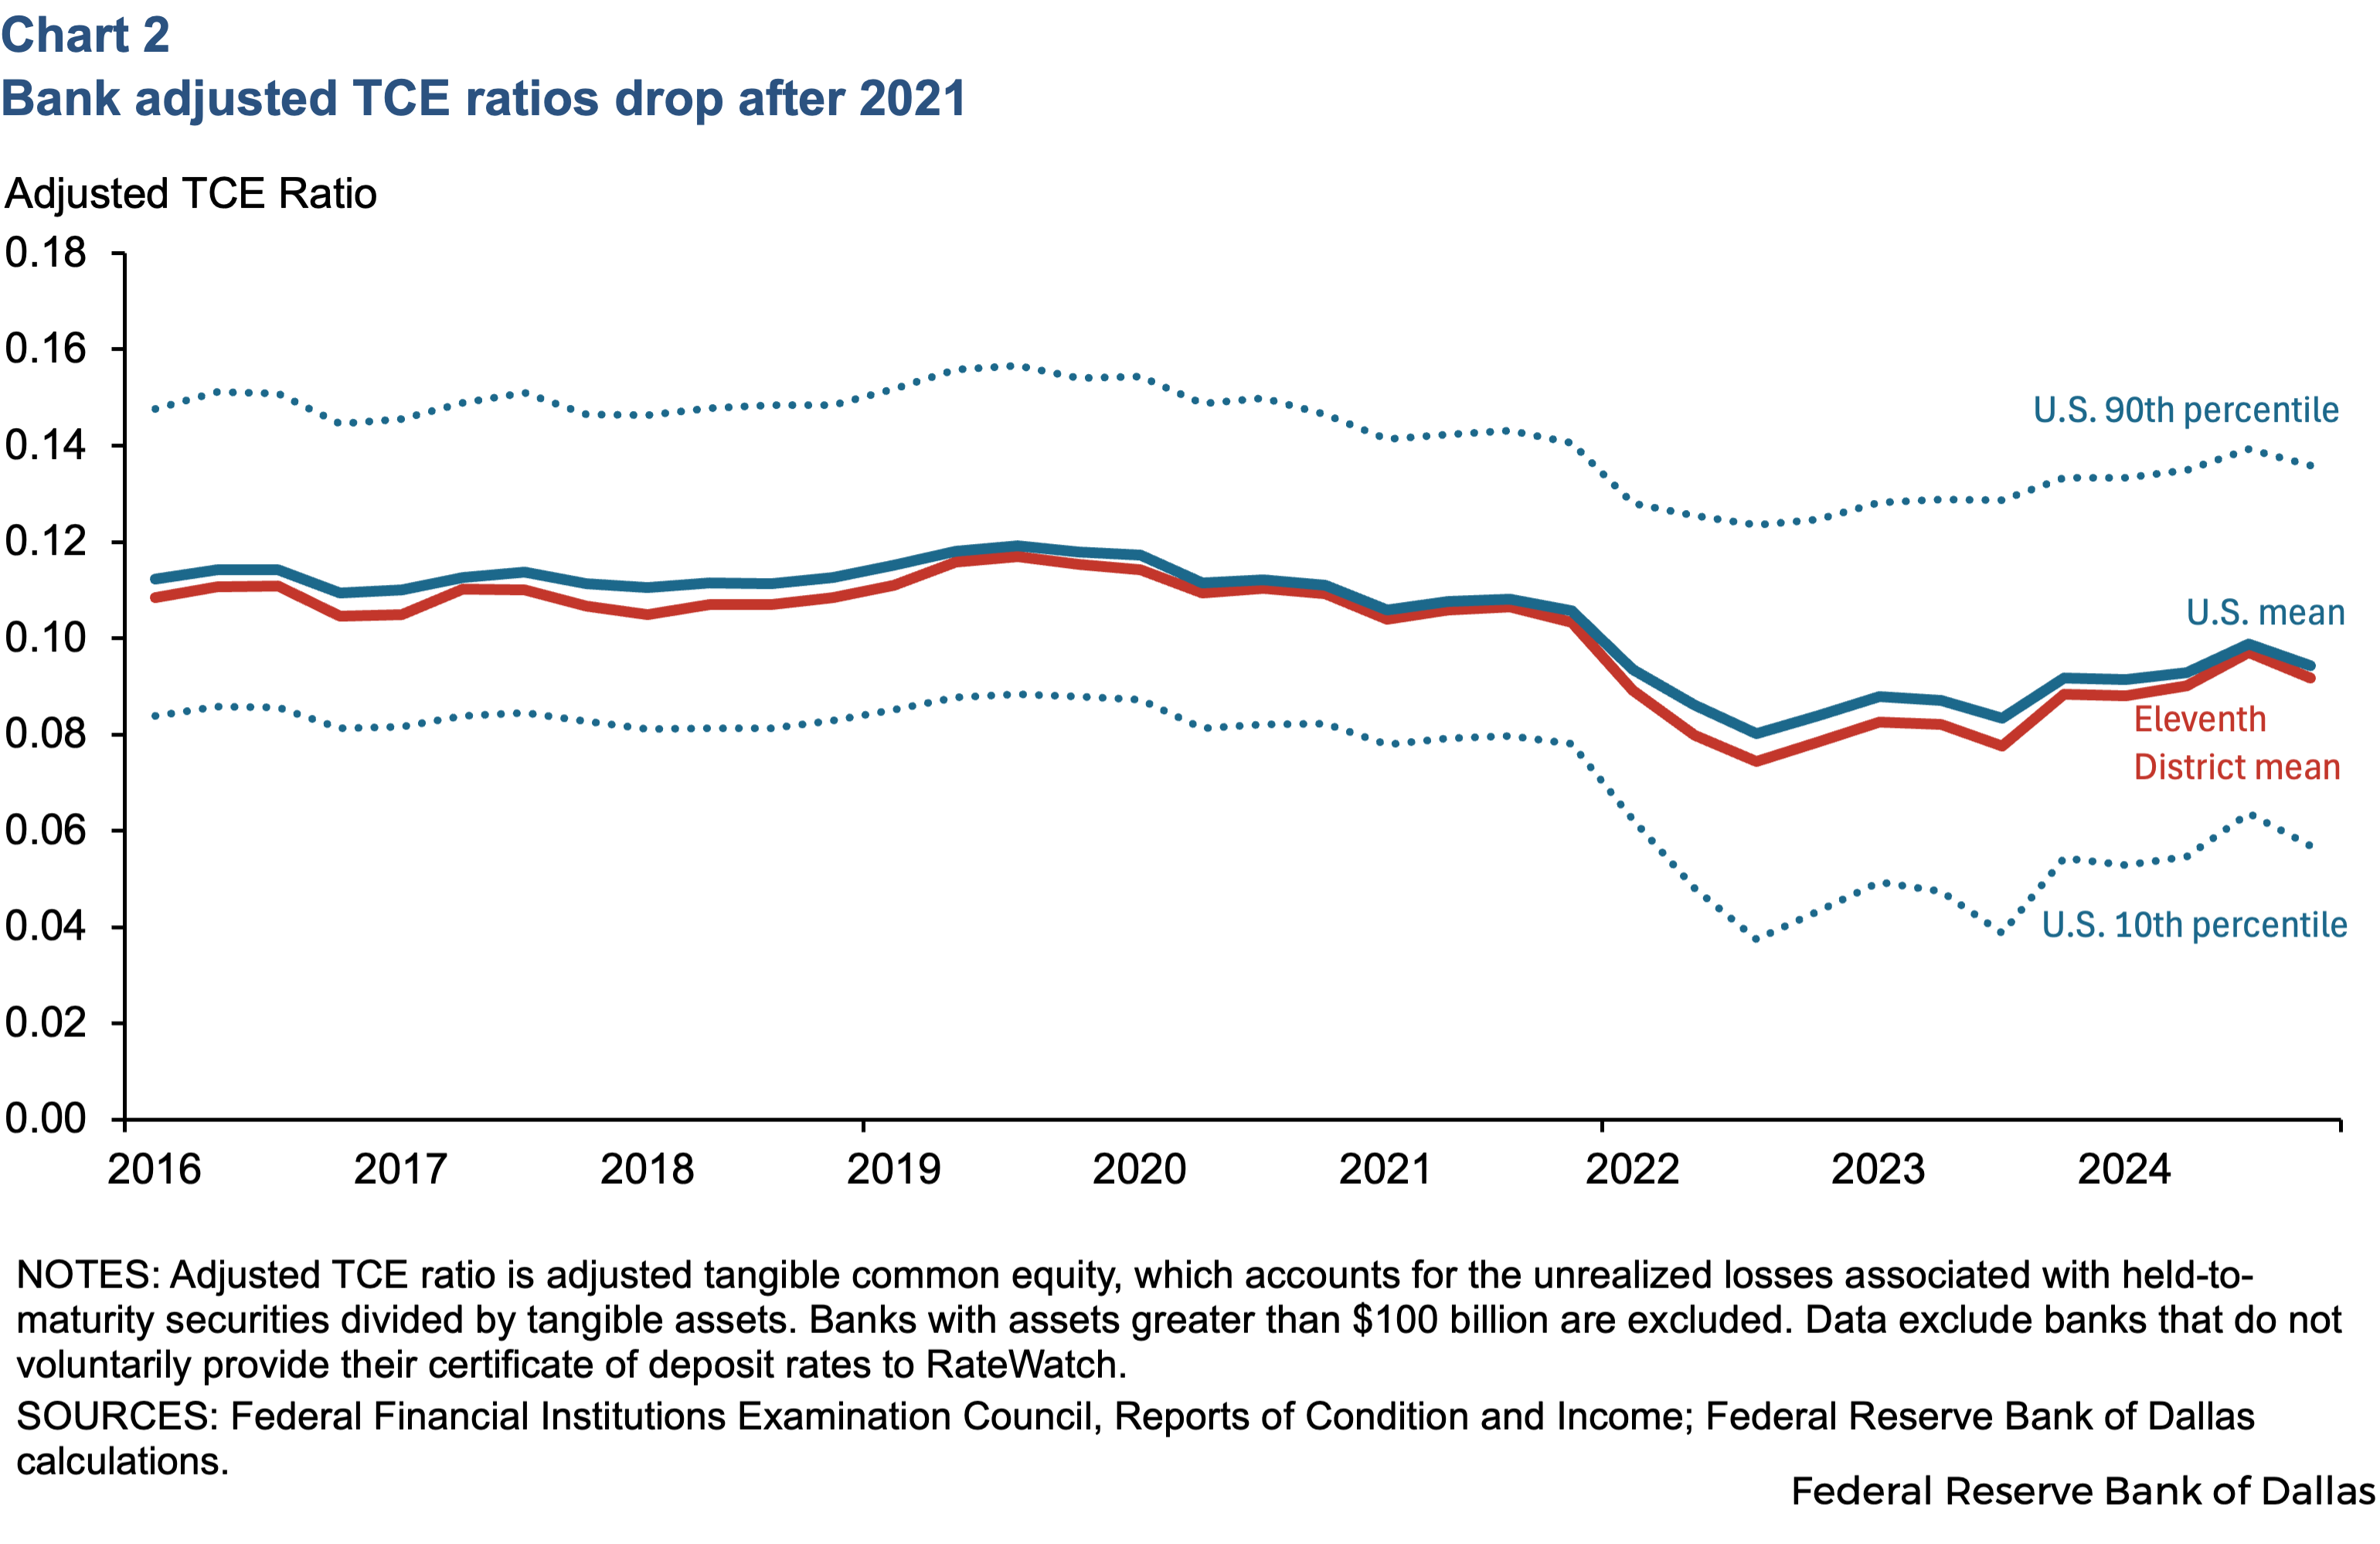
One of the conservative indicators of bank risk is the adjusted tangible common equity (TCE) ratio. The TCE ratio normally accounts for unrealized gains or losses on banks’ available-for-sale securities. However, the adjusted TCE ratio also reflects the unrealized losses associated with banks’ hold-to-maturity securities. This helps to evaluate the market value of a bank’s securities portfolio for a more clear and conservative view of the bank’s ability to absorb losses during a period of interest rate fluctuations.
Adjusted TCE ratios broadly fell after 2021 (Chart 2) as the interest rates and unrealized losses ramped up during that period. Banks with low capitalization ratios (those with adjusted TCE ratios at the bottom 25th percentile within each calendar quarter) show a sharper drop in 2022, as they have less of a buffer to absorb their unrealized losses. The Eleventh District adjusted TCE ratios remain close to the U.S. overall ratios, which has been improving since late 2022.
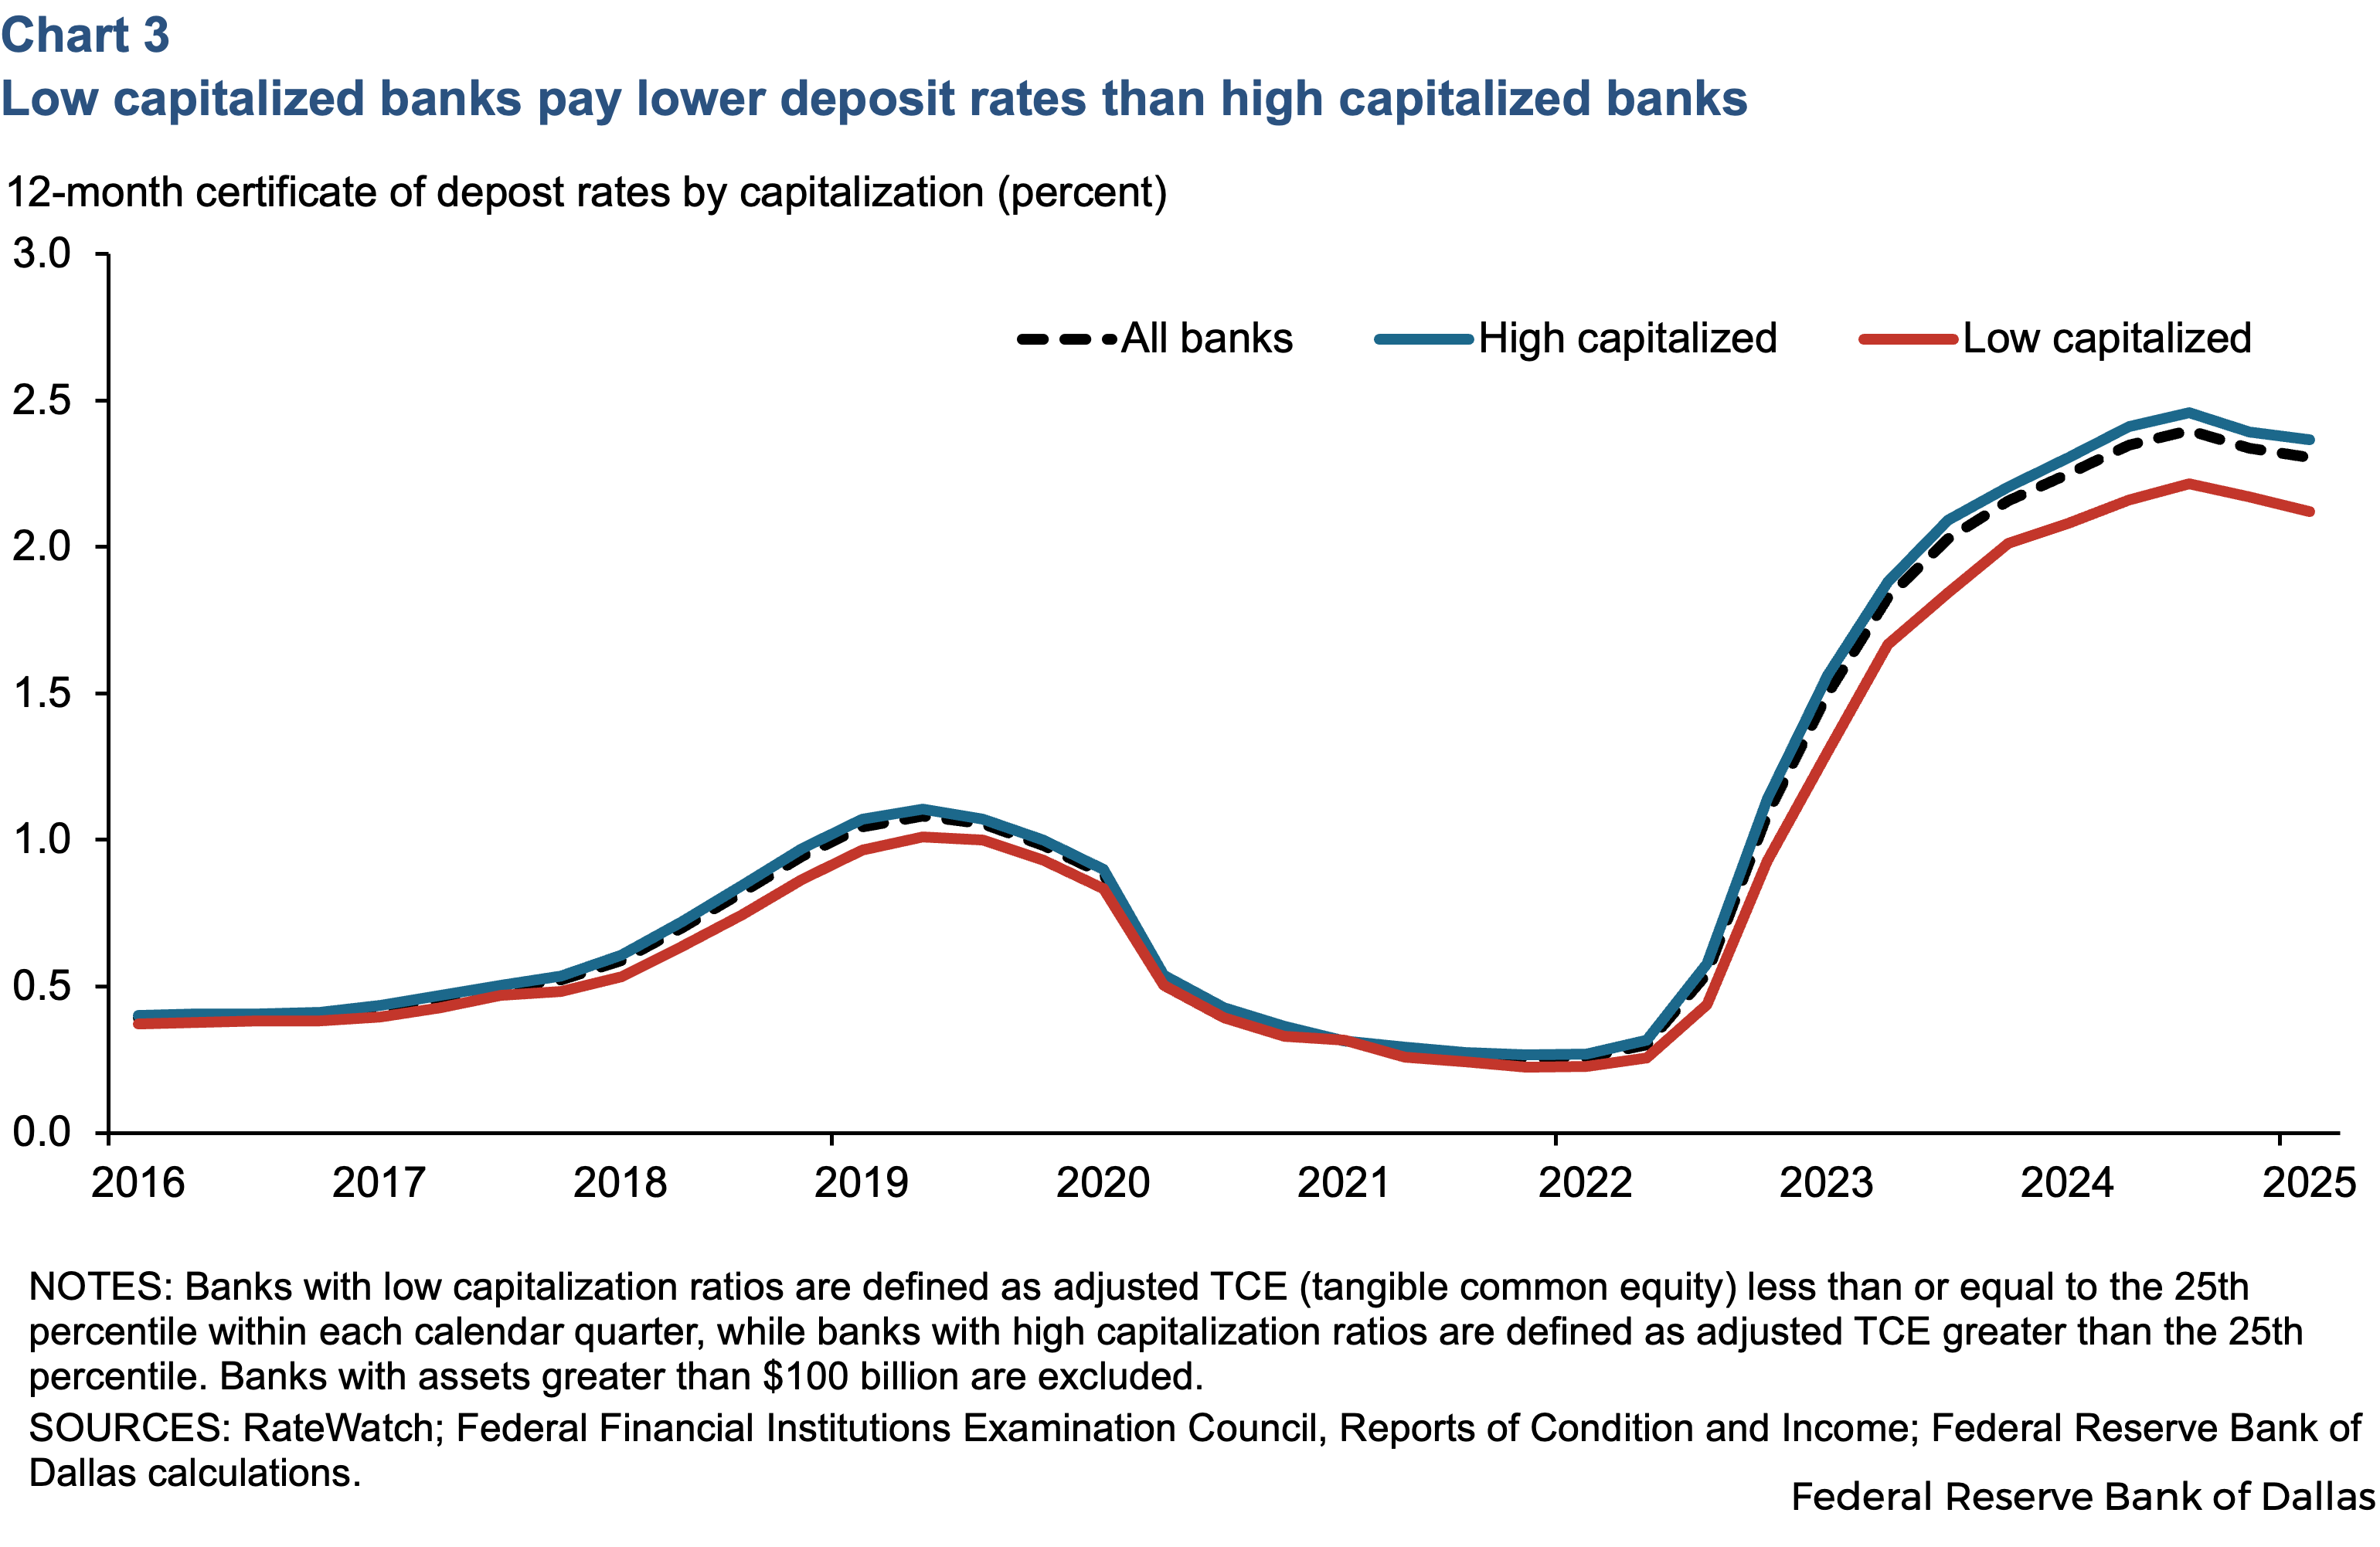
Based on the market discipline hypothesis, one would expect to observe higher deposit rates paid by the banks with lower capitalization levels. However, the average CD rates paid by these poorly capitalized banks were mostly lower than the rates paid by well capitalized banks (Chart 3). So, the market discipline theory does not explain why deposit rates differ across banks. On average, banks with higher capitalization ratios (those with adjusted TCE ratios greater than the 25th percentile within each calendar quarter) raised their deposit rates more than banks with low capitalization ratios did.
A regression analysis confirms what our charts show (Table 1). The analysis explores the relationship between 12-month CD rates and banks’ adjusted TCE ratio during the period of first quarter 2016 to first quarter 2025, after controlling for several measures of banks’ financial condition from public Call Report filings, as well as time- and bank-specific fixed effects.
The results show very weak evidence of market discipline among low-capital banks during the COVID-19 period (second quarter 2020 to first quarter 2022), as the coefficient for adjusted TCE ratio with interaction term is negative but statistically significant only at the 10 percent level. This negative coefficient suggests that poorly capitalized banks pay higher CD rates when their capitalization levels further deteriorate during a crisis. However, we do not find evidence of market discipline for these low-capitalized banks in any other time periods. Similarly, the results show no evidence of market discipline among highly capitalized banks or small, medium or large banks at any time during our study. For robustness analysis, we use alternative measures of bank capital, such as equity-to-assets ratio and adjusted equity-to-assets ratio, and the results are similar. These findings are in line with the results provided by Ben-David et al. (2017), which found no evidence of the market discipline hypothesis for banks during the period of 2007-2012.
| Dependent variable: 12-Month CD rate | ||||||
| Capital | Asset Size | |||||
| Variable | All Banks | Low | High | Low | Mid | Large |
| Adj_TCE | -0.164 (0.50) |
-0.082 (1.65) |
0.231 (0.53) |
0.499 (0.50) |
-1.570 (1.23) |
-5.656 (4.92) |
| Adj_TCE * 2020Q2_2022Q1 | -0.277 (0.22) |
-3.029* (1.67) |
0.053 (0.23) |
-0.322 (0.20) |
-0.425 (0.60) |
2.388 (4.64) |
| Adj_TCE * 2022Q2_2023Q1 | 1.210** (0.51) |
1.080 (2.12) |
0.741* (0.36) |
0.433 (0.34) |
3.166*** (1.03) |
11.472** (4.84) |
| Adj_TCE * post_2023Q1 | 1.888*** (0.54) |
-0.885 (2.98) |
1.457** (0.65) |
0.761 (0.61) |
3.568*** (1.19) |
11.591* (6.21) |
| Bank fixed effects | Yes | Yes | Yes | Yes | Yes | Yes |
| Calendar quarter fixed effects | Yes | Yes | Yes | Yes | Yes | Yes |
| No. of Obs. | 122,602 | 30,572 | 92,030 | 81,562 | 37,350 | 3,690 |
| Adj. R-squared | 0.670 | 0.714 | 0.698 | 0.683 | 0.692 | 0.700 |
| NOTES: Table 1 shows regressions of 12-month certificate of deposit (CD) rates on lagged adjusted tangible common equity (TCE) interacted with a period dummy. Column 1 uses the entire sample of bank quarters. Columns 2 and 3 split the sample based on the adjusted TCE ratio, with column 2 using the bottom 25th percentile within each quarter to define low-capitalized banks and column 3 using the top three quartiles to define high-capitalized banks. Columns 3, 4 and 5 split the sample by bank asset size, with low (less than $500 million), medium (greater than $500 million and below $10 billion) and large (greater than $10 billion). Control variables include a bank’s loan growth, size, number of branches, whether it’s a newly chartered bank, and financial ratios related to a bank’s deposit and loan composition and credit performance. Model variables are winsorized at the 0.5th and 99.5th percentiles to avoid the influence of outliers on the estimation results. All control variables are lagged by one quarter. Adjusted Tangible Common Equity is in units of raw ratio (1 percent = .01) and 12-month CD rate is in units of percent (1 percent = 1). All regressions are ordinary least squares regressions and have bank and calendar quarter fixed effects. Standard errors are double-clustered by bank and calendar quarter, and they are presented in parentheses. Annotations of ***, ** and * indicate statistical significance at the 1 percent, 5 percent and 10 percent levels, respectively. SOURCES: RateWatch; Federal Financial Institutions Examination Council, Reports of Condition and Income; Federal Reserve Bank of Dallas calculations. |
||||||
Deposit inflows and lending exhibit fluctuating patterns since COVID
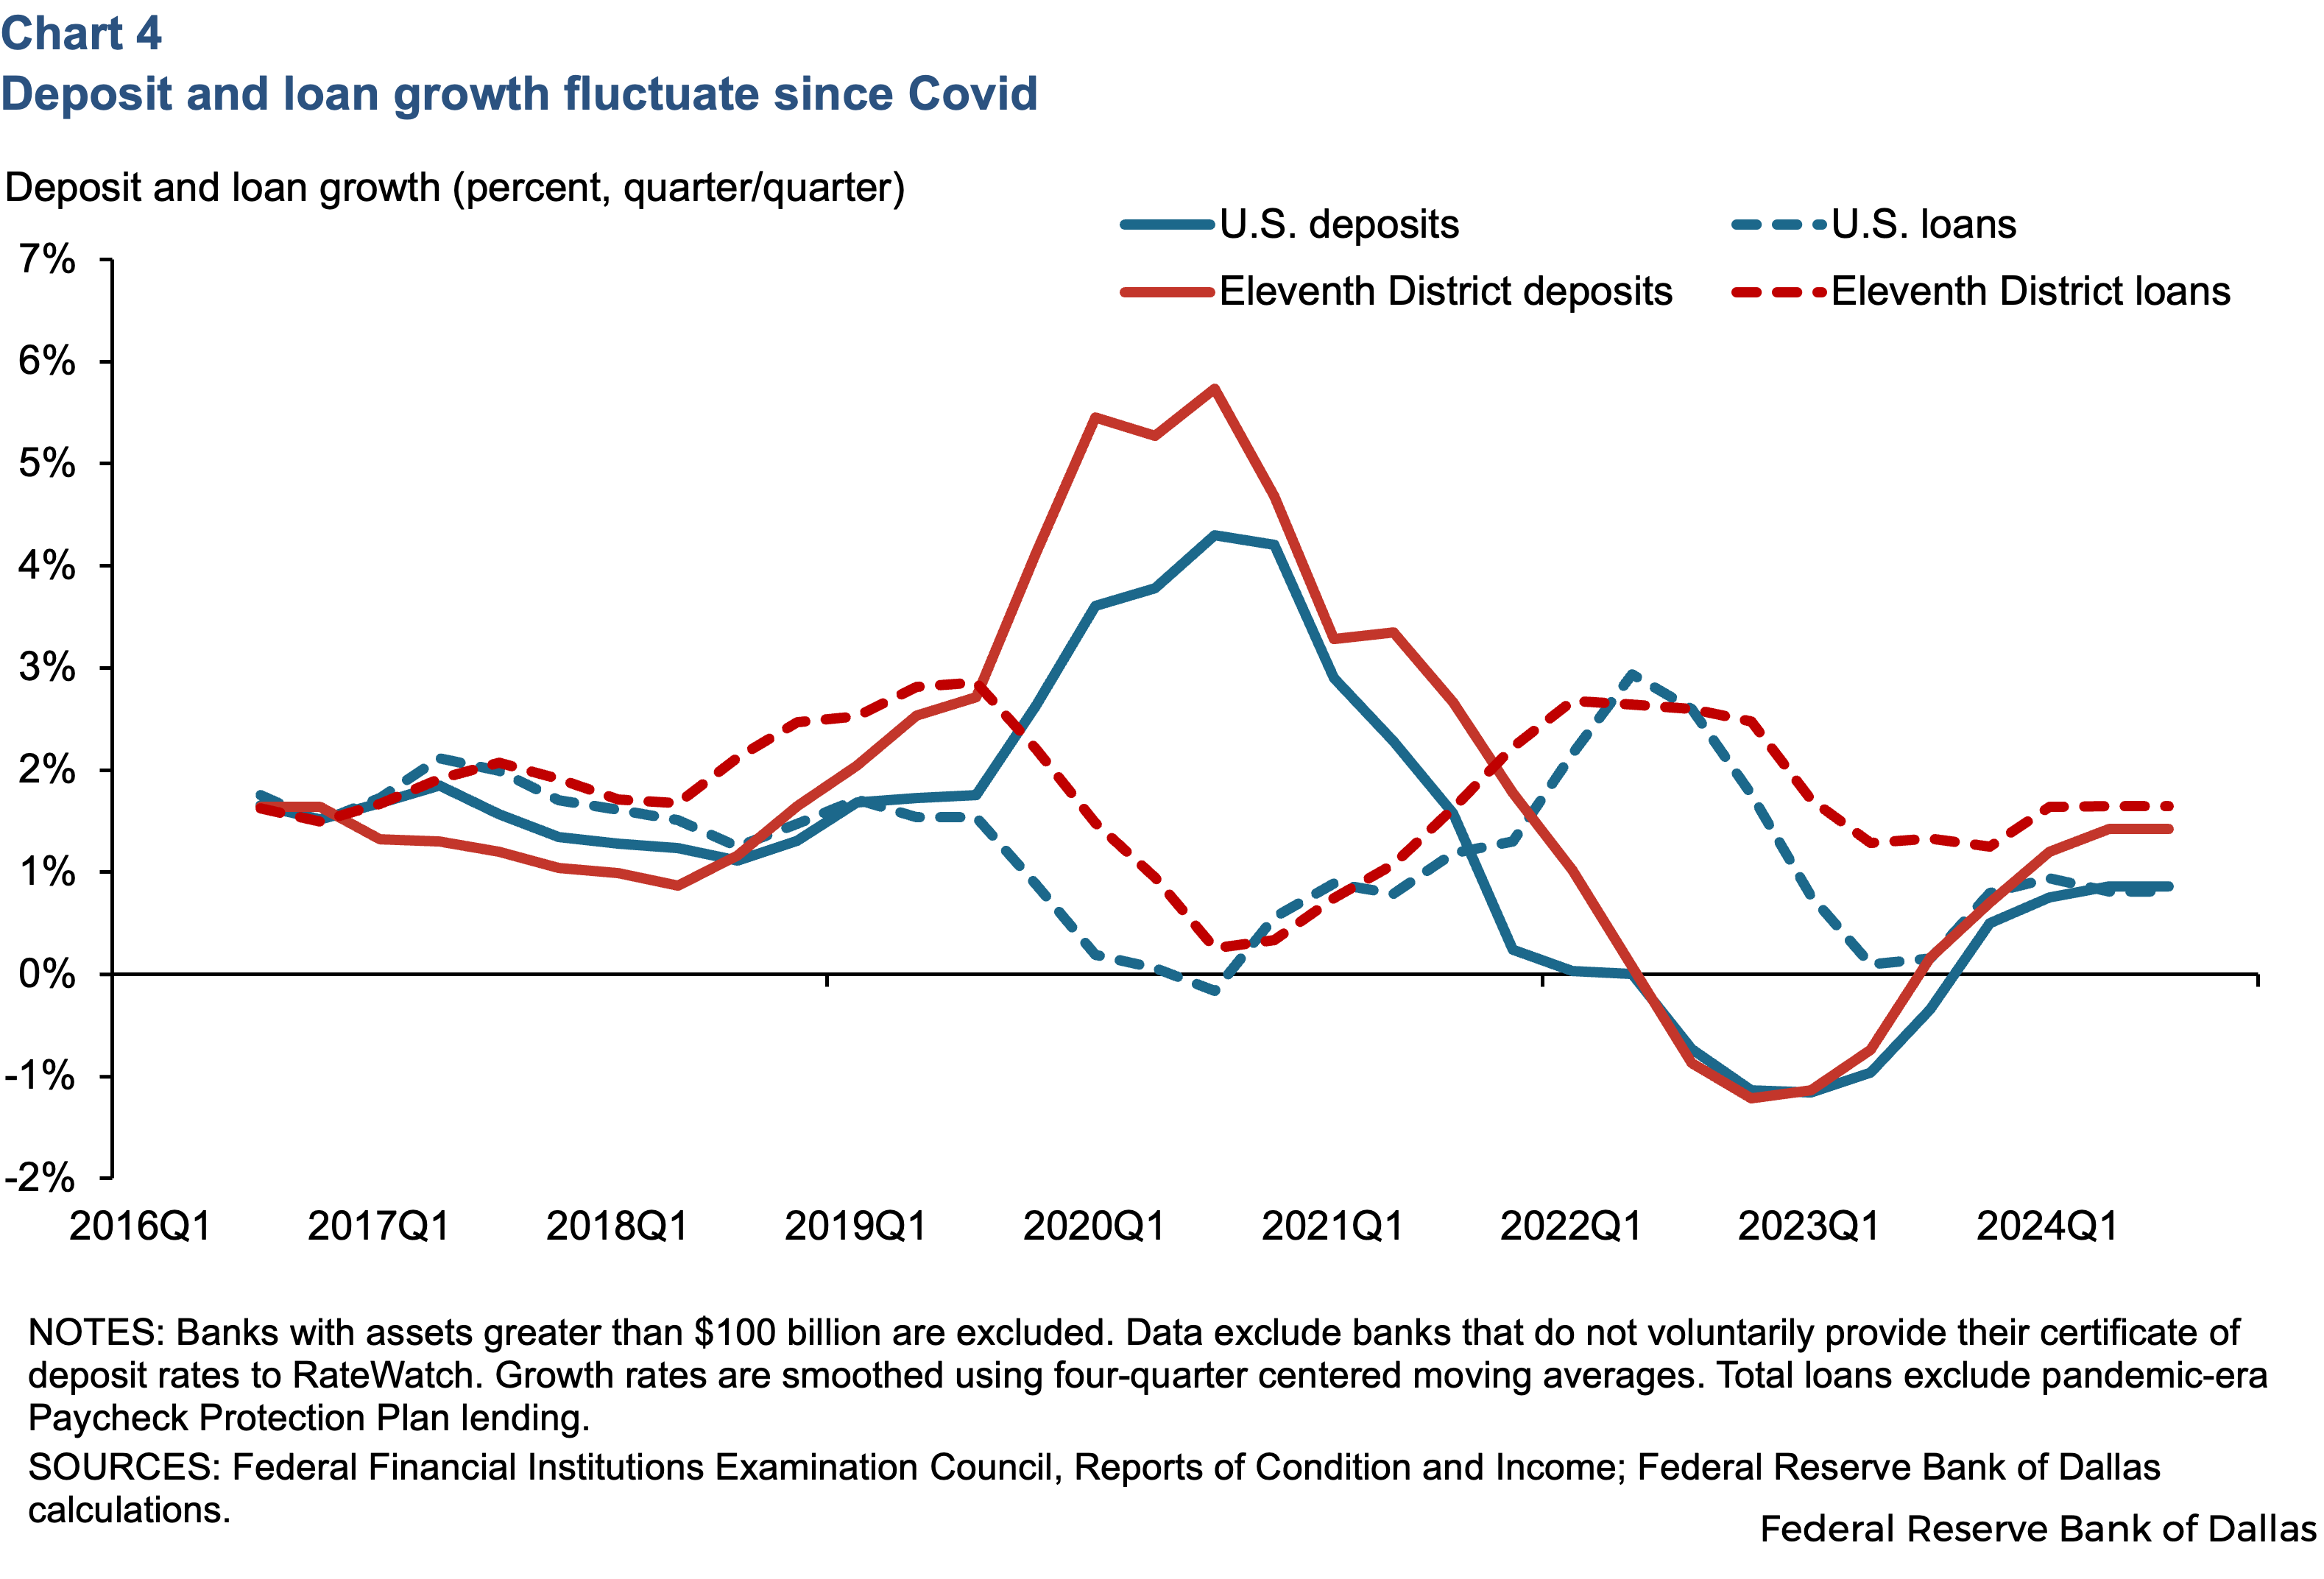
The COVID-19 period of 2020-2021 was marked by an abundance of deposit inflows, largely attributed to government stimulus programs and quantitative easing policies, while credit standards tightened during the pandemic in 2020 due to economic uncertainty (Chart 4). However, credit standards loosened in 2021-2022, but then tightened again in 2023-2024 primarily due to policy rate increases, rising inflation, rising funding costs, pressure on net interest margins (net interest income divided by earning assets), stress in the financial sector and banking turmoil in 2023, and credit quality concerns—especially in commercial real estate and consumer lending. An earlier study by the Dallas Fed shows that net interest margin for Eleventh District banks improved in recent periods as banks reduced their securities exposure and ramped up lending, especially in both residential and commercial real estate loans. Community banks (those with less than $10 billion in total assets) provide a greater share of lending within the Eleventh District than regional banks (those with total assets between $10 billion and $100 billion) since the COVID-19 period.
Did deposit rates for banks really rise to fund loan growth?
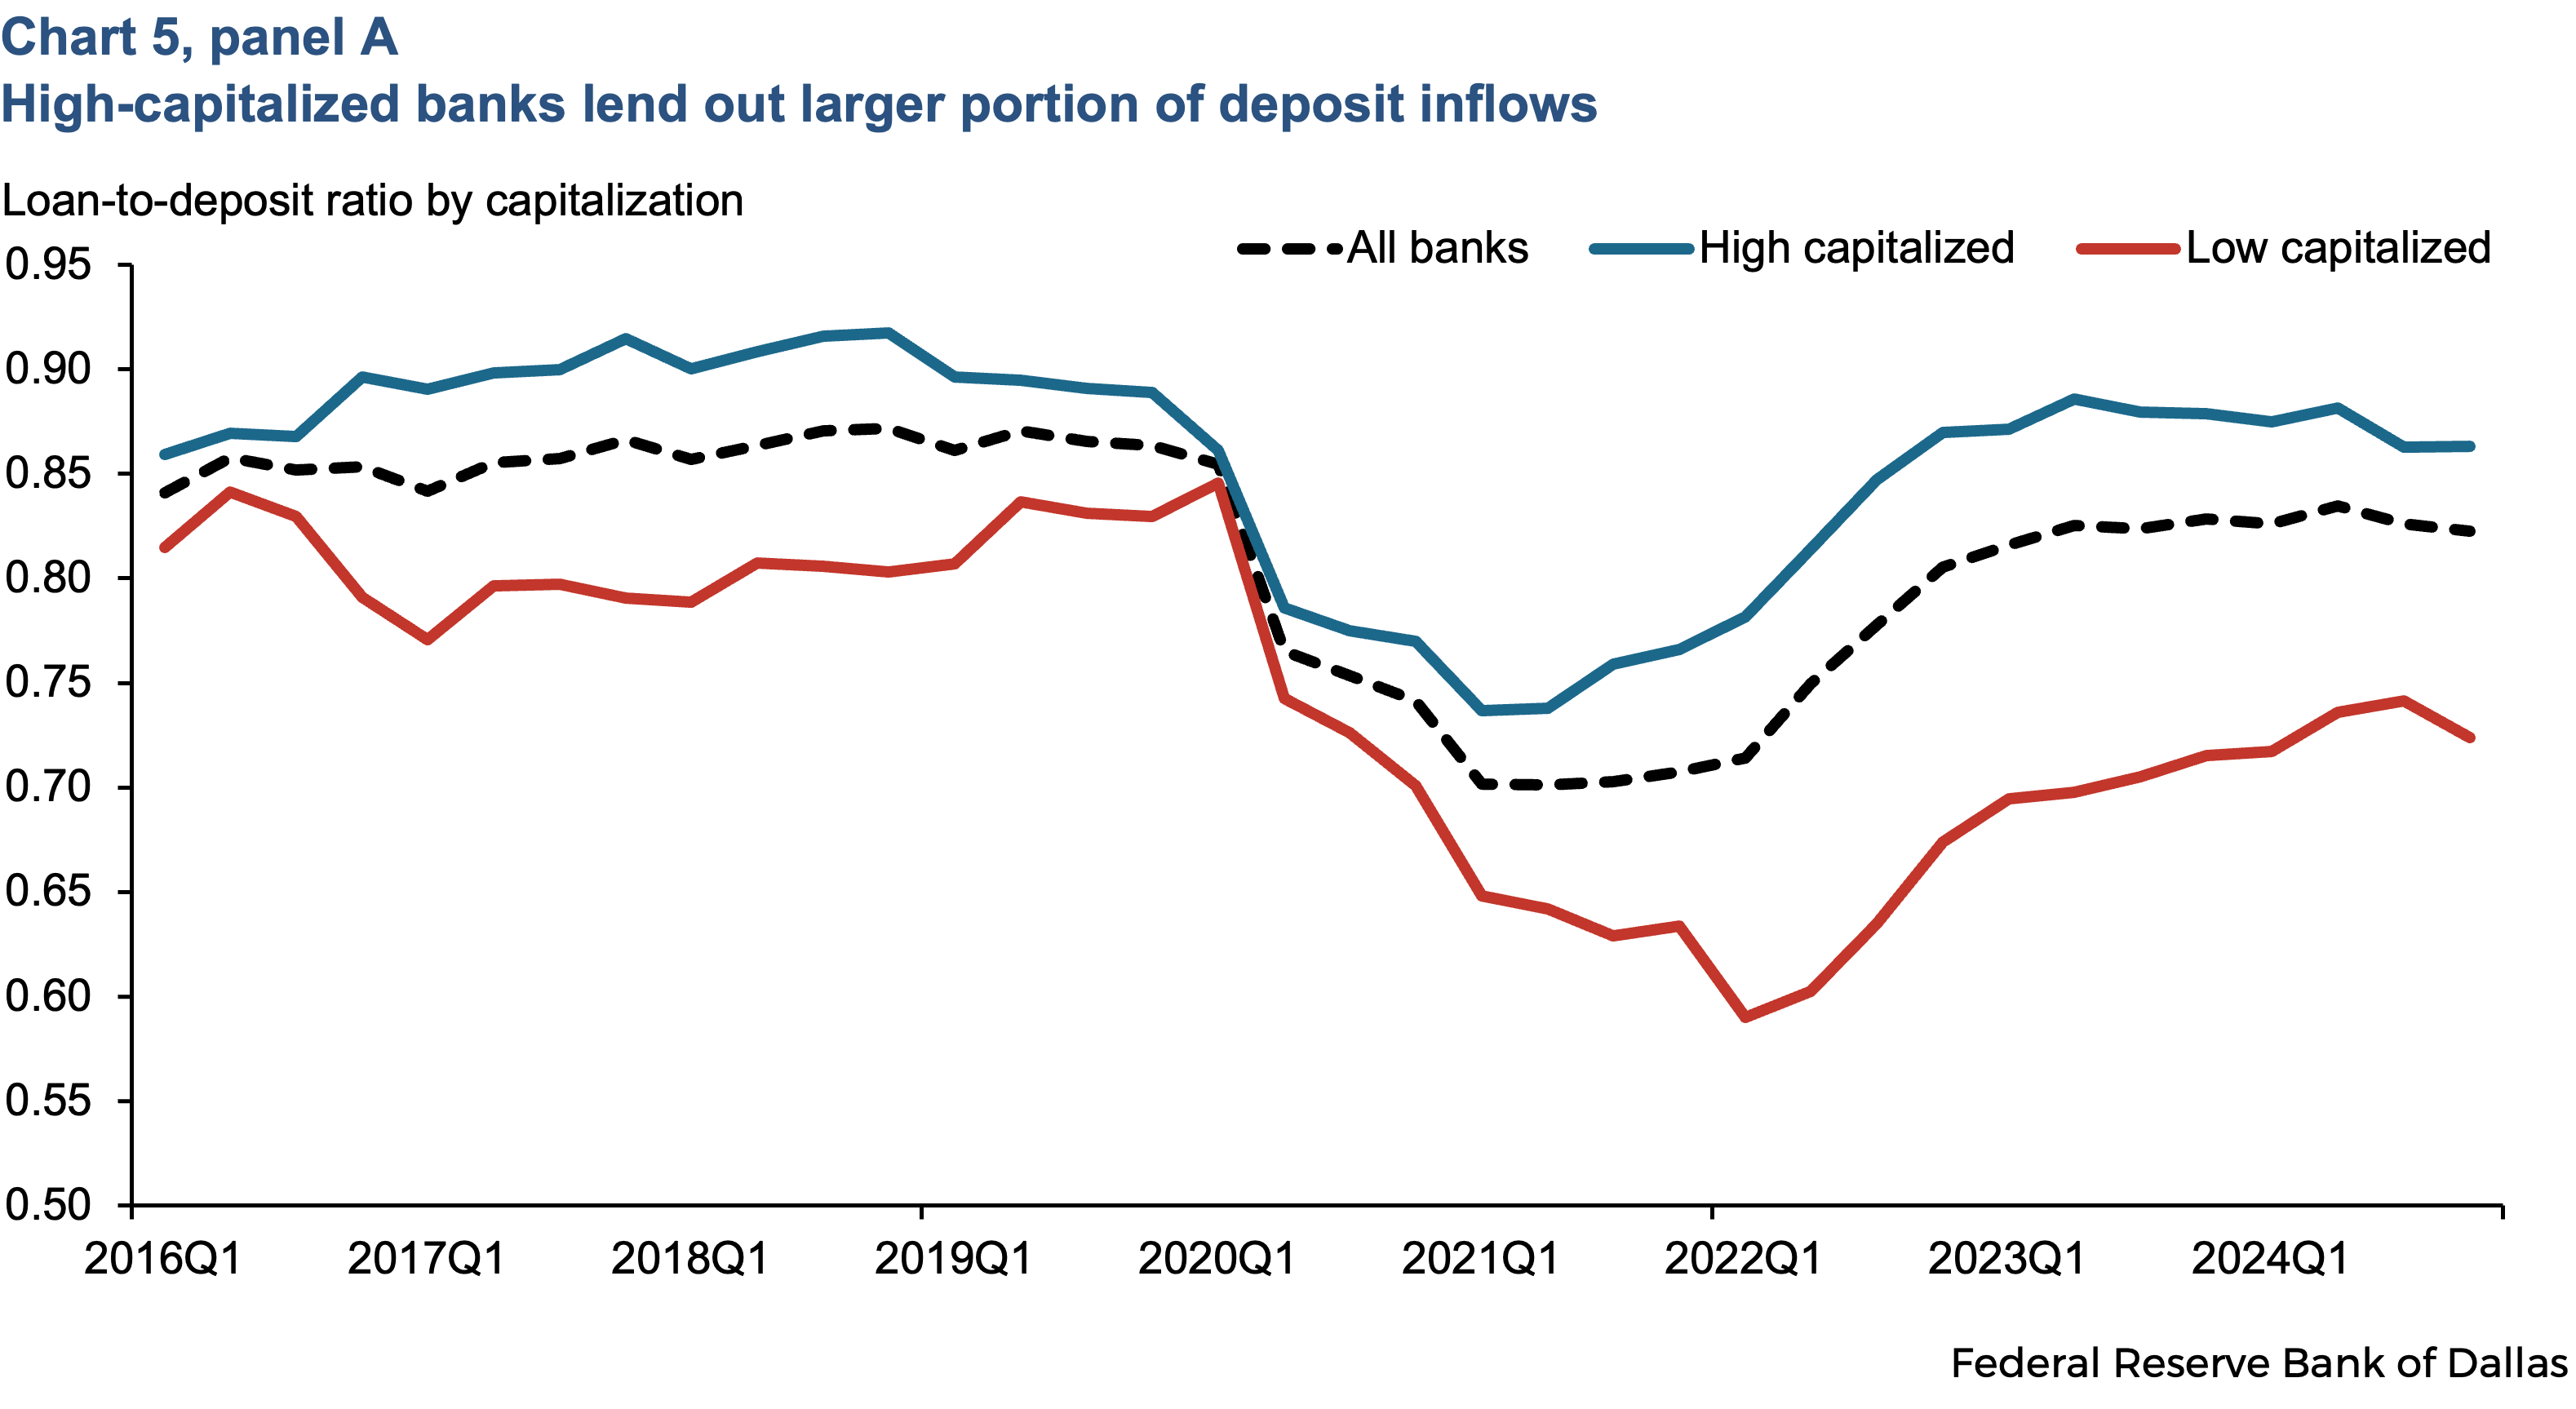
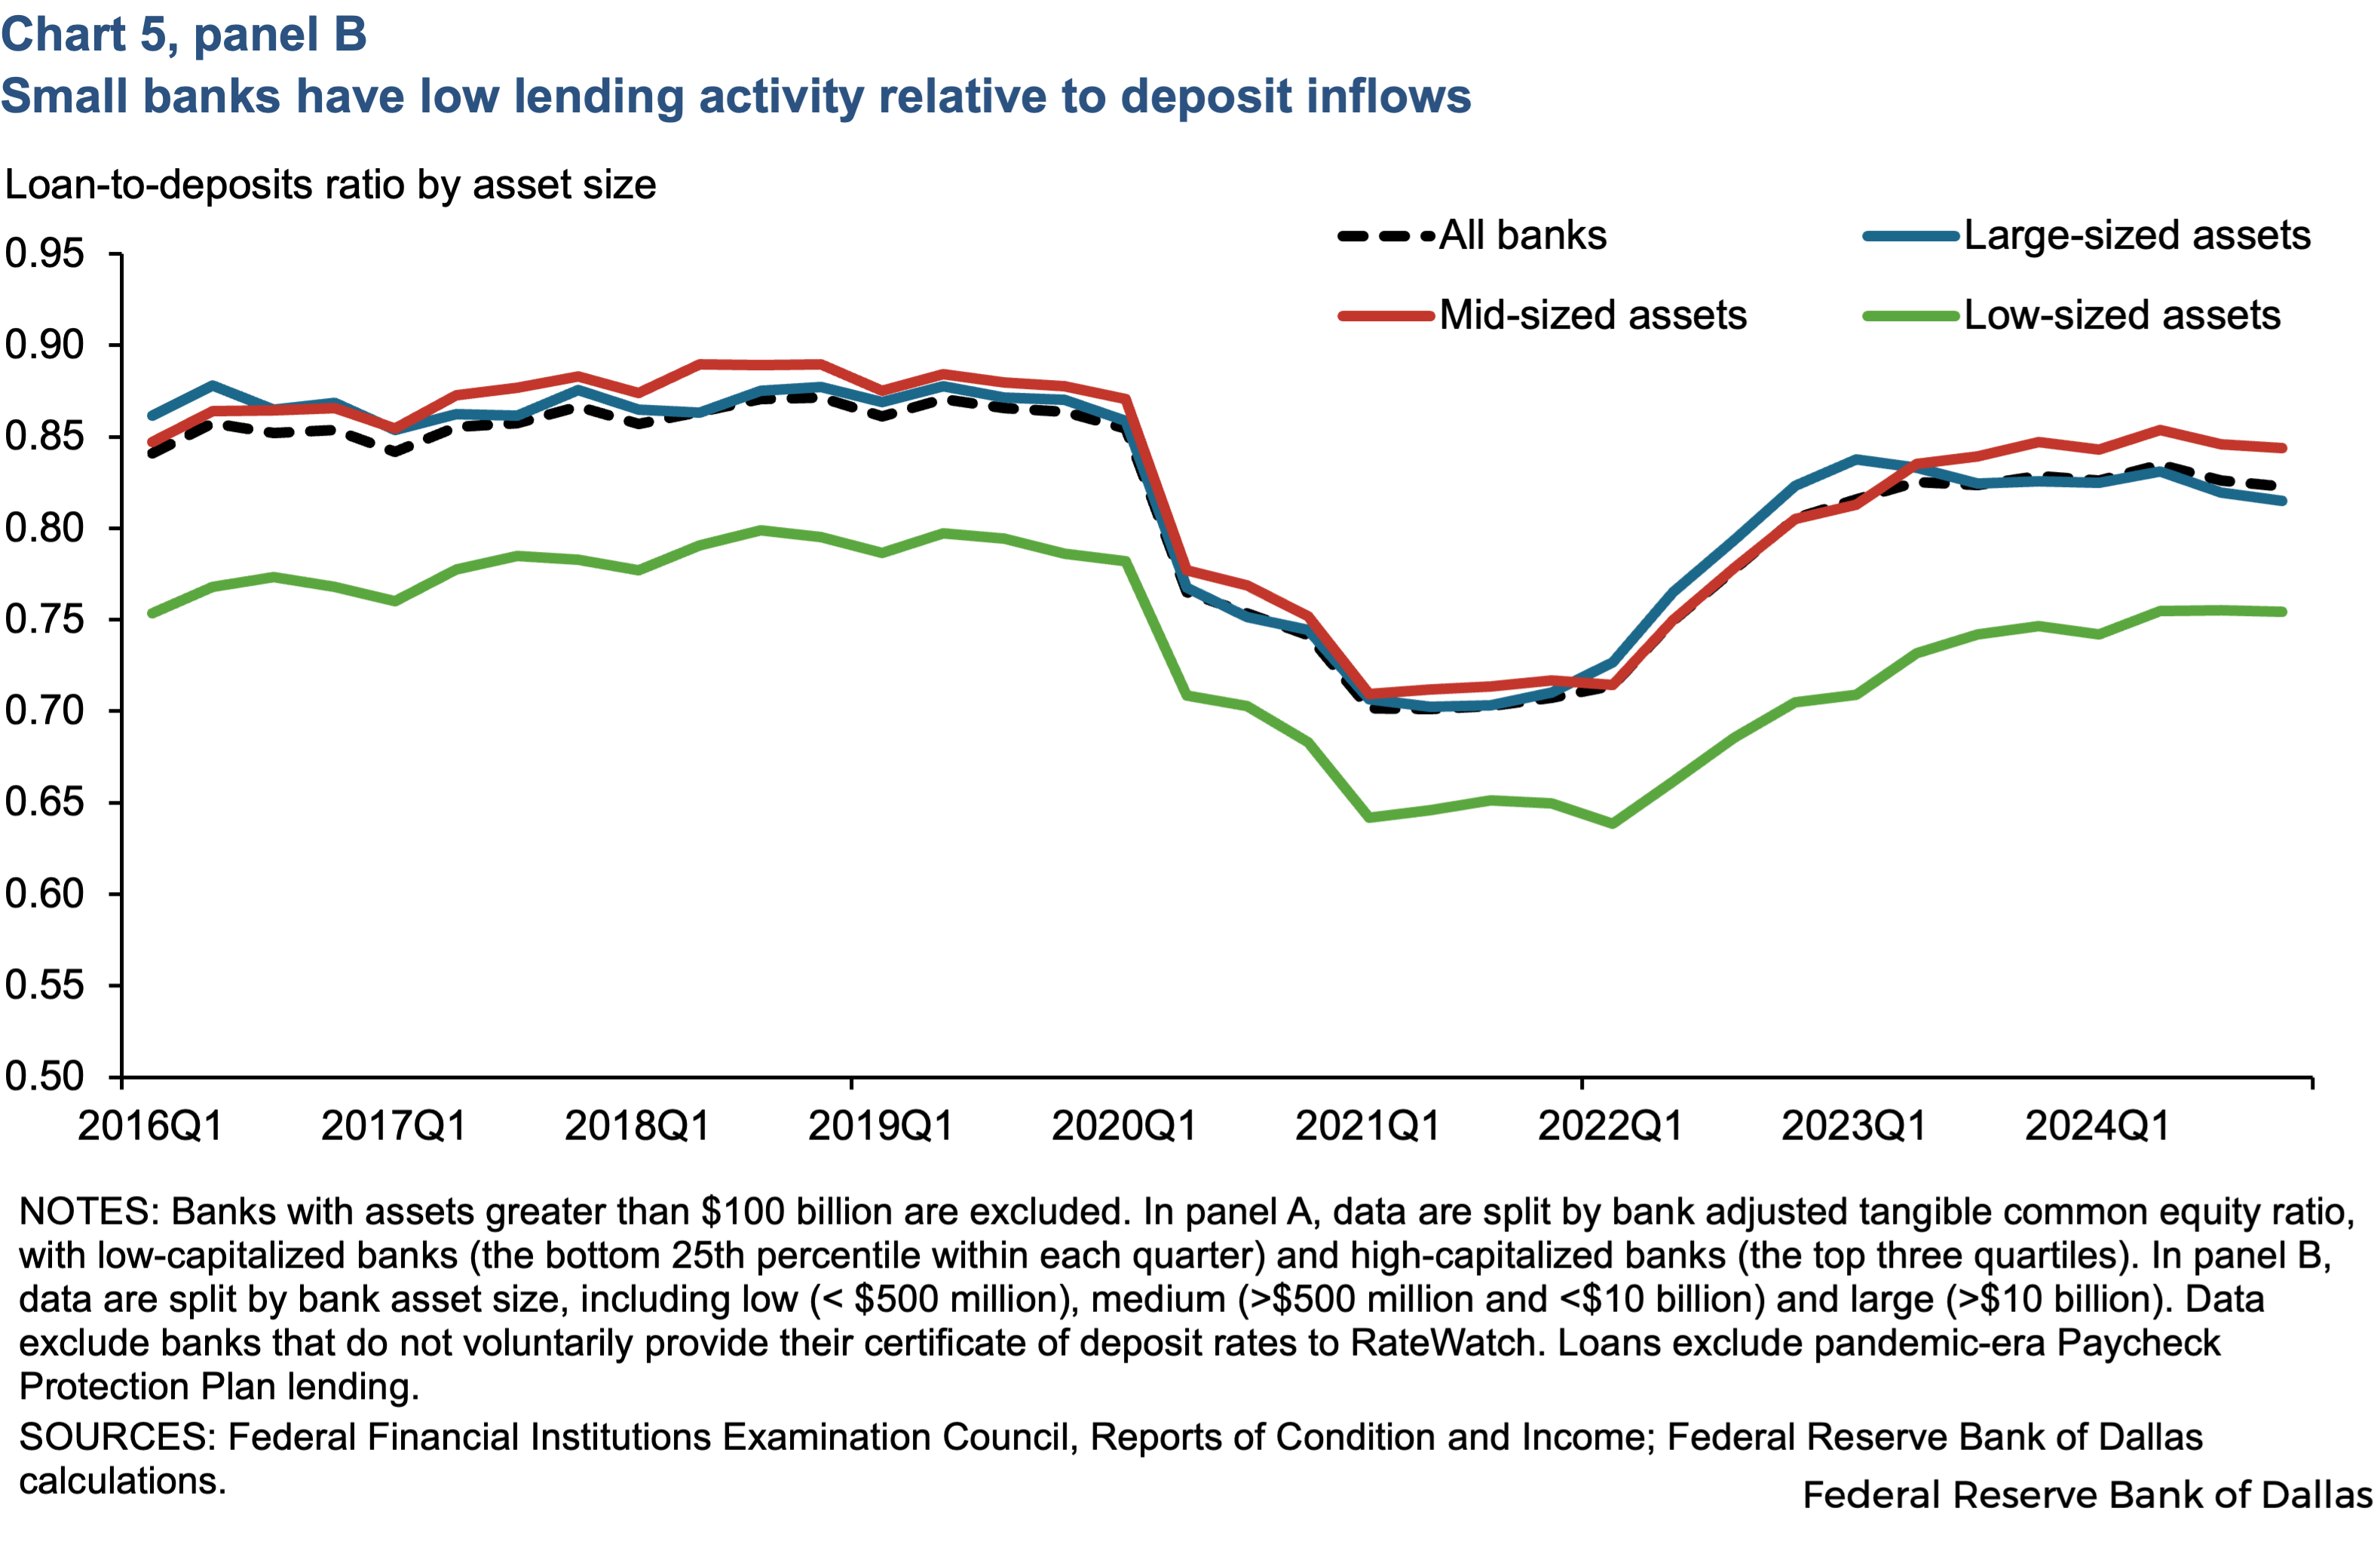
Well-capitalized banks seem to lend more relative to their deposit inflows compared to poorly capitalized banks, as their loan-to-deposit (LTD) ratio falls less during the pandemic and rebounds more quickly (Chart 5, panel A). On the other hand, for banks with low capitalization levels, the LTD ratio drops more sharply and recovers more gradually—these banks aren’t lending as aggressively. Similarly, smaller community banks (those with less than $500 million in assets) seem to have lower LTD ratios, suggesting lower lending activity relative to their deposit inflows (Chart 5, panel B).
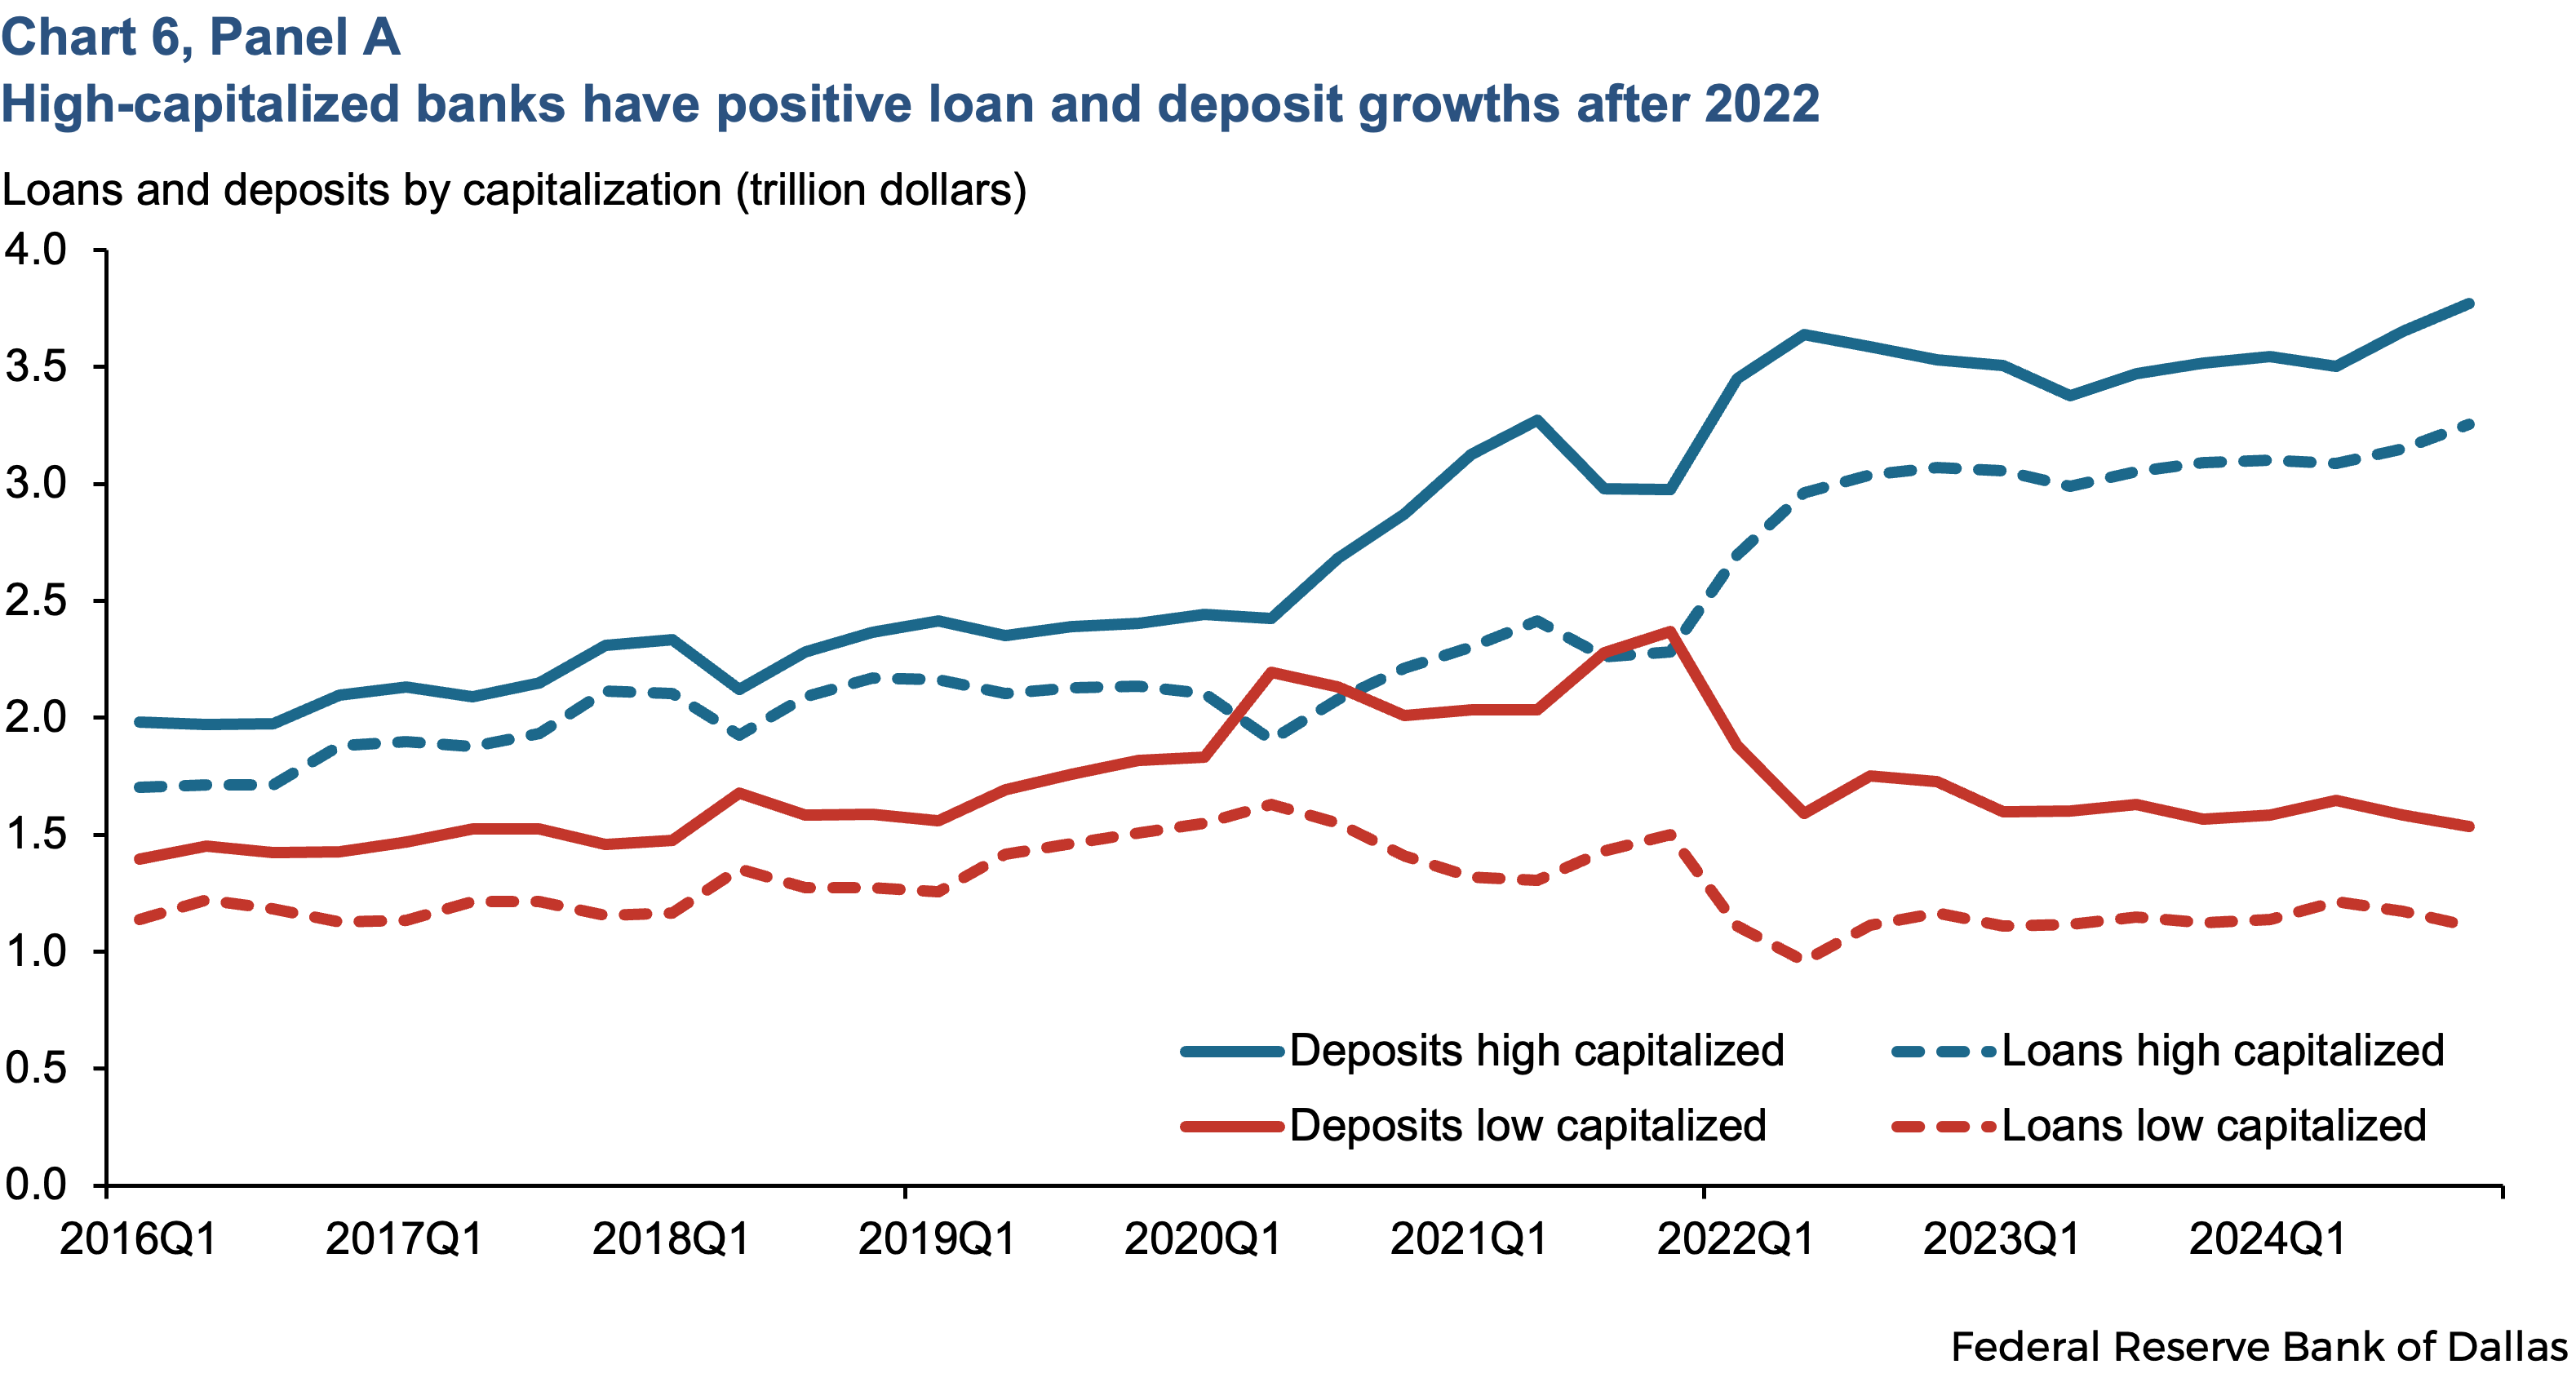
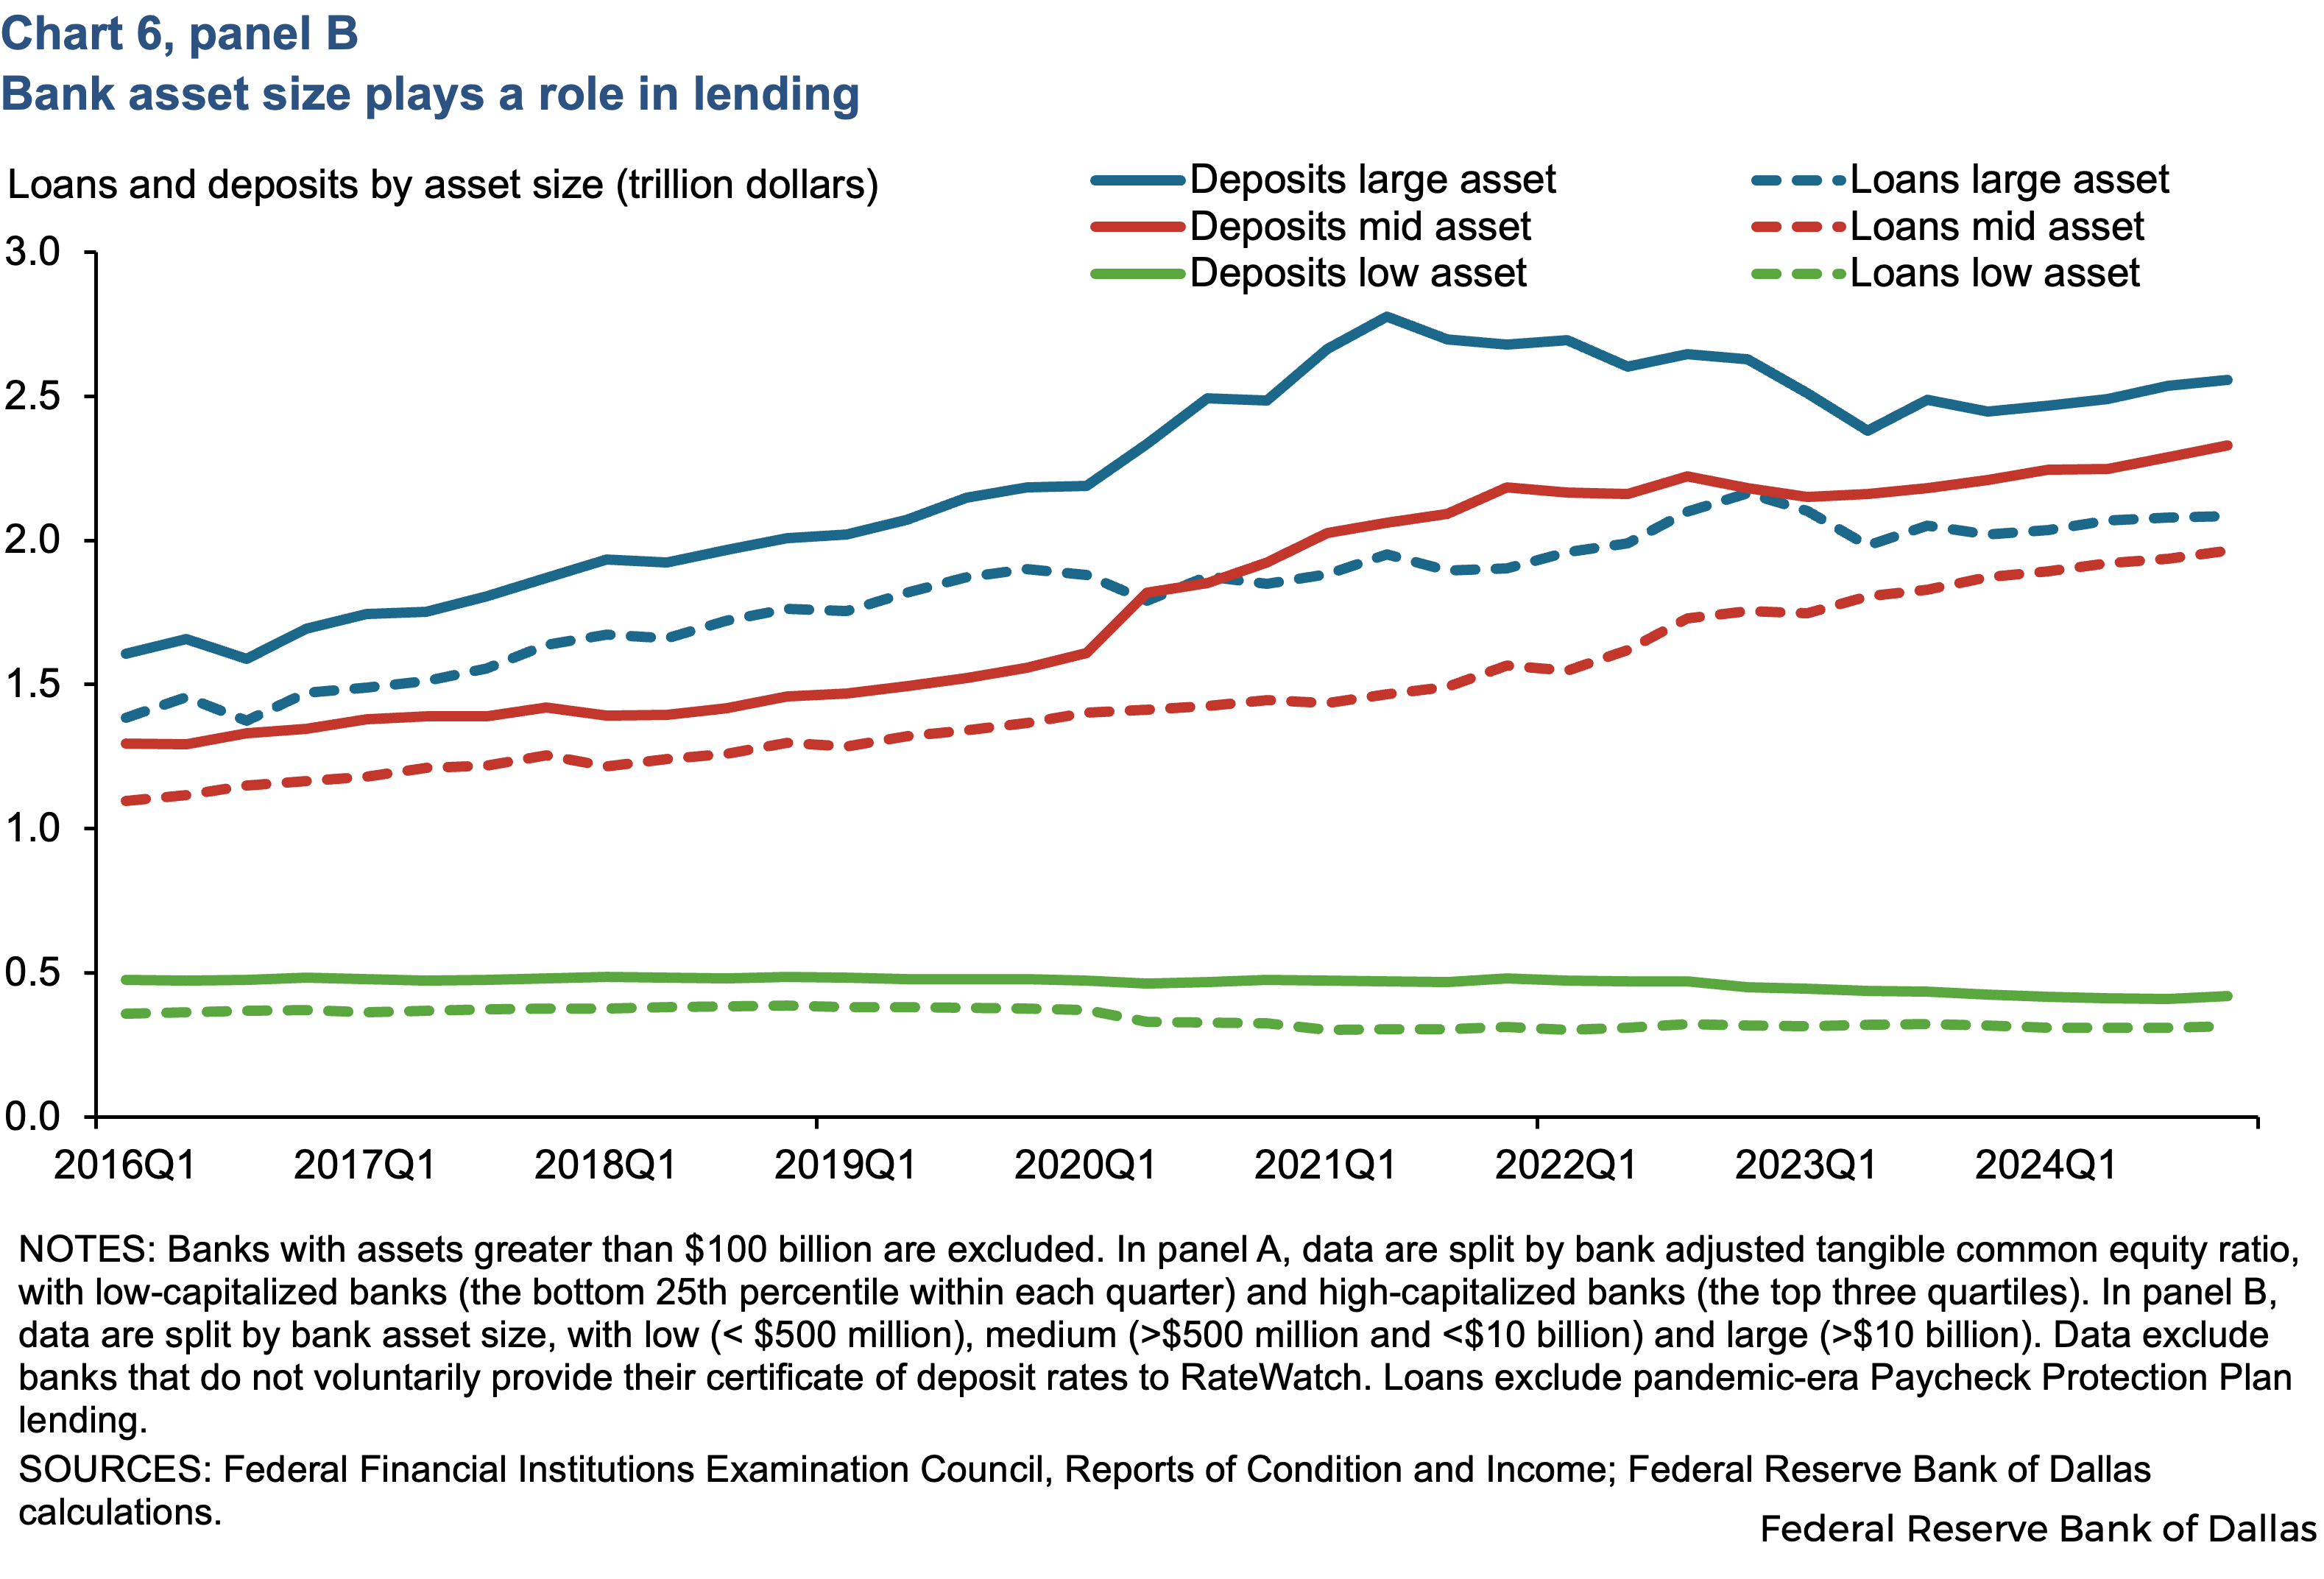
Banks with high capitalization lend more and their loan growth is positive after mid 2022, while banks with low capitalization actually show lending declines during the same period (Chart 6, panel A). Bank asset size also plays a role in lending. Large banks (regional banks) saw lending grow a little, although most postpandemic loan growth has been among mid-size banks (community banks with asset size between $500 million and $10 billion), as shown in Chart 6, panel B. However, small community banks show almost no loan growth. Small banks typically have limited access to financial markets and complex financial products, and they rely more on deposits for loan growth. They engage more in relationship banking and local investment, and small banks face challenges to compete with large banks to attract depositors.
In summary, while banks have seen their deposit rates climb in recent years, this doesn’t reflect fear among depositors for their banks’ financial health due to unrealized securities losses. Instead, some banks are eager to make more loans, and depositors are chasing those returns. Since the Fed started raising rates in 2022, banks with the highest levels of capital available have found some of the best opportunities to grow their loans, and these banks convinced depositors to fund those loans by offering competitive deposit rates. As banks compete for depositors in 2026, they may have more success advertising high rates instead of high capital ratios.
About the author

Ben Munyan is director of the Supervisory Policy Department and a senior economist at the Federal Reserve Bank of Dallas.

Ozge Ozden is a senior research economist at the Federal Reserve Bank of Dallas.

Alessio Saretto is an assistant vice president in the Research Department at the Federal Reserve Bank of Dallas.

Kristof Csaky is a risk specialist at the Federal Reserve Bank of Dallas.

Hugo De Vere is a research analyst in the Research Department at the Federal Reserve Bank of Dallas.